
TradingEdge Weekly for Jul 1 - A historically volatile stretch, signs of a washout, a summer interlude

Key points:
- The past five weeks were one of the most volatile stretches ever
- There has been a notable recovery in short- and medium-term trends in the S&P 500 and Nasdaq 100
- There have been compelling signs of washed-out breadth followed by a turn in momentum
- It will be important to watch for a divergence in 52-week lows
- Consumer sentiment is languishing at a record low
- We're in the summer doldrums, but with a brief interlude
- The Real Estate sector tends to have an even better interlude
- Consumer Discretionary stocks might be poised for a rebound, too
- Growth has recovered somewhat versus Value
A volatile stretch with a recovery in medium-term trends
Investors have enjoyed a few days of relief. They deserve it after suffering through the most overwhelming selling pressure in history.
While the plunge to new lows was devastatingly lopsided, it's not like there haven't been attempts at a recovery, including last week. The S&P 500 has swung at least 5% weekly for four of the past five weeks. That ties it for the 2nd-most volatile five-week stretch since 1928.
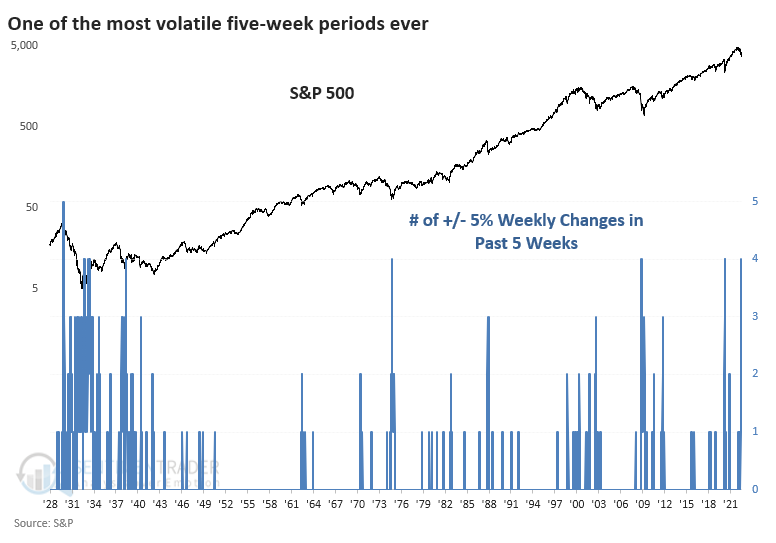
The handful of other times it suffered such volatile action over such a compressed time frame, it tended to lead to short-term weakness but long-term gains. Only three other periods can compare during modern markets; all three were at or near market bear market lows.
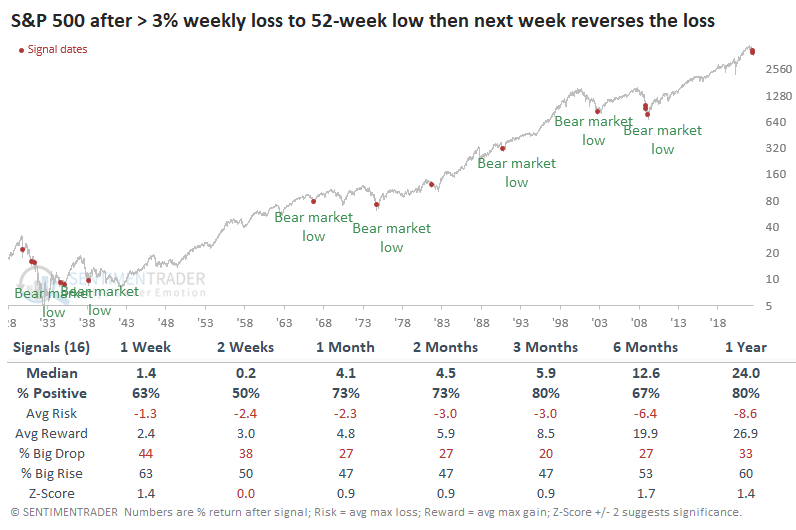
If we relax the 5% weekly swing threshold to 3%, then last week's reversal shows some impressive precedents when coming on the heels of a 52-week low. About half of them marked the ends of bear markets, or nearly so. Every signal since 1932 sported a positive one-year return.
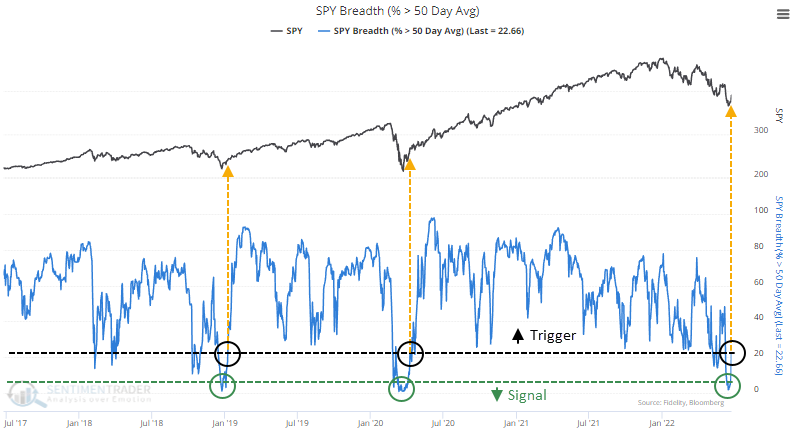
The recovery in the indexes showed broad participation. Recently, fewer than 2% of stocks within the S&P 500 were holding above their 50-day moving averages, one of the lowest readings in 70 years. Now, more than 20% have moved above their medium-term trend lines. The only times this happened in recent years marked the ends of bear markets.
If we go back to 1950, it's mostly the same conclusion. Out of 13 signals, only one of them failed to lead to a positive one-year return.
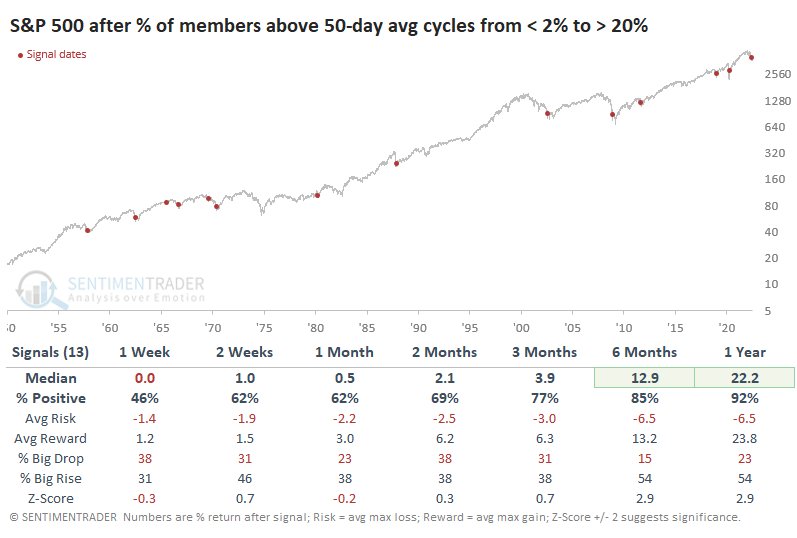
This was the fastest-ever recovery, taking fewer than five sessions. If we filter the table above to include the quickest reversals, those that take ten days or fewer, then medium-term returns improved considerably. All of the signals showed a positive return either two or three months later. The risk/reward skew from two months and beyond was tilted heavily toward "reward."
A shorter-term reversal, including for tech stocks
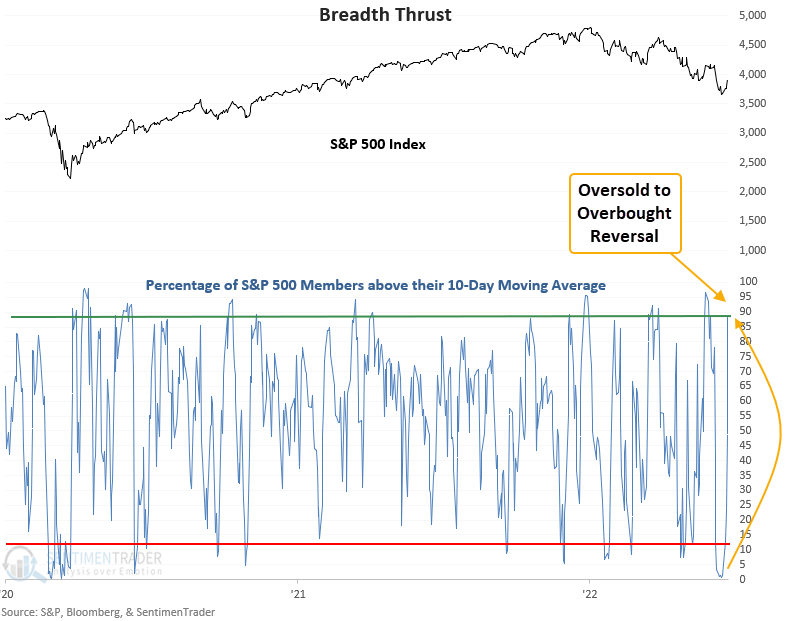
Dean showed results from another reversal using S&P 500 members' shorter-term moving averages. The algorithm identifies when the number of members trading above the 10-day moving average cycles from oversold to overbought in a brief period.
The number of S&P 500 members above the 10-day moving average reversed from < 2% to > 88% in only 4 sessions. That's one of the swiftest reversals in history.
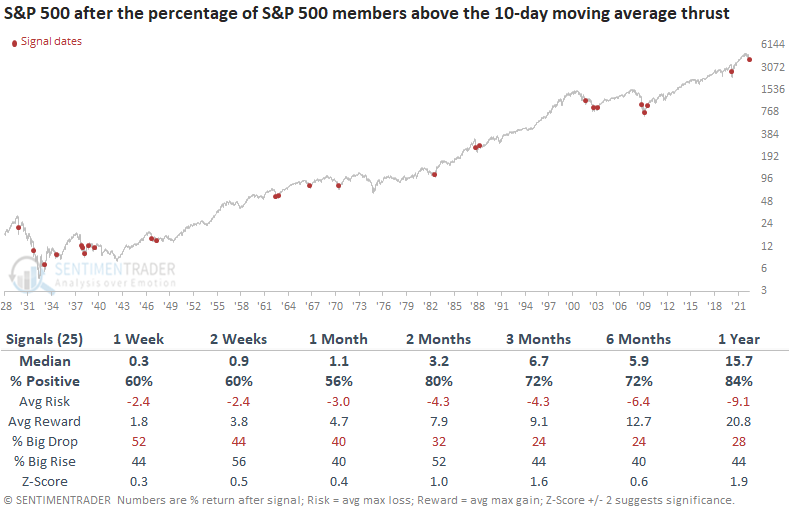
This model generated a signal 53 other times over the past 93 years. After the others, future returns and win rates were solid across all time frames. The 2-month time frame shows 36 out of 40 winners since 1947.
Within the context of a bear market, the model generated a signal 25 other times in the last 93 years. After the others, future returns and win rates were solid across all time frames. Once again, the 2-month window provides the best outlook for a near-term bounce.
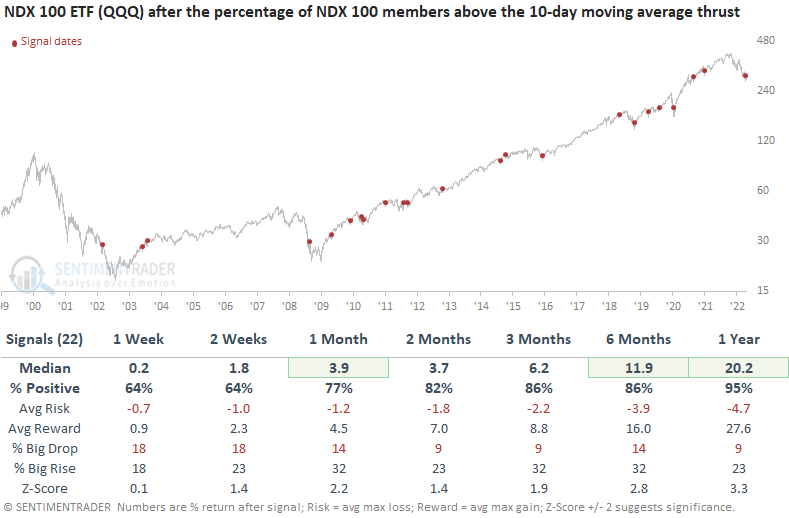
The same system using the Nasdaq 100 triggered an alert on Friday when the number of members above the 10-day average cycled from < 7% to > 90% in 7 sessions or fewer. While the outlook for the technology-heavy index appears excellent, we need to remember that most instances occurred in bull market environments. The two bear market signals show significant drawdowns in the 1-month window.
Signs of a washout
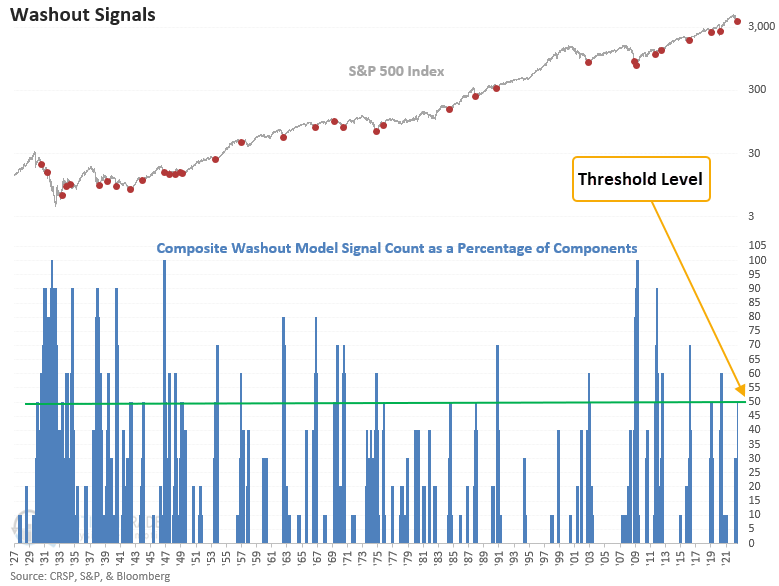
The jump in oversold conditions and then a reversal in the S&P 500's momentum triggered a signal in Dean's TCTM Composite Washout Model.
A signal occurs when more than half of the indicators in the model trigger an oversold condition and then S&P 500 momentum turns favorable. The momentum condition can be helpful to avoid trying to catch a falling knife. If positive price action fails to develop, the signal will not trigger.
Dean created the Composite Washout Model to identify potential turning points around bear market lows. It contains 10 components with a heavy reliance on breadth-based indicators. The model issued an alert for only the 35th time since 1928. The last instance occurred in March 2020, which led to a substantial rally.
This model generated a signal 34 other times over the past 92 years. After the others, S&P 500 future returns, win rates, and z-scores were solid across all time frames. The 2-month window contains only 2 drawdowns greater than 5%.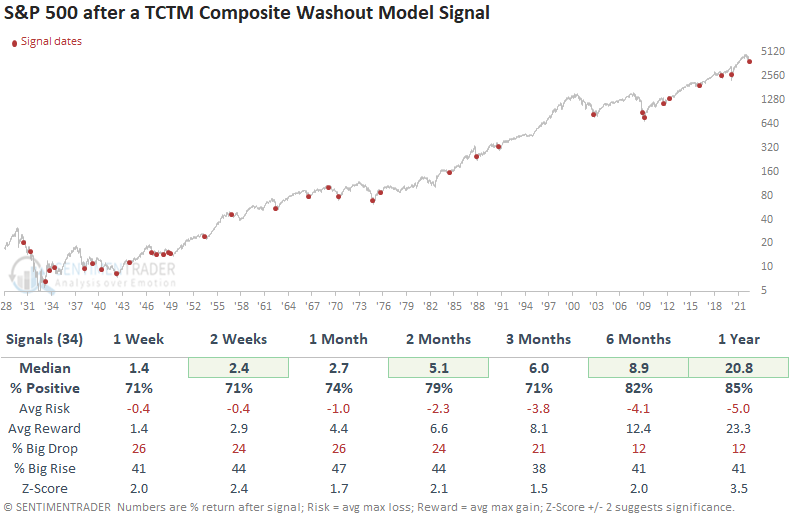
Now, a crucial signal to monitor in bear markets
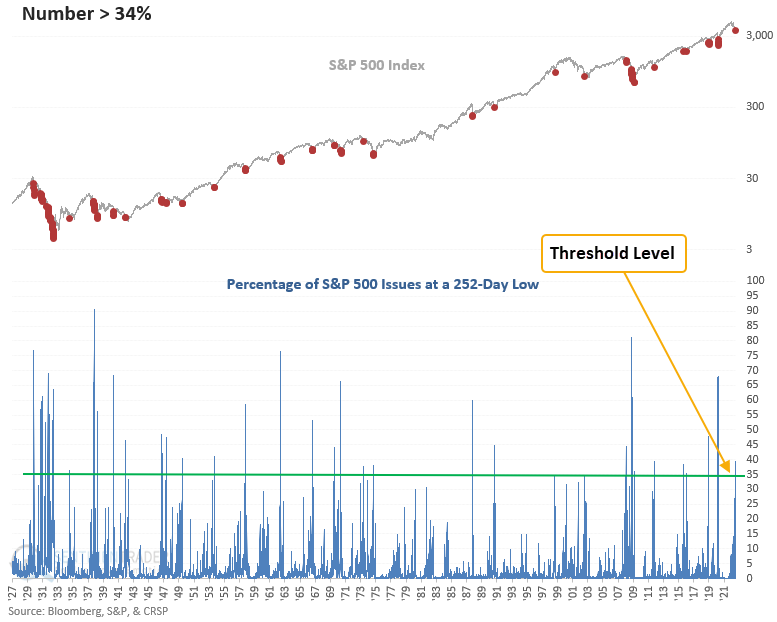
Dean also noted that the composite model mentioned above contains 10 components, 3 of which seek to identify a divergence in new lows. This divergence signal has not triggered yet, since new lows are still rising on each subsequent lower low in the S&P 500.
It's somewhat troubling that 2/3 of the new low divergence components did not trigger a signal. Historically, meaningful market lows occur when fewer issues register a new low as an index records lower lows. Market participants call this a divergence.
The new lows divergence model requires the percentage of new lows to exceed 34%. Once achieved, the model will trigger an alert if the percentage of lows is less than that level and the S&P 500 registers a lower low.
Suppose we compare the maximum percentage of 252-day lows in a bear market to the level at the final low in the index. In that case, we see a difference in all but one instance. Historically, markets bottom when lows are contracting.
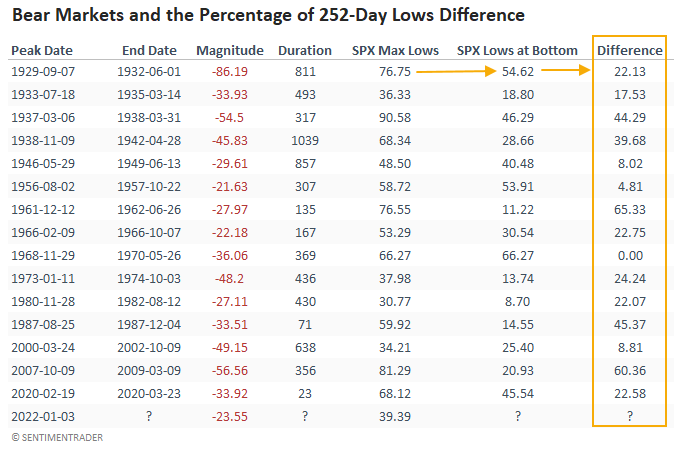
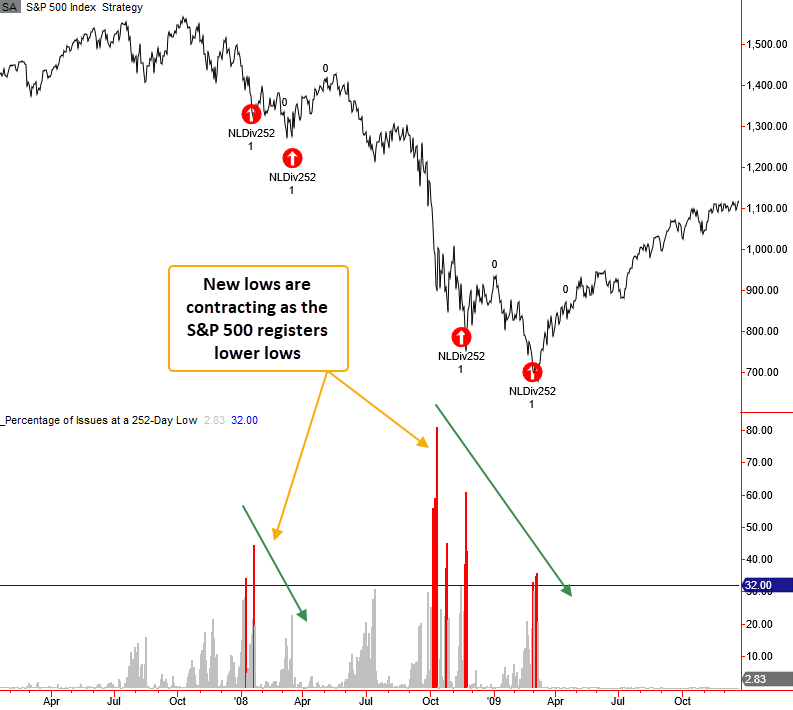
Dean then went through each major bear market since 1928 showing what to watch for, including 2008, for example.
No wonder confidence is so low
The University of Michigan Consumer Sentiment Index is a consumer confidence index published monthly by the University of Michigan. The index is normalized to have a value of 100 in December 1964. Jay showed that it just plunged to an all-time low.
The chart below highlights those rare occasions when the U of M consumer confidence poll dropped below 58% for the first time in 12 months.
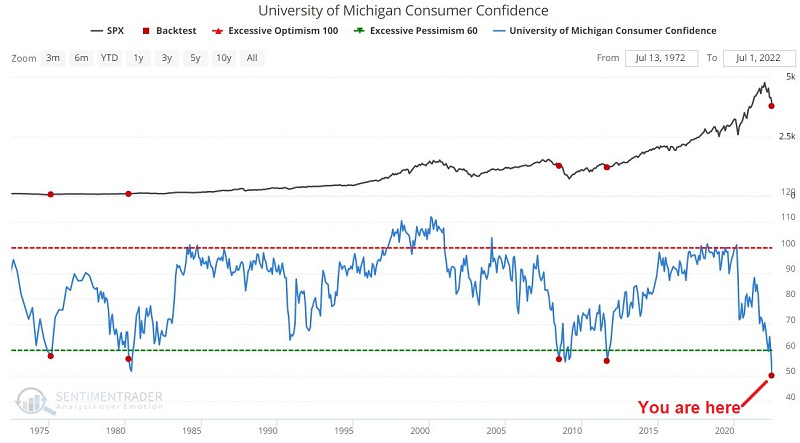
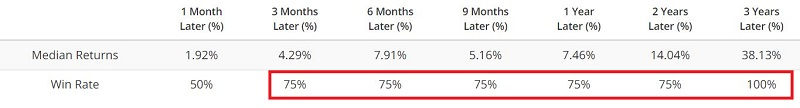
It is clear that the 2008 signal was too early and that the market fell hard (the ultimate low occurred eight months later) and took quite a while to rebound. Highly favorable results followed the other signals over one to three years.
The dog days of summer...with an interlude
Jay noted that the phrase "Dog Days of Summer" applies very aptly to overall stock market performance during the summer months of June, July, and August. But one period tends to shine (and makes the rest of the summer look that much worst by comparison).
The chart below displays the cumulative % return for an investor who held a long position in the S&P 500 Index every year ONLY during June, July, and August, starting in 1940.
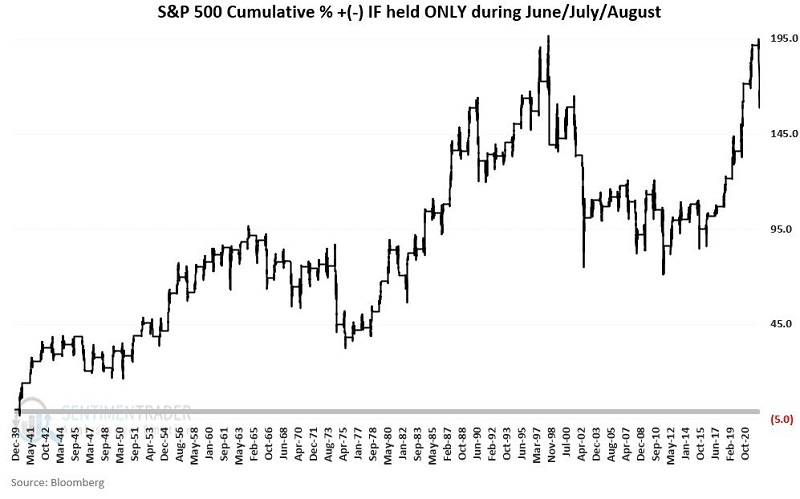
Doesn't look too bad. But the cumulative % return for an investor who held a long position in the S&P 500 Index every year ONLY during June, July, and August, starting in 1940 was +168%, compared to +11,240% when holding only during ALL MONTHS OTHER THAN June, July, and August, so a vast difference there.
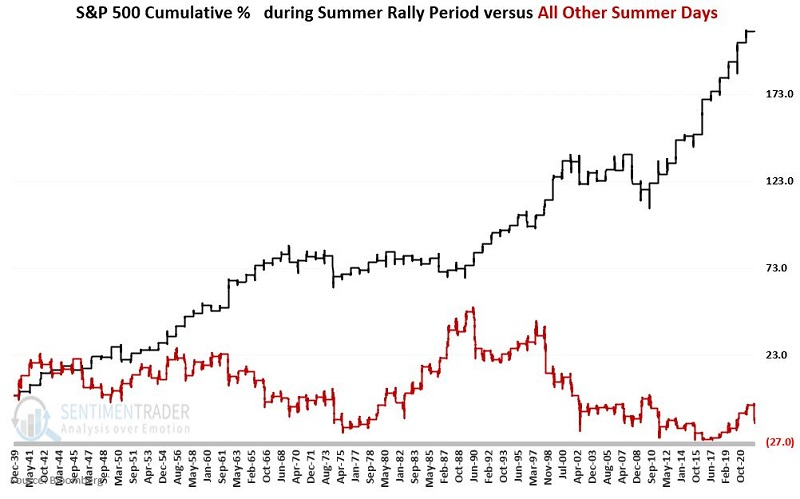
There is a brief summer period that has been beneficial to bulls, however.
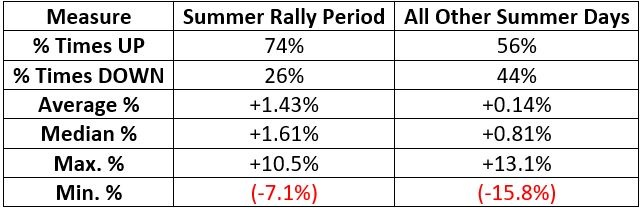
The period we will focus on incorporates 12 trading days by combining the last three trading days of June through the first nine trading days of July. For 2022, this period extends from the close on 6/27/2022 through the closing on 7/14/2022.
We will refer to all other trading days during June, July, and August as "All Other Summer Days."
In the chart below:
- The black line displays the cumulative return (+209%) for SPX during the "Summer Rally Period"
- The red line shows the cumulative return (-13%) for SPX during "All Other Summer Days"
The table below displays a summary of results for Summer Rally Periods versus All Other Summer Days.
An even better summer rally bet - Real Estate
Jay further showed that while the overall stock market has shown a long-term tendency to be quite uninspiring from June into September. But the real estate sector has shown a long-term tendency to outperform the overall stock market during this typical period of summer doldrums. Plus, sentiment in the sector is starting to recover from deep pessimism.
The chart below displays the annual seasonal trend for ticker IYR (iShares U.S. Real Estate ETF).
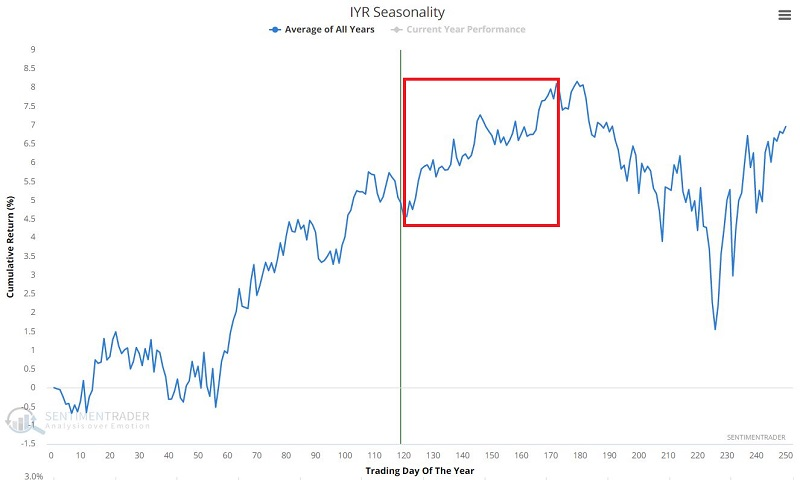
Note the seasonally favorable period that extends from Trading Day of the Year (TDY) #121 through TDY #172. For 2022, this period extends from the close on 6/27/2022 through the close on 9/8/2022.
For testing purposes, we will use real estate sector data from 1953 through 2021. Let's compare the performance of the real estate sector during the seasonally favorable period versus the performance of the S&P 500 Index.
- The black line in the chart below displays the growth of the Real Estate sector if held only from TDY #121 through TDY #172 each year from 1953 through 2021.
- The red line shows the hypothetical cumulative growth for the S&P 500 Index during the same period.
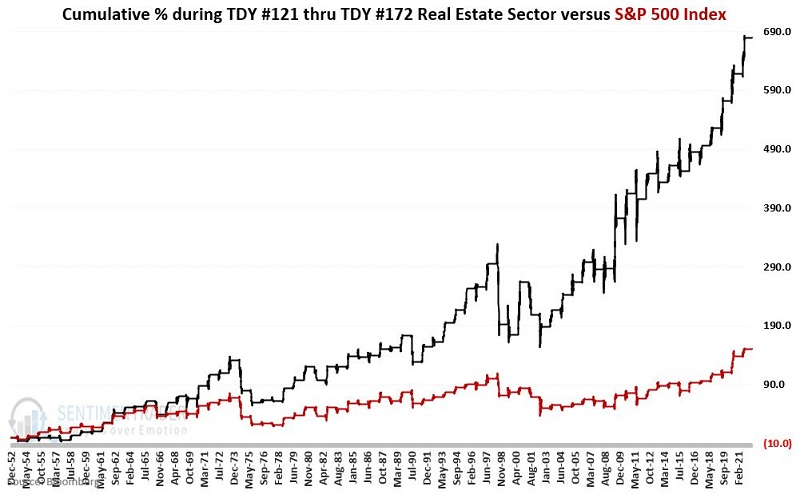
The cumulative hypothetical % gain for the real estate sector was +680%, versus +151% for the S&P 500.
And maybe Consumer Discretionary?
Jay noted that the consumer discretionary sector has been in a solid downtrend since November 2021. Several indicators - including insider action, breadth, correlations, and seasonality are suggesting better days ahead for this troubled sector
The current price trend for XLY (Consumer Discretionary Select Sector SPDR Fund) is clearly unfavorable. From the November 2021 high to the June 2022 low, XLY lost -36% before rebounding ever so slightly. On a trend-following basis, the ETF remains well below its 200-day moving average, and the 200-day moving average has rolled over and is itself now in a downtrend.
Indeed not a bullish picture. But shown below are a couple of factors that seem to be arguing for better days ahead.
"Smart money" corporate insiders are buying. The chart below displays those times when the Corporate Insider Buy/Sell Ratio - XLY indicator crossed above 0.24.
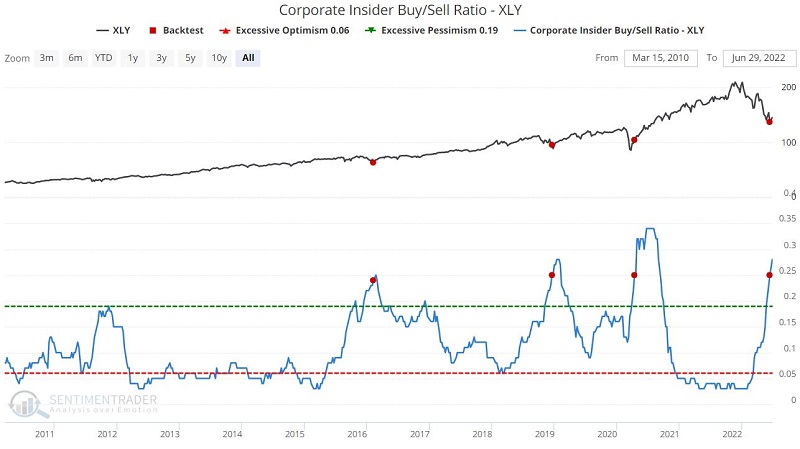
This is an exceptionally small sample size (from a very favorable overall period for stocks), and insiders are not always right. Still, the implication is pretty apparent - insiders of the companies that comprise ticker XLY are bullish on their stocks.
High component correlation for an index fund typically occurs when the price is in a downtrend and often highlights a period when investors are dumping the stocks in the index indiscriminately in a bearish panic.
The chart and table below display those times when the XLY Component Correlation crossed above 0.70 for the first time in six months.
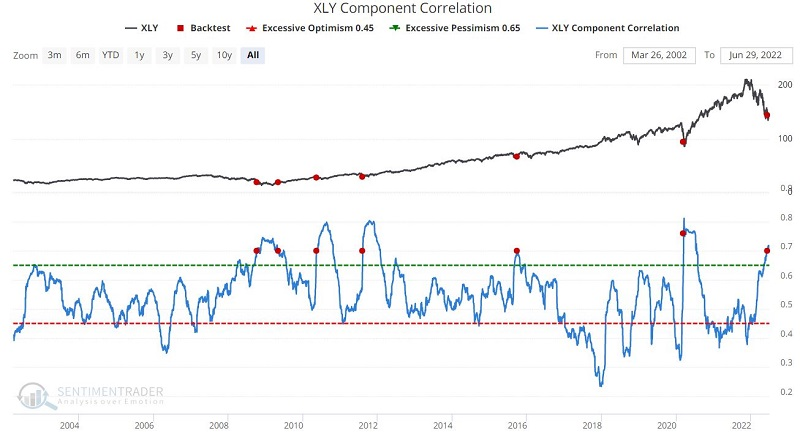
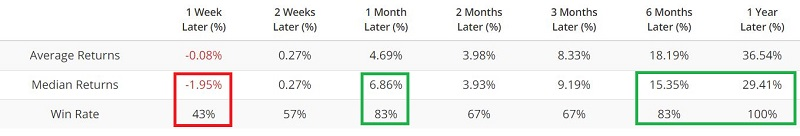
If XLY breaks down through recent support like a hot knife through butter, then all bets are off. However, as long as the recent low holds - or if it is taken out temporarily, then price reverses back above the "line in the sand," aggressive traders might consider looking for an opportunity to play this sector.
Growth is back, kind of
Growth is back. Well, kind of - it's still early days.
After falling to a 52-week low on May 24, the ratio of Growth to Value stocks shot higher and stabilized. When the S&P 500 plunged to a new low in mid-June, Growth stocks held up relative to Value. That's the first real positive divergence during this bear market.
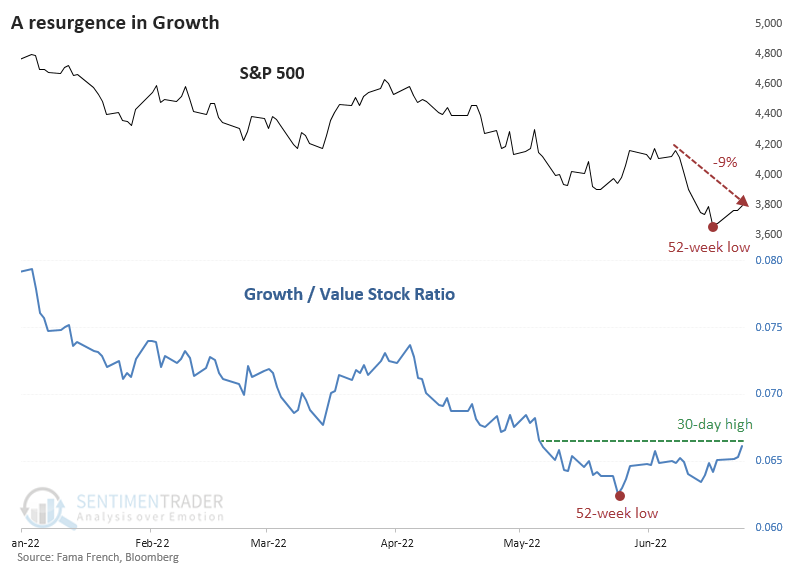
By late last week, the Growth/Value Ratio had climbed to a 30-day high, while the S&P was still more than 9% below its own high. Because of the rush to tech stocks during the pandemic, a similar divergence triggered in early March 2020, which was a horrible buy signal for the broader market.
But during "normal" market conditions, whatever those are, when the Growth/Value Ratio leads the S&P, it has mostly been a good sign. Not perfect, by any means, with a few double-digit losses.
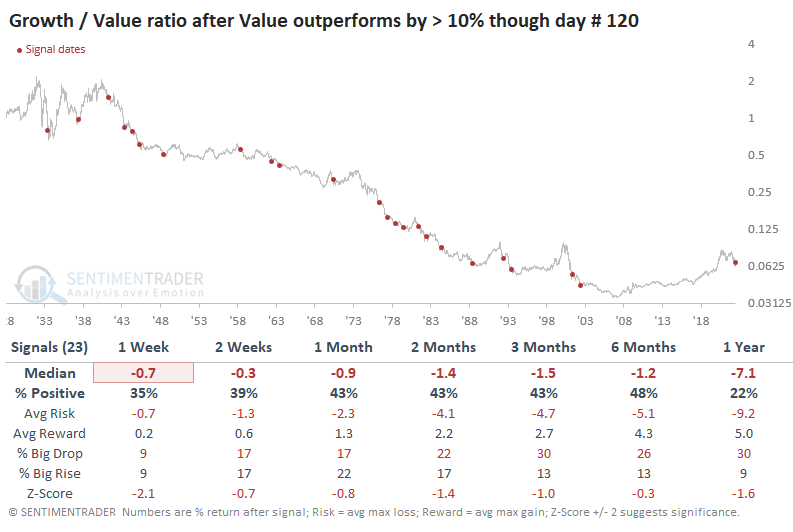
The rebound in Growth versus Value comes on the heel of what had been a massive trend toward the latter. Value outperformed Growth by well over 10% through the 120th trading day of the year, its widest outperformance since 2002.
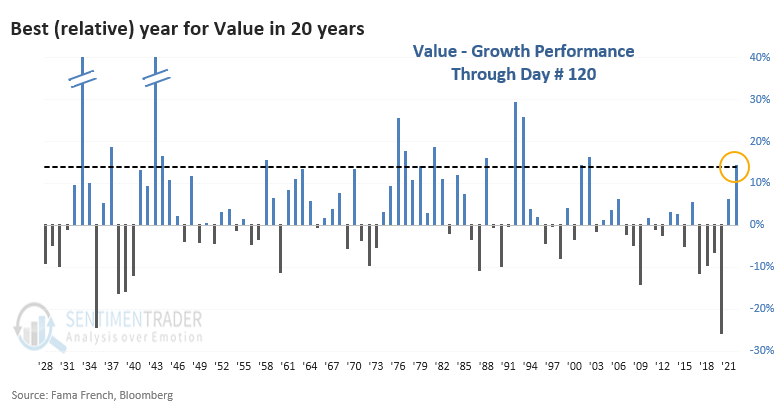
This didn't necessarily signal much for the months ahead; through year-end and next June, returns in the S&P 500 were pretty weak.
That weakness is mainly due to pre-1950 when there was Saturday trading and day #120 only went through May. Post-1950 returns improved.
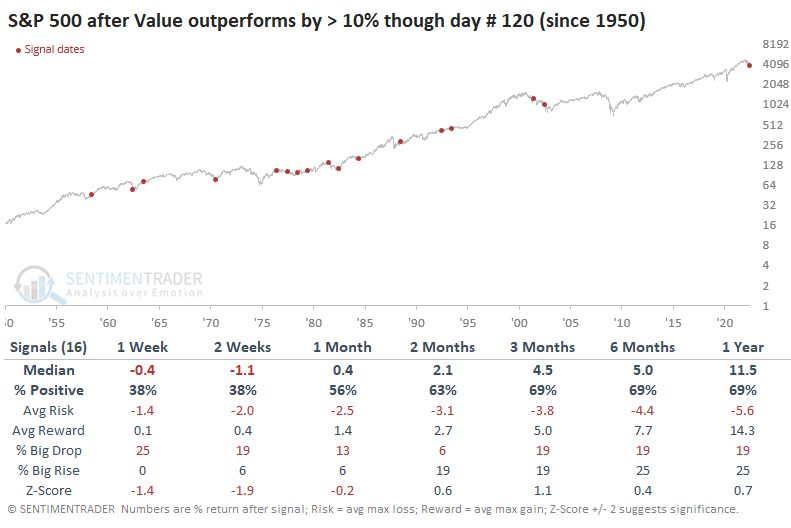
Even so, it wasn't a good sign for Growth.
About TradingEdge Weekly...
The goal of TradingEdge Weekly is to summarize the research published to SentimenTrader over the past week. Sometimes there is a lot to digest and this summary is meant to highlight the highest conviction or most compelling ideas we discussed. This is NOT the full research that's published, rather it pulls out some of the most relevant parts. It includes links to the published research for convenience; if you don't subscribe to those products it will present the options for access.