
TradingEdge Weekly for Jan 20 - Thrusts, returning confidence, falling inflation, poor macro conditions

Key points:
- More signs of broad-based and global breadth thrusts
- Cyclical sectors are seeing longer-term internal recoveries
- Dumb Money Confidence has hit its highest level in a year
- Macro conditions continue to be a major headwind
- A dramatic drop in the Producer Price Index is positive for the DJIA
- Credit markets are pricing in a lower probability of trouble ahead
- A longer-term looking at using credit spreads to invest in stocks is now bullish
- Treasury bonds aren't out of the woods yet
More signs of thrusts
Like many of you probably are, we get tired of hearing about breadth thrusts. They arguably triggered several times last year and inarguably failed. With the increasing accessibility of data and software, the concepts of breadth and related movements have become commonplace and likely overdone. It's very possible that any edge gleaned from these over the decades has softened and maybe even evaporated, at least for the broader U.S. stock market.
At the risk of furthering the weariness, last week, Dean noted that thrusts are occurring across exchanges and even within sectors, factors, and other markets like bonds. When there are coordinated bursts of buying pressure like this, it has boded very well for future returns. And on a longer-term basis, if we look at 10- and 20-day moving averages of both Up Issues / Down Issues and Up Volume / Down Volume, we just cycled from a relatively low reading to a high one.
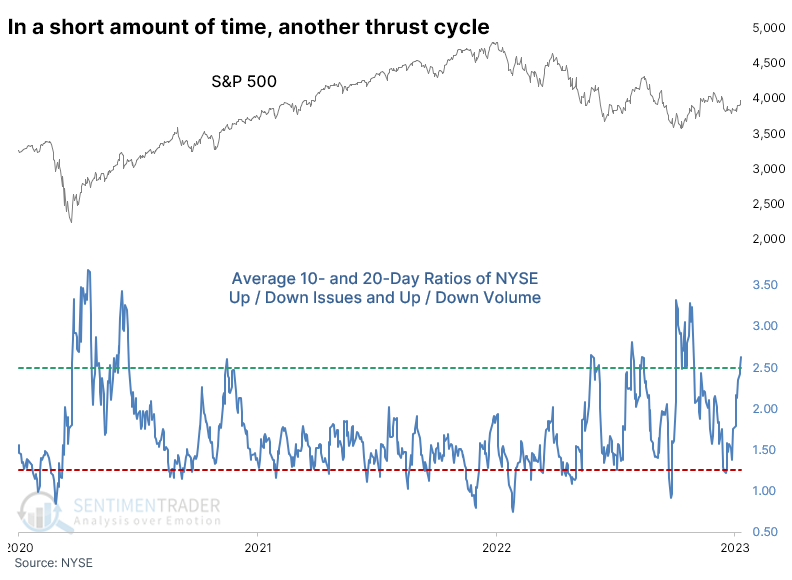
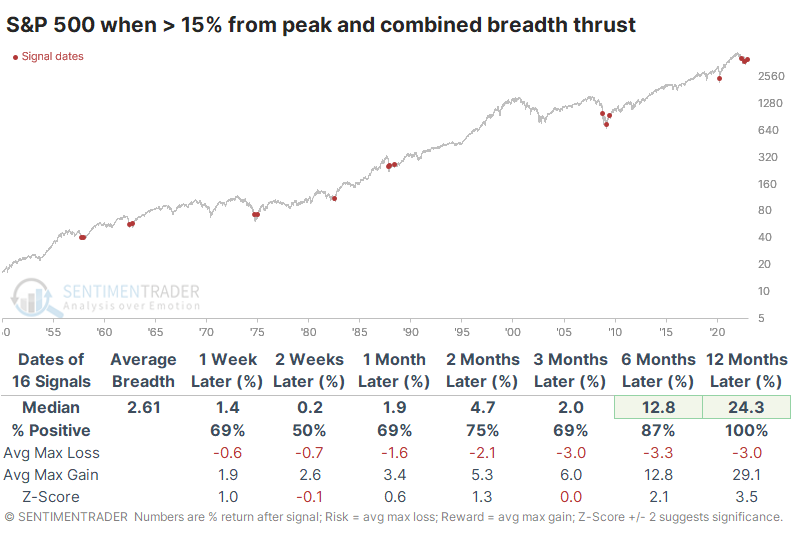
When these cycles occurred within a month, and the S&P 500 was well into correction territory, it never suffered a loss over the next year. On average, it returned more than 24%, and the risk/reward was skewed heavily to the upside.
We've also noted multiple times that stocks worldwide are advancing quickly, in many cases more impressively than in the U.S. Dean showed that as of last week, no major market index was in a bear market, a remarkable recovery from 2022. Coincident to that recovery, at least 90% of them were holding above their 200-day moving average at one point last week.
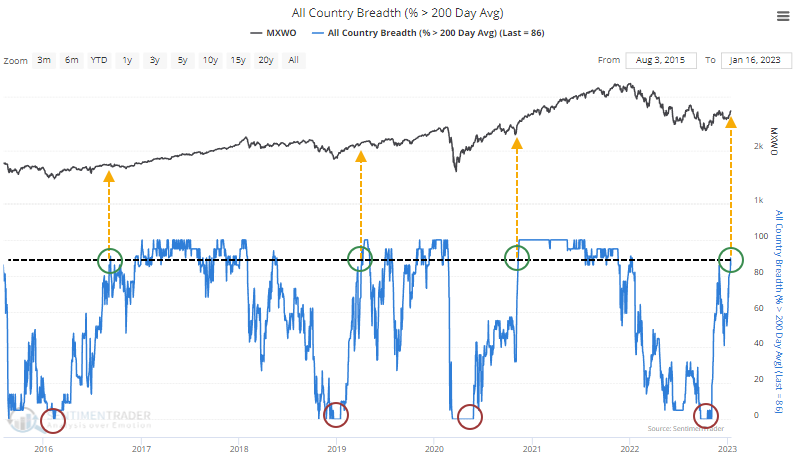
When these markets cycled from having no indexes above their 200-day average to more than 90% of them within 50 days, global stocks continued their rally in the months ahead every time. When the recoveries took longer - on average, twice as long - forward returns were significantly lower and more prone to limited gains and large losses.
Cyclical stocks stage impressive recovery
In the last few months, we've shared several research notes highlighting impressive recoveries in various cyclical/value-oriented sectors like Industrials, Financials, and Materials. Last week, the Consumer Discretionary sector turned the corner. Dean noted that now longer-duration measures are improving.
The percentage of issues with their respective 50-day average > 150-day average for cyclical sectors cycled from < 20% to > 60%, triggering a buy signal for the broad market for only the 18th time in more than 60 years.
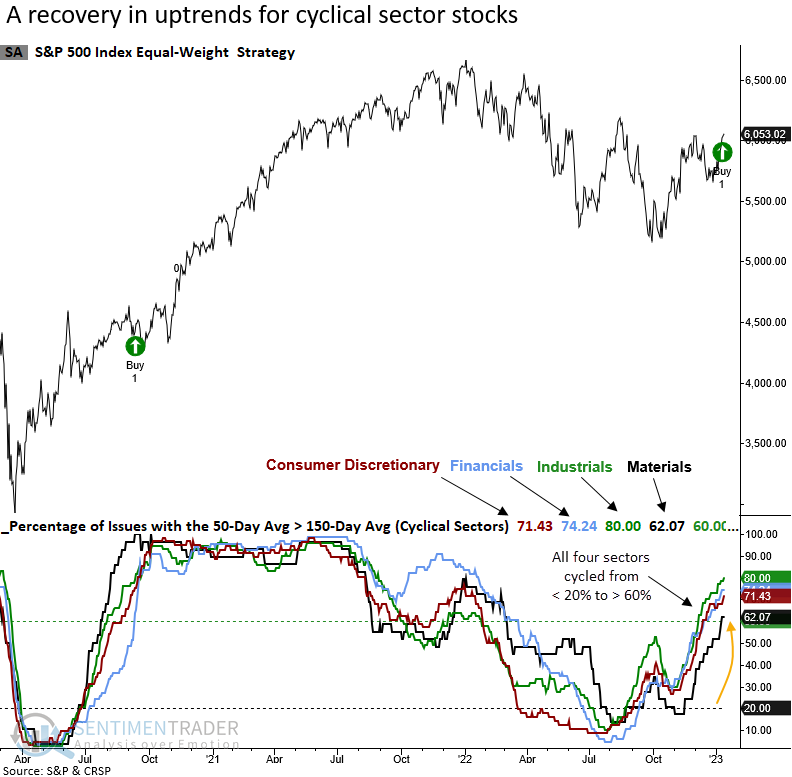
When the percentage of stocks with their respective 50-day average > 150-day average for cyclical sectors cycles from < 20% to > 60%, forward returns for the equal-weighted S&P 500 index were excellent across all time frames. The signal marked the end of 20%+ drawdowns in 8 out of 9 cases, with 2002 being the exception.
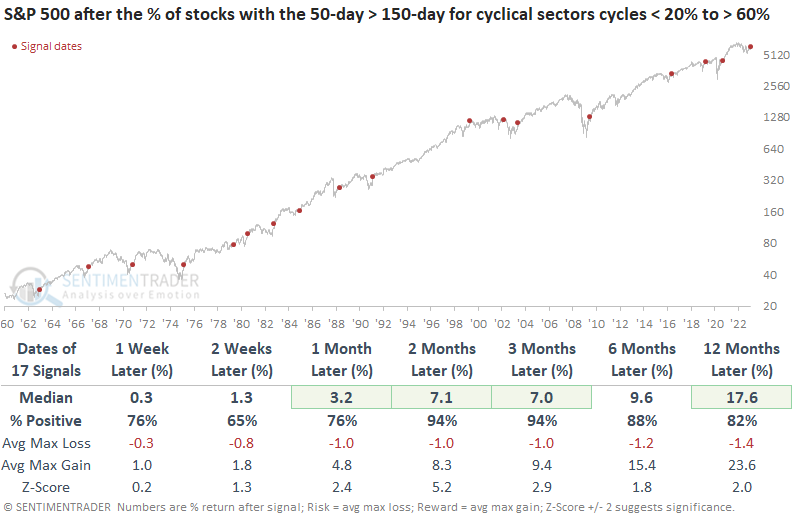
Typically, the recovery in cyclical sector stocks foreshadows an end to significant drawdowns. When it does, passive investors would have been rewarded by allocating to the equal-weighted S&P 500 index, as it tends to outperform the cap-weighted index up to a year later.
When applied to the two different index weighting methodologies, equal-weighted cyclical sectors consistently outperformed cap-weighted ones across most time frames.
Internal recoveries helped pushed sentiment to a one-year high
After a promising start following a miserable year, investors are feeling much better. While some metrics disagree, the indicators that constitute Dumb Money Confidence have recovered enough to exceed the peak from last August. Trend-following investors are now the most optimistic they've been in over a year.
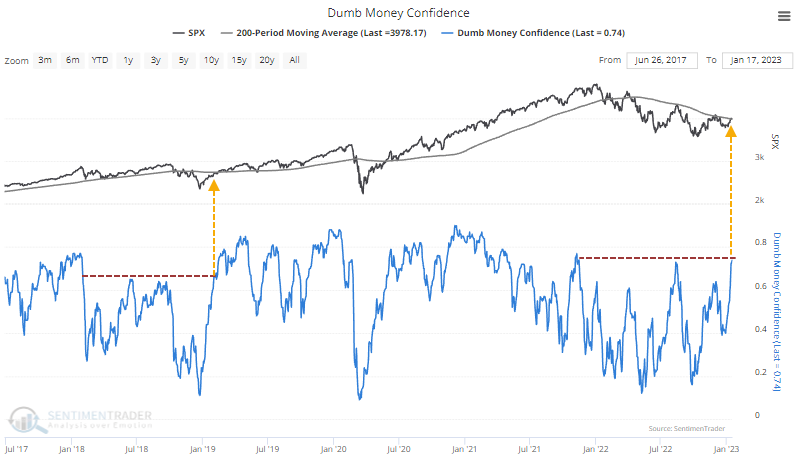
During a bear market, high levels of Confidence are not a good thing. We saw that spectacularly in August.
Historically, a breakout to a fresh one-year high in Confidence has preceded mixed results for the S&P 500. Between one and three months later, the index gyrated between positive and negative returns.
However, the most negative returns tended to occur when Confidence became very high and stocks were already doing well. Every time the S&P suffered a loss over the next three months, it had been more than 5% above its 200-day moving average.
The table below shows breakouts in Confidence that triggered when the S&P was less than 5% above its 200-day average. There were still some shorter-term losses in the signals, and relying too heavily on a sample size of four is tough. But over 25 years of history, these are the instances that are most similar to our current scenario.
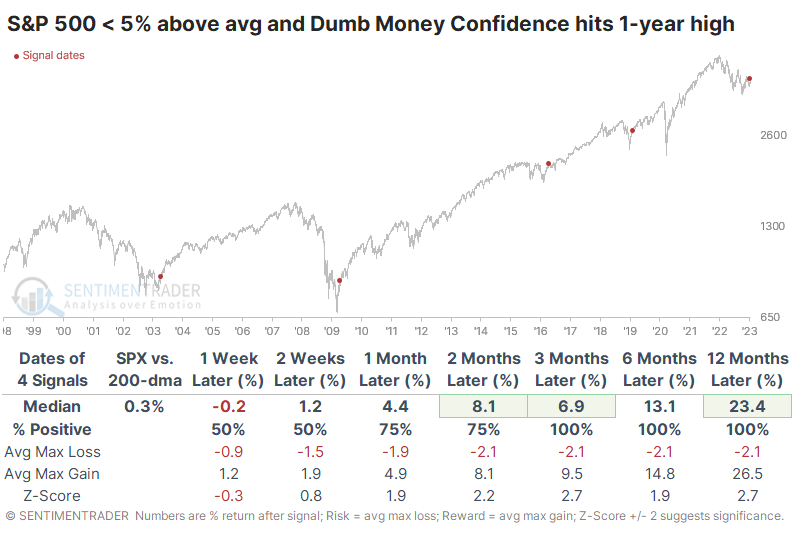
If the current environment looks anything like those signals, then Technology, Discretionary, Industrials, and Small-caps have featured the best returns. Of course, one can argue against this because of Federal Reserve policy now vs. then, but people who make that argument tend to believe the Fed is all-knowing, all-seeing, and all-doing, so nothing else matters, anyway.
Fundamentals are STILL a major headwind
As has been the case for well over a year, the biggest headwind facing stocks has been fundamentals. Dean showed that our Macro Index Model and other macro-based indicators continue to paint a negative outlook for stocks.
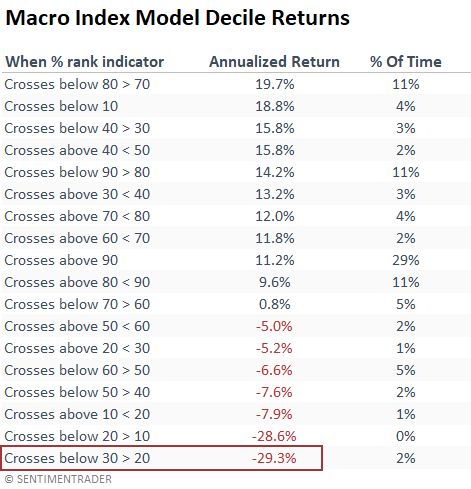
The SentimenTrader Macro Index Model combines 11 diverse economic indicators to determine the state of the U.S. economy. With the most recent update, which captured the final December numbers for several components, the model deteriorated to a level associated with extremely negative annualized returns for the S&P 500. Prior readings of less than 30% have foreshadowed a recession in 7 out of 7 instances.
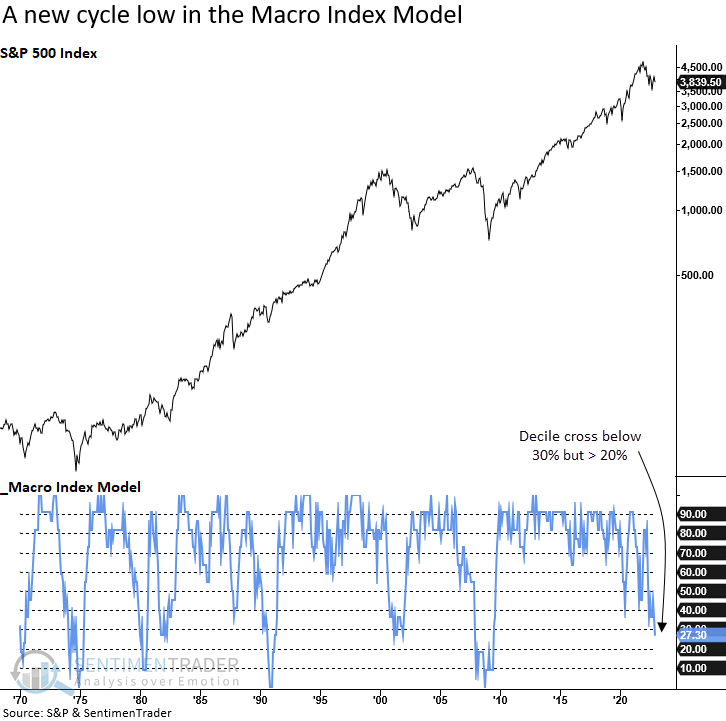
When the Macro Index Model crosses below 30% but remains above 20%, annualized returns for the S&P 500 look abysmal. And if the ranking falls below 20%, it's not much better. However, a cross below 10% suggests good things could happen. i.e., it's so bad, it's good.
Dean's economic and consumer sentiment composite, which measures survey data from small businesses, housing, manufacturing, consumers, and the service sector, crossed below 20% but remains above 10%. Once again, we see another indicator at a decade low.
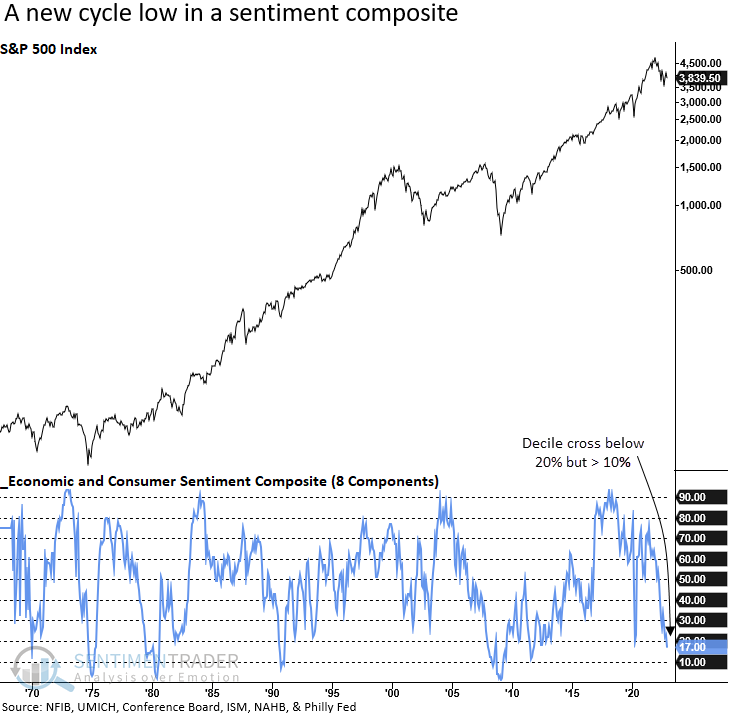
The recent deterioration in the economic and consumer sentiment composite represents the second worst decile bracket, with a -3.5% annualized return. As with the Macro Index Model, the outlook improves significantly should the composite fall further.
He further looked at ranks in several other macro indicators, all showing poor or negative annualized returns when in their current regimes.
One gauge of inflation is receding quickly
Jay noted that the Producer Price Index (PPI) measures the average change over time in the selling prices received by domestic producers for their output. Changes in the PPI can have a profound impact on the economy and, by extension, the stock market. When PPI is not at an extreme, the implications are generally favorable for stocks.
What really matters to the stock market is not the raw value of the PPI but the rate of change. The rate-of-change in PPI identifies when inflation or deflation is accelerating and/or reaching an extreme level. The chart below displays the 12-month % rate-of-change for PPI since 1914. Extreme inflation or deflation creates a great deal of uncertainty within the economy.
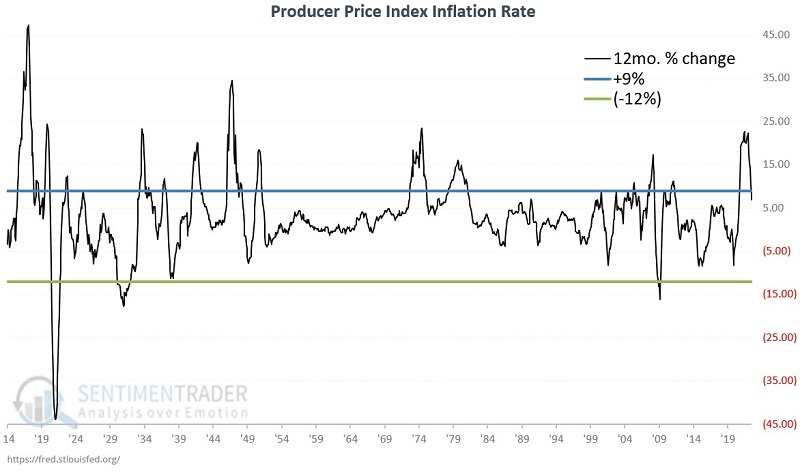
For testing purposes, when we say "PPI," from here on, we are referring to the 12-month rate of change in the raw monthly value. Defining "extreme" is somewhat arbitrary, but for our purposes, we apply the following rules, along with the return in the Dow Jones Industrial Average during those regimes since 1914:
- 9% or above = Extreme inflation (DJIA return: -70.7%)
- Below 9% and above -12% = Normal inflation (DJIA return: +925,100%)
- -12% or below = Extreme deflation (DJIA return: -76.0%)
Let's look at stock market performance when PPI inflation is not at an extreme level. The chart below (drawn on a logarithmic scale) displays the growth of $1 invested in the Dow Jones Industrial Average only during those months when the previous month ended with PPI inflation at or below +9% and at or above -12%.
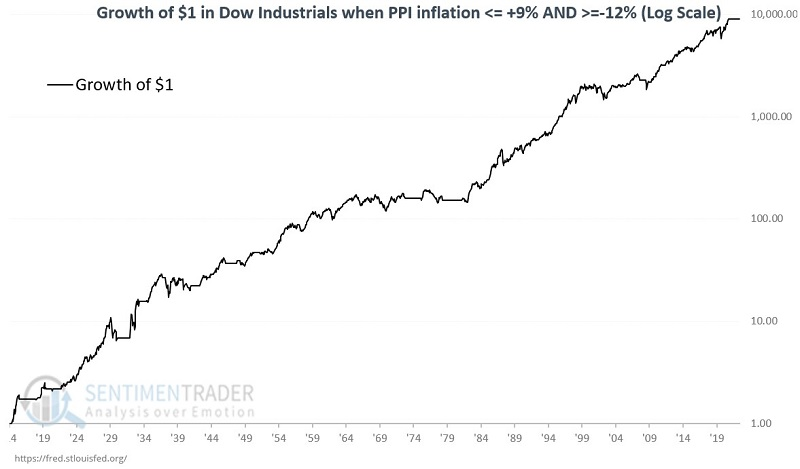
During December 2022, PPI inflation fell from +10.3% to +8.2%. While +8.2% is still a high inflation rate, that reading pushed our indicator back into the "normal" range. So this indicator is now considered favorable (or, at the very least, "not unfavorable") for stocks.
Credit markets have turned from a headwind to tailwind
Credit spreads can help highlight fear and complacency in the market. When there is stress and uncertainty in the financial markets, credit spreads tend to widen. Jay showed that a new trend in credit spreads appears to be favorable for the stock market.
The CDX Index monitors the spread between credit default swaps on high-yield bonds and Treasury securities. The higher the index, the wider the spread. This means that credit investors are more and more worried about defaults and are willing to pay higher prices for default protection.
We expect it to track volatility measurements like the VIX quite closely, so in a sense the CDX Index is a "fear gauge" that measures stress in the financial markets. To track the trend of the CDX Index, we will use a 14-week and a 25-week exponential moving average.
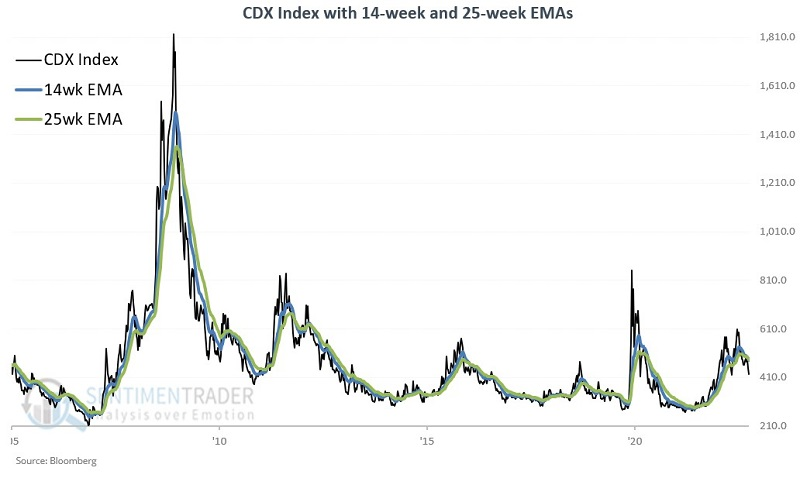
Note the spike during the Covid panic, then the reversal as the stock market turned around. Then the index started increasing in late 2021 as the stock market topped out.
The 14-week EMA just recently crossed below the 25-week EMA, thus flashing a favorable signal for stocks. The chart below displays the cumulative percentage performance for the S&P 500 Index if held long only when the CDX Index's 14-week EMA is below its 25-week EMA.
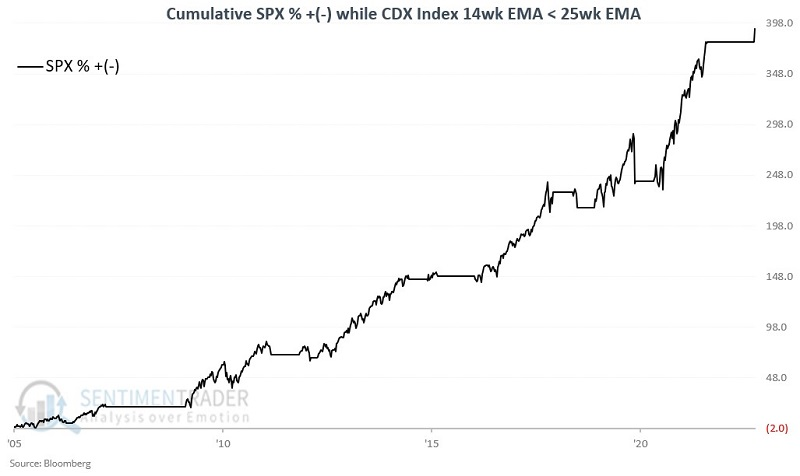
Since the CDX Index was first calculated in 2005, the S&P 500 has gained +380% when the 14-week EMA is below the 25-week EMA versus a loss of -28% when the 14-week EMA is above the 25-week EMA.
A longer-term look at credit spreads and stock performance
Jay noted that a longer data series, the ICE BofA US High Yield Index Option-Adjusted Spread, also has a current trend lends weight to the bullish case for stocks.
Because the stock market hates uncertainty, rapid growth in this spread is often a warning sign for stock market investors. On the other hand, when the spread narrows, it tends to mark a decline in uncertainty in the financial markets and is generally favorable for stocks.
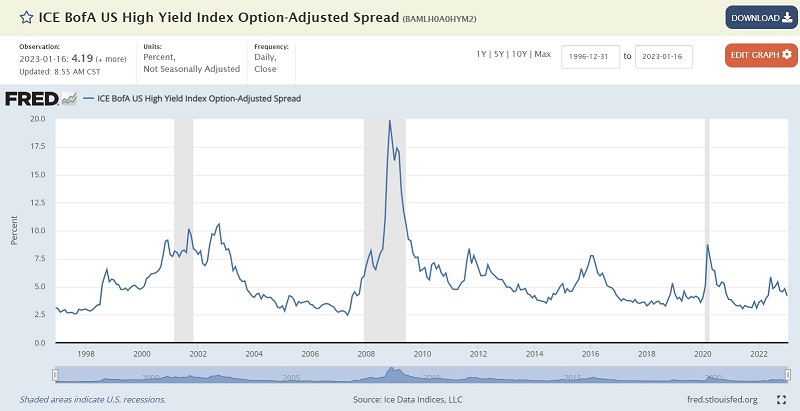
In the chart above, the grey periods represent US economic recessions. A widening spread almost invariably precedes recessions - however, not every increase in this spread is followed by a recession.
We will use week-ending data for this index and the S&P 500 Index. Our calculations are as follows:
A = week-ending value for The ICE BofA US High Yield Index
B = 13-week exponential average of A
C = 28-week exponential average of A
D = (B - C)
E = Current value for D - value for D two weeks ago
In plain English, we calculate a 13-week and 28-week exponential average and take the difference between the two. A positive reading means the spread (Variable D) is widening bearish for stocks), and a negative reading means the spread is narrowing (bullish for stocks). Additionally, we see if Variable D rose or fell over the last two weeks.
The chart below displays the difference between the 13-week and 28-week average (Value D) and its two-week change (Value E). Readings above 0 in either series are a warning sign of potentially unfavorable conditions for stocks and the overall economy.
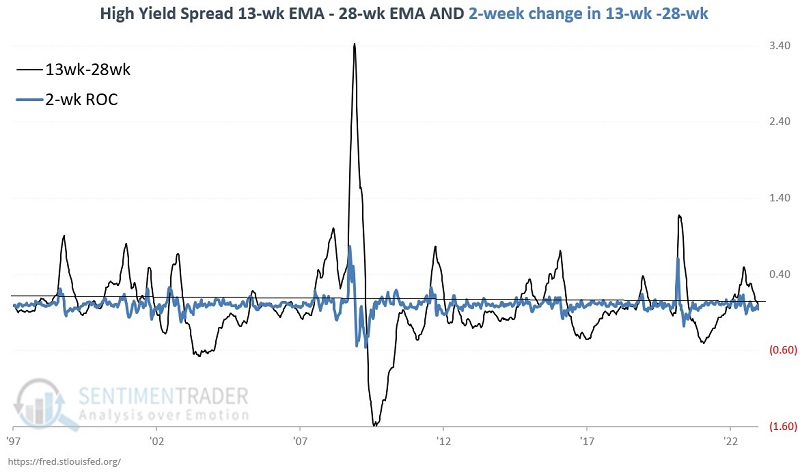
This method issues a warning sign for stocks and the overall economy when Variable D and Variable E are both above zero. This tells us that a) the credit spread is widening, and b) the velocity of the increase is increasing.
The chart below displays the hypothetical growth of $1 invested in the S&P 500 Index when EITHER Variable D or Variable E is negative.
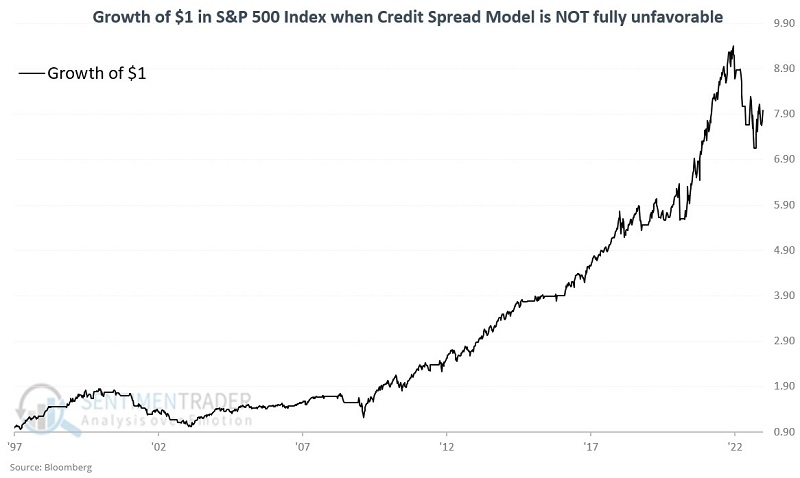
From 1/31/1997 through 1/13/2022, the S&P 500 Index lost -35% while this model was fully unfavorable and gained +698% the rest of the time.
As of the week ending 2023-01-13, the 13-week exponential average for the High Yield credit spread detailed above is below its 28-week exponential average. In addition, the two-week change in the 13-week EMA minus the 28-week EMA is declining. So neither of the two model indicators is unfavorable. Does this mean that it is smooth sailing for stocks from here? Not necessarily. But it does signal that a potentially significant weight has been lifted from the market's shoulders for now.
Treasury bonds aren't out of the woods yet
Jay showed that long-term treasuries presently face a combination of significant resistance and an unfavorable seasonal window. Options on TLT allow a trader to speculate on the short side of t-bonds with limited risk.
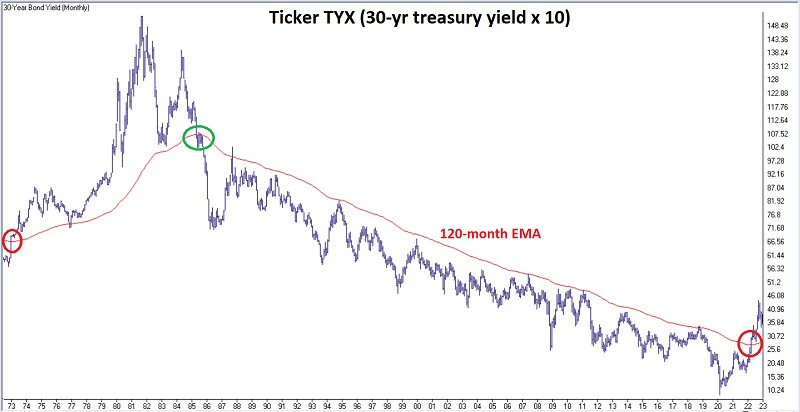
Interest rates tend to move in very long waves - often 30 years or more at a time. Ticker TYX - which tracks 30-year bond yields, has moved back above its 120-month exponential moving average. This suggests that we are now in a rising rate environment, and history suggests this environment could last for many years.
The annual seasonal trend for ticker TLT shows an unfavorable period extending from the close of Trading Day of Year (TDY) #10 through TDY #91. For 2023 this period extends from the close on 2023-01-17 through 2023-05-12. The chart below displays the growth of $1 invested in TLT during these windows.
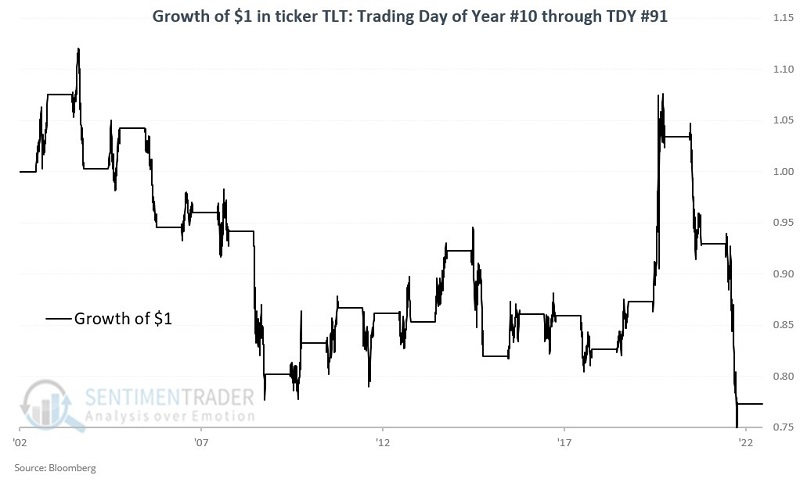
Since inception, the fund rallied 9 times and declined 11 times. Its average decline was larger than its average gain, and much more likely to suffer a large decline than enjoy a large rally.
The most straightforward approach to speculating on a decline in the price of TLT using options is to buy a put option. However, implied volatility for TLT options is on the higher end of the historical range. This tells us that an above-average amount of time premium is built into the price of TLT options. As a result, if we contemplate a trade using TLT options, we should recognize the potential for a subsequent decline in implied volatility to impact our trade.
About TradingEdge Weekly...
The goal of TradingEdge Weekly is to summarize some of the research published to SentimenTrader over the past week. Sometimes there is a lot to digest and this summary is meant to highlight the highest conviction or most compelling ideas we discussed. This is NOT the full research that's published, rather it pulls out some of the most relevant parts. It includes links to the published research for convenience; if you don't subscribe to those products it will present the options for access.