
TradingEdge Weekly for Feb 16 - Stocks and volatility are both rising, another risk-off signal, collaring NVDA

Key points:
- Stocks and implied volatility are rising at the same time
- The S&P 500 has enjoyed a historically calm and substantial rally
- Investors are moving back into equities as opposed to money market funds
- Another risk-off signal has triggered due to deteriorating stock performance underlying the S&P
- Small cap participation has been lagging badly, too
- While small caps have been lagging, more financial and industrial stocks have hit new highs
- Putting a collar on NVDA ahead of earnings to limit risk
- When to own (or not) bank stocks according to the calendar
- Chinese stocks just set an inglorious record
- Natural gas might finally have a better chance to rebound
Stocks have been rising...and volatility has, too
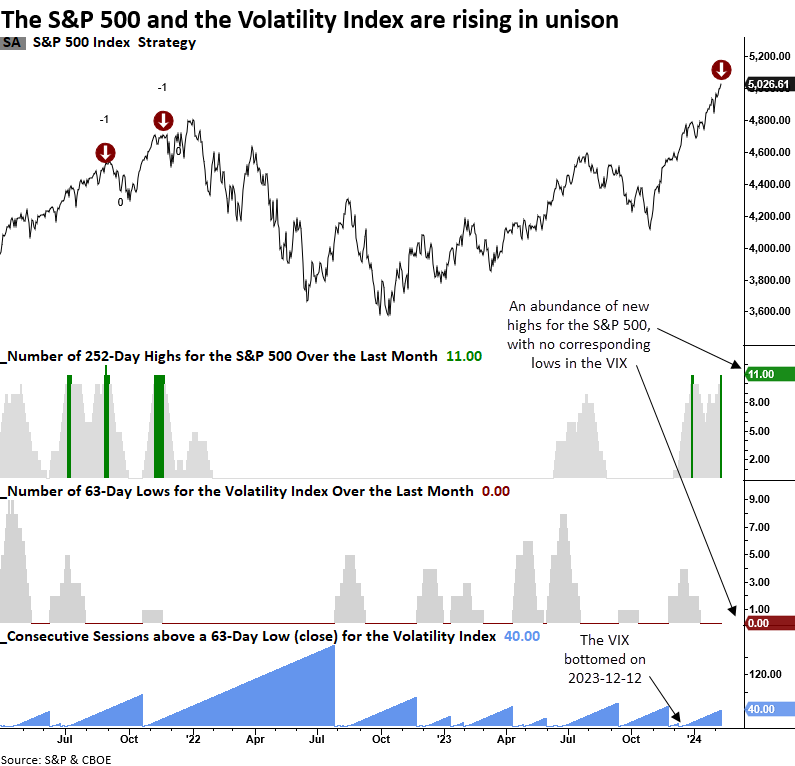
Over the last month, the S&P 500 has closed at a 252-day high on 11 occasions, while the Volatility Index (VIX) has failed to close at a 63-day low. Dean showed that similar conditions suggest the S&P 500 could experience a short-term correction.
In stock market uptrends, the S&P 500 and the Volatility Index (VIX) generally move in opposite directions. As stocks register new highs, the VIX makes new lows. However, sometimes, expected volatility troughs and rises ever so slightly as equities continue to rise.
A trading model that monitors this relationship triggered an alert on Friday. The previous signal occurred in November 2021, leading to a short-term stock correction.
During periods when the S&P 500 recorded a significant number of 252-day highs as the Volatility Index (VIX) failed to close at a 63-day low, the world's most benchmarked struggled over the subsequent month. While returns and win rates were pretty good over the following year, more recent precedents encountered difficulties.
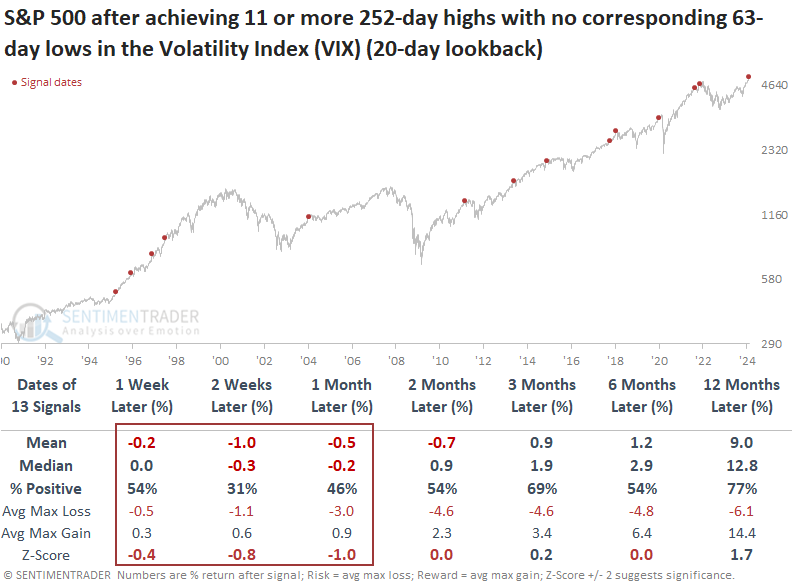
When I ran a test that shorted the S&P 500 after a signal, the optimization returned 16 sessions as the optimal holding period. At some point over the subsequent three weeks, the S&P 500 was negative in all but one case.
A historically calm and substantial rally
It's been months since the most benchmarked index in the world stumbled even slightly.
We have still not seen the first 2% pullback in the S&P 500 since the rally kicked off last October. This is long enough to rank the current streak in the top 25 all-time.
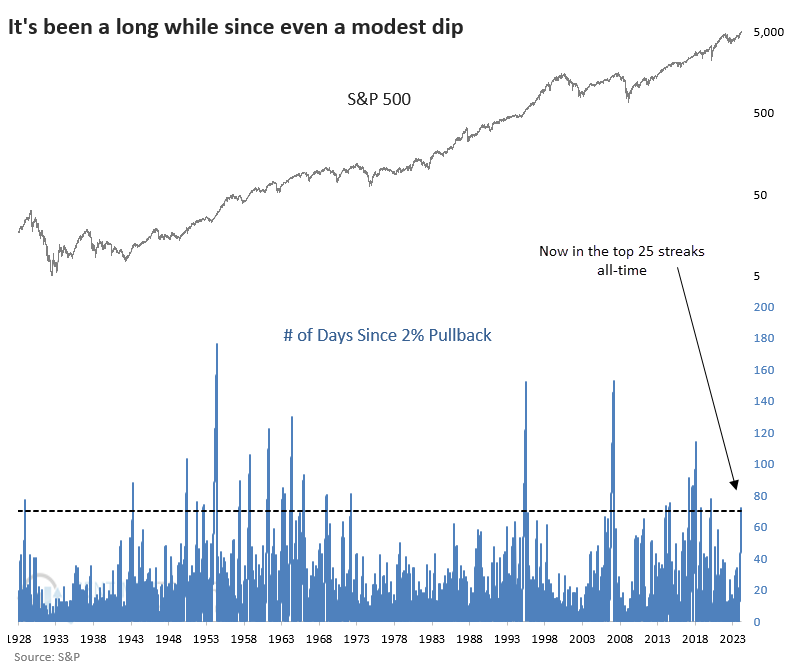
Not only has this streak been among the longest the S&P 500 has enjoyed since 1928, but it ranks among the very best in magnitude as well. With a 22% rally during the streak, only two other time periods beat it.
Granted, there isn't much we can glean from a sample size of three, but the few times the S&P enjoyed such a run, its risk outweighed its reward each time over the next two months.
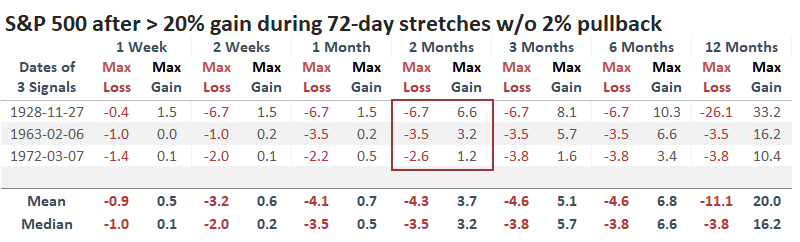
If we broaden the sample by looking at the most significant rallies during 72-day streaks without a 2% pullback, the implication of short-term weakness continues. Up to two months later, the S&P still showed a negative mean return. The best part for the bulls is that those short-term pullbacks served as setups for resuming long-term upward momentum.
Investors are moving more into equities versus money markets
Dean noted that investors transitioned away from the safety of money market funds in favor of equity funds. Similar shifts in investor's risk tolerance tended to foreshadow a bullish outcome for the S&P 500.
When capital flows into money market funds relative to equity funds, investors are risk averse. Conversely, a shift into equity funds at the expense of money market assets signifies a more optimistic outlook from investors.
With the most recent update from the ICI, the equity-to-money market ratio deviation from its 4-month average increased to the highest level since December 2020, triggering a buy signal for a model that measures a shift from below 0.95 to above 1.05.
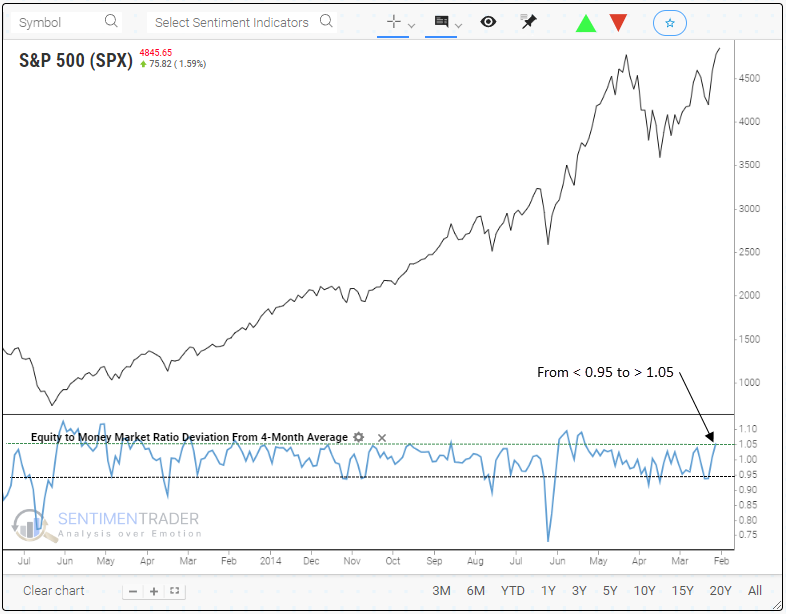
Shifts in the equity-to-money market ratio deviation from its 4-month average, like now, tended to occur after corrections and bear markets. In most cases, the Federal Reserve was lowering interest rates, resulting in a less enticing cash option, which is not the case now.
When the equity to money market ratio deviation from its 4-month moving average cycled from less than 0.95 to greater than 1.05, the S&P 500 was higher 100% of the time over the subsequent nine months.
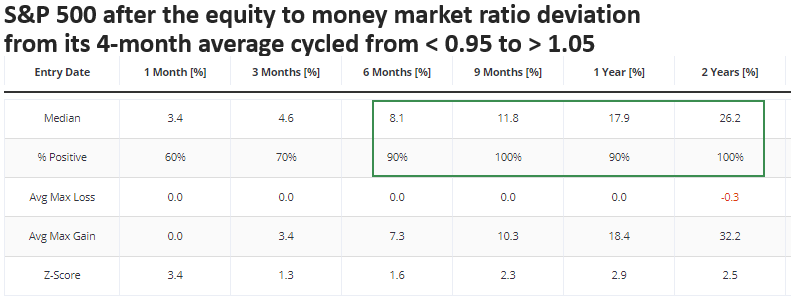
From a sector perspective, early-cycle cyclical groups tended to outperform the S&P 500 over the subsequent year.
A risk-off model adds another brick to the wall
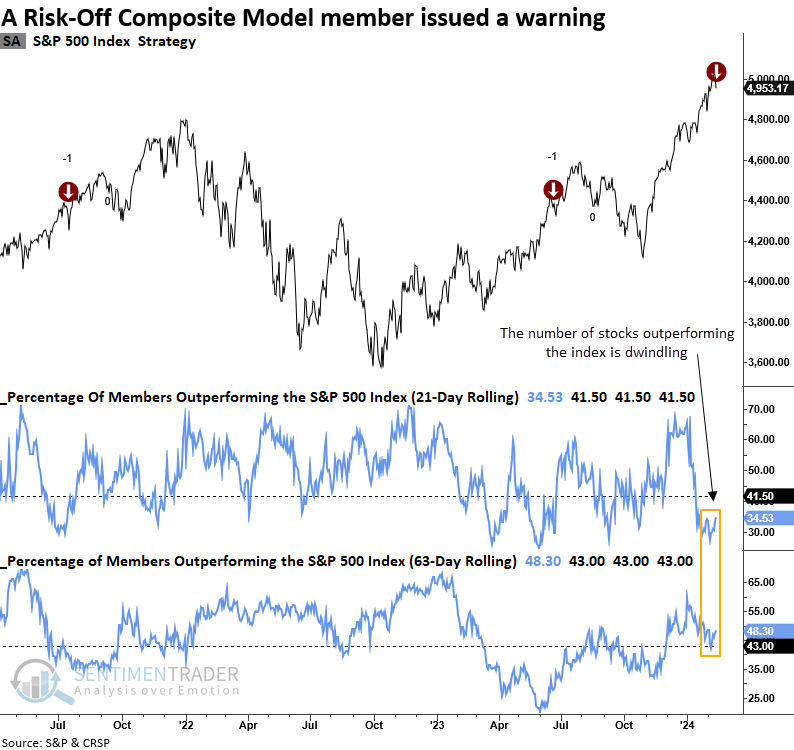
A second component in the Risk-Off Composite Model issued a warning at the close of trading on Tuesday. Dean noted that the model highlights diminished participation, evident in fewer stocks outperforming the S&P 500.
On Tuesday, a new signal from a voting member in the Risk-Off Composite Model issued an alert. The component uses the percentage of S&P 500 members outperforming the S&P 500 over a rolling 21 and 63-day period to identify when fewer and fewer stocks are keeping up with the index, indicating a narrowing in participation from a different perspective than traditional breadth indicators.
Like any standalone indicator, this model is not foolproof, as demonstrated by the two prior alerts that preemptively issued warnings well in advance of corrections.
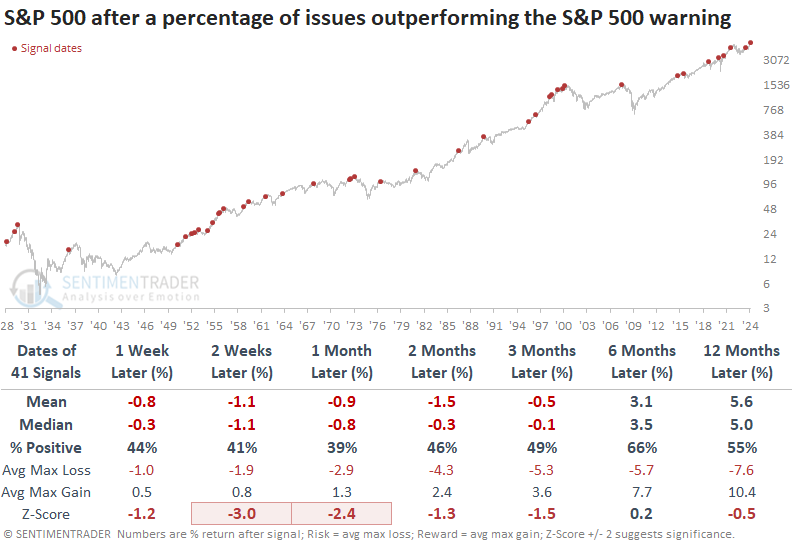
A decline in the number of stocks outperforming the index tends to result in a pessimistic outlook for the S&P 500 over the ensuing three months. In each time frame within that period, the median maximum loss exceeded the maximum gain.
With the new component alert, the Risk-Off Composite Model signal count increased to 40%. If one more member issues a warning, the composite model would trigger a risk-off signal.
Small cap participation has been missing
We've looked a few times over the last couple of weeks how some oddities are building under the surface of the stock market.
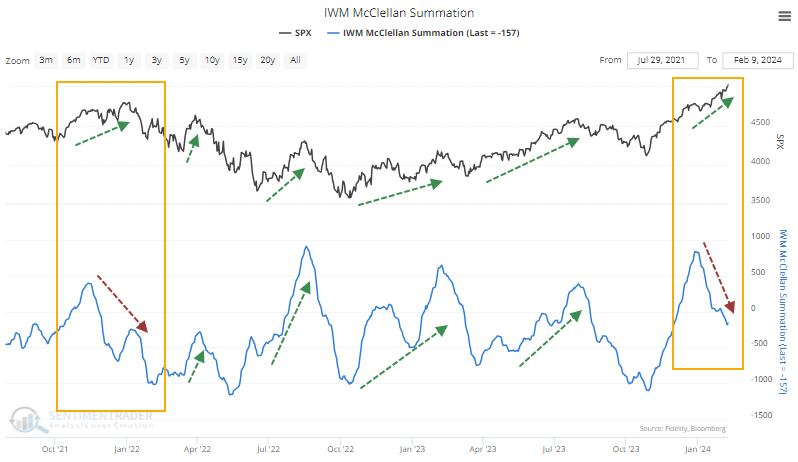
The main reason is that investors have primarily focused on the largest stocks. Many smaller caps are lagging, some badly, and underlying momentum is poor. The McClellan Summation Index for the Russell 2000 is well below zero even as the S&P 500 has driven to record highs. This is unusual - usually, small cap momentum ebbs and flows along with swings in the S&P as investors are in gear.
The table below shows every time when the S&P 500 closed at least at a multi-year high, but the Summation Index for small cap stocks was below -150, showing poor internal momentum. Overall returns in the S&P going forward weren't bad at all.
It was a worse sign for the Russell 2000. That index of small cap stocks suffered worse returns in the months ahead, with high risk relative to reward. The most recent signals have been particularly bad.
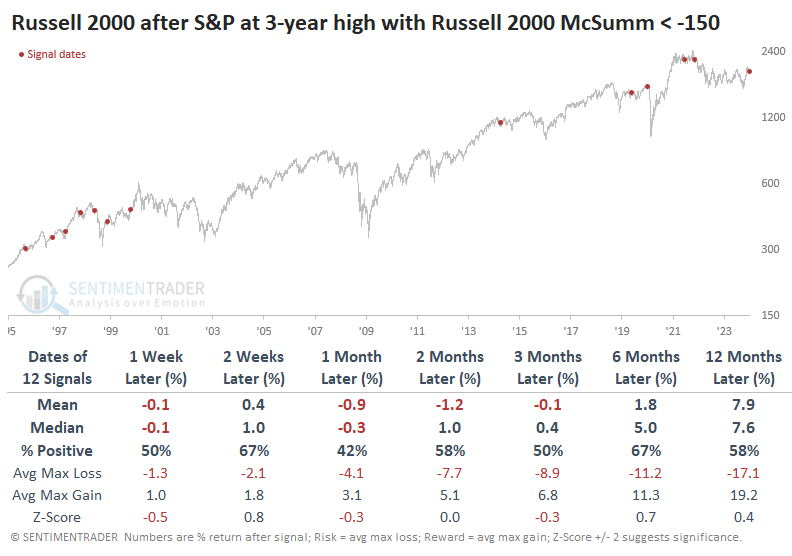
Looking at the S&P 500 to Russell 2000 ratio after these signals, the S&P tended to continue to outperform the Russell over the next two to three months, in particular. The S&P outperformed either two or three months later after all but two of the signals, and after one of those, it quickly resumed its outperformance.
While some stocks are lagging, financials and industrials are not
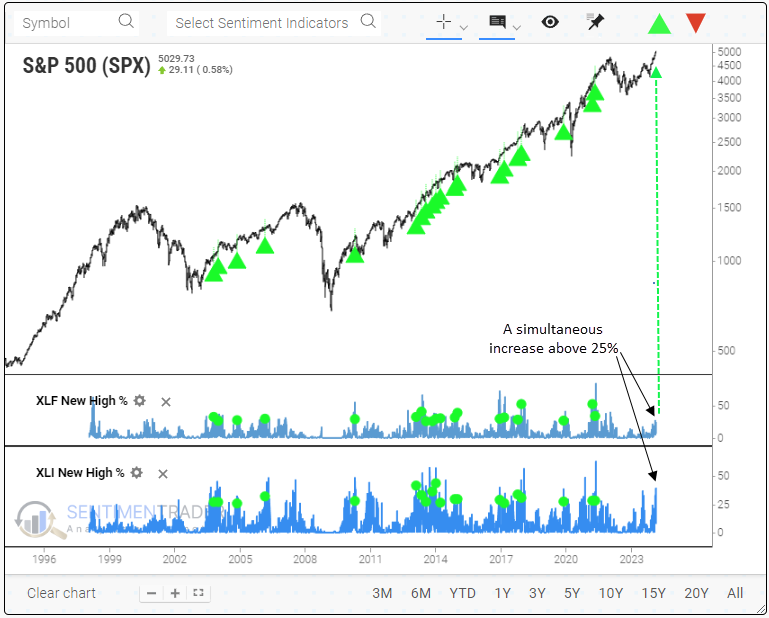
Dean noted that the percentage of annual highs for stocks in the Financial and Industrial sectors exceeded 25%. Similar expansions in new highs preceded a 97% win rate for the S&P 500 over the following year.
With the introduction of our new backtest engine, users can now assess events like this one by leveraging the multi-condition feature. In conducting this study, Dean utilized the multi-condition same bar function to uncover precedents when the percentage of annual highs exceeded 25% simultaneously for both sectors.
As the arrows on this chart depict, an expansion in annual highs for Financial and Industrial sector stocks, like now, typically aligns with broad market uptrends.
When both Financial and Industrial sector stocks recorded annual highs surpassing 25% concurrently, the world's most benchmarked index displayed exceptional returns, win rates, and z-scores. A year later, the S&P 500 was higher in all but one case.
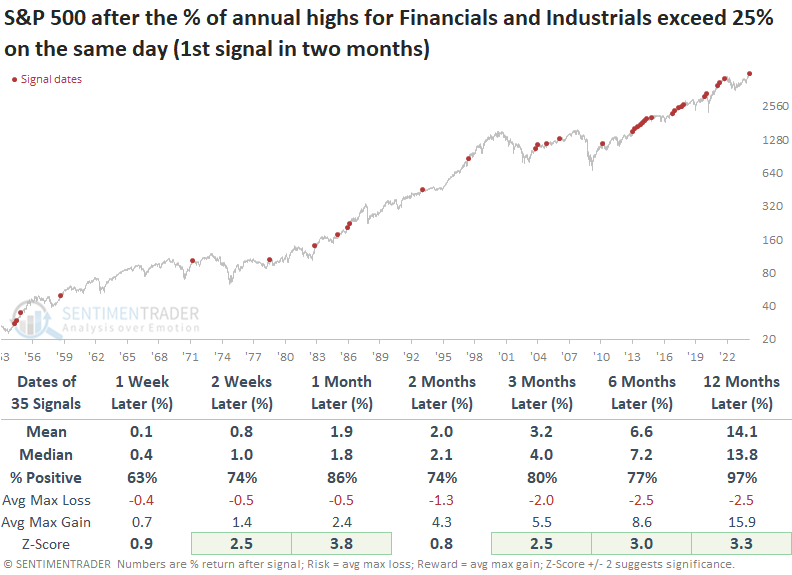
Over the following year, Financials underperformed the S&P 500 while Industrials almost kept pace with the large-cap index. The frequency of signals since 2009 might be a factor in the relative underperformance for both sectors, given that it has been a bull market driven by growth stocks.
A significant number of S&P 1500 sub-industry groups within the Industrial and Financial sectors closed at an annual high on Thursday, confirming the breakout in individual stocks.
Putting a collar on NVDA
A collar is an options position that allows an investor the opportunity to hedge an existing stock position. Jay showed that a collar involves selling a call option and using the proceeds to pay for all or part of buying a protective put position.
Using options, we will use Nvidia as our underlying stock to highlight the collar position. As such, the example trades detailed below are not meant as recommendations (although they do serve the purpose of hedging).
NVDA is scheduled to announce earnings on February 21st. While the announcement is expected to be well received, the reality is that few things can cause a massive and immediate downdraft in a high-flying stock than a disappointing earnings announcement. So, for our example, we will assume that:
- An investor owns 500 shares of NVDA (presumably with a nice open profit)
- They are concerned about the potential for earnings to knock the stock down
- They want to hedge against this possibility
The classic approach to a collar is to sell an out-of-the-money call option for every 100 shares held long and buy an equal number of put options. Since earnings come out on February 21, we will use options expiring on 2024-02-23 for this example. With NVDA shares trading at $731.56 a share, we will do the following:
- Hold 500 shares of NVDA trading at $731.56
- Sell 5 Feb 23, 2024 830 strike price calls @ $15.60 (Delta of 24)
- Buy 5 Feb 23, 2024 730 strike price puts @ $42.50 (Delta of 46)
The particulars for this position appear below (all screenshots below are courtesy of Optionsanalysis.com).
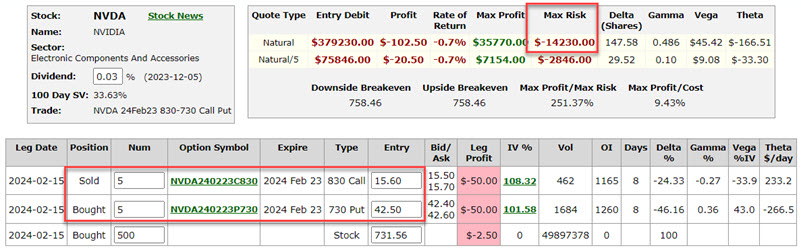
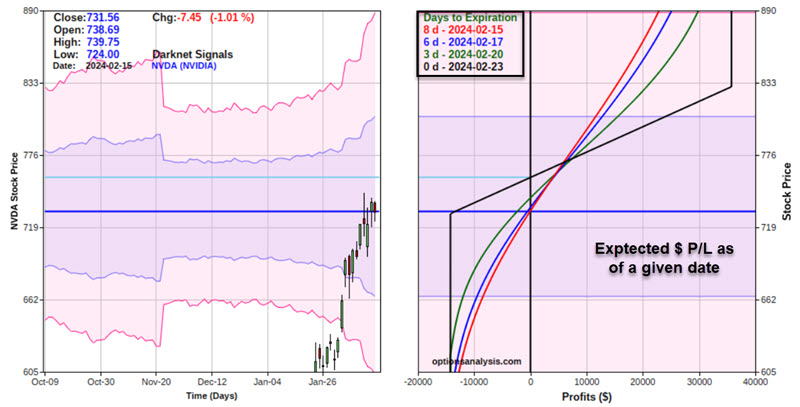
A few things to note:
- The current value of the 500-share stock position is $365,780
- Because the puts cost more than the calls, we must pay out $13,450 (42.50 - 15.60 x 500) to enter the collar
- Because we are selling 5 calls, our maximum profit potential during the life of the collar is $36,335 (if NVDA trades above the call strike price of $830)
- If NVDA does trade above the call strike price, the trader must be prepared to either buy back the call options or have their stock shares be called away
The good news is that if NVDA does sell off, the maximum loss we can experience during the life of the collar is -$13,666 if the shares drop below the put strike price of $730 a share
The cons to this position are that the trader must pay out money to enter the collar and that the stock could be called away if the stock rises above the call strike price and the trader does not buy back the call options. The pro to this position is the limited downside risk should a worst-case scenario unfold.
Jay offered another way to trade this using a strategy called an open collar.
When not to own bank stocks according to the calendar
Jay noted that investors in bank stocks who panicked a year ago and heeded pundits' warnings have gotten left behind. However, bank stocks have tended to show weakness in the months ahead.
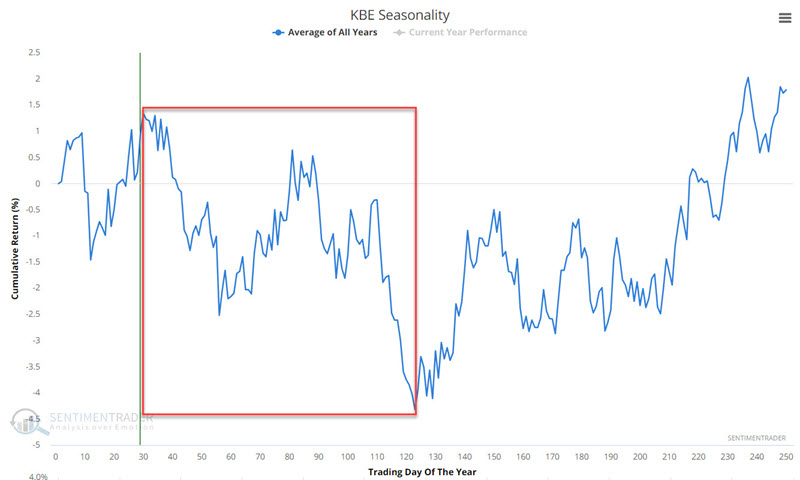
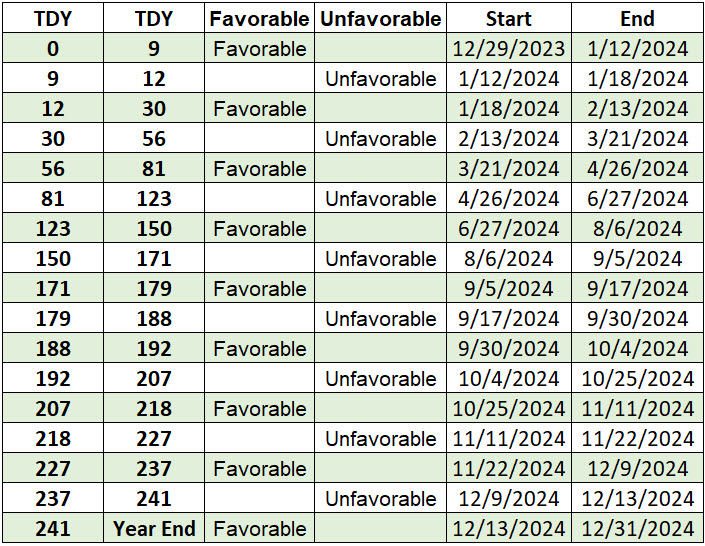
The chart below displays the annual seasonal trend for ticker KBE. Note the tendency for weakness from Trading Day of Year #30 through TDY #123. For 2024, this period extends from the close on 2024-02-13 through the close on 2024-6-27.
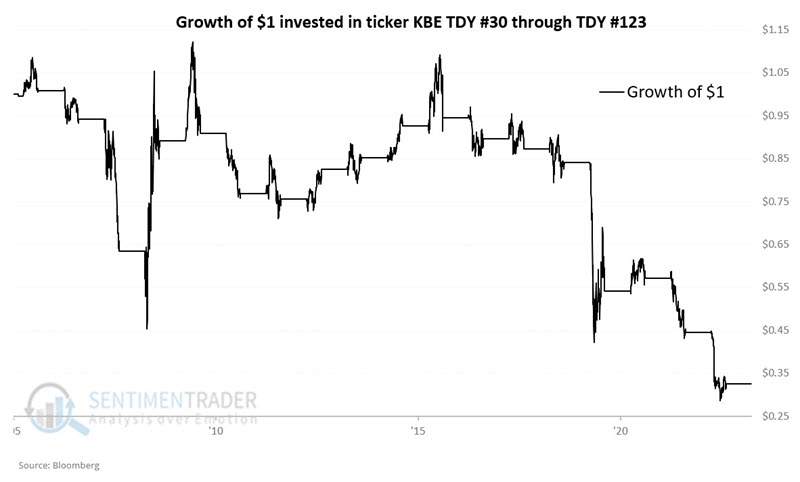
The chart below displays the growth of $1 invested in KBE from TDY#30 through TDY #123 since KBE started trading in 2005.
Jay further divided the typical calendar year in banking stocks to fine-tune the best times to hold (or not). He added that KBE's annual seasonal trend reveals many twists and turns and while while the annual trend is not a roadmap, it can offer significant clues.
The table below breaks down the various periods regarding Trading Day of the Year (TDY #). It also includes turning point dates for 2024.
The first test assumes that one is invested in ticker KBE each year only during the periods marked "Favorable." The chart below displays the hypothetical growth of $1 invested in KBE only during the favorable periods since KBE started trading in 2005.
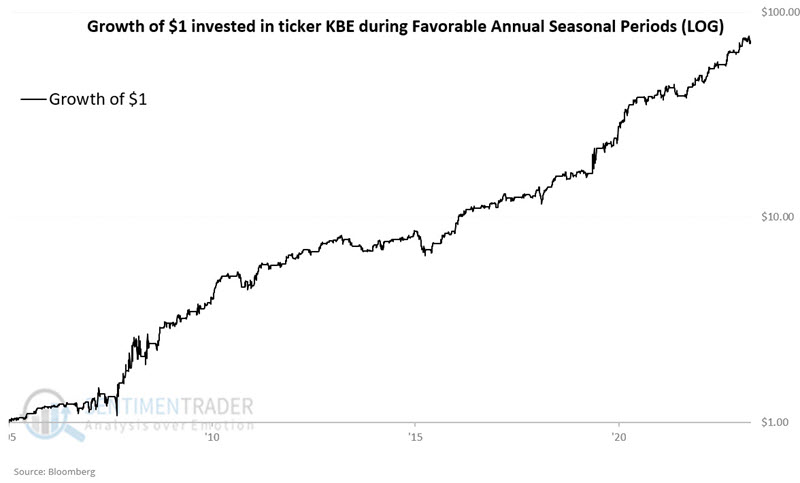
The results are compelling. However, KBE is NOT recommended to be traded systematically based solely on the seasonal calendar.
Our next test assumes that one is invested in ticker KBE each year only during the periods marked "Unfavorable." The chart below displays the growth of $1 invested in KBE each year only during these periods.
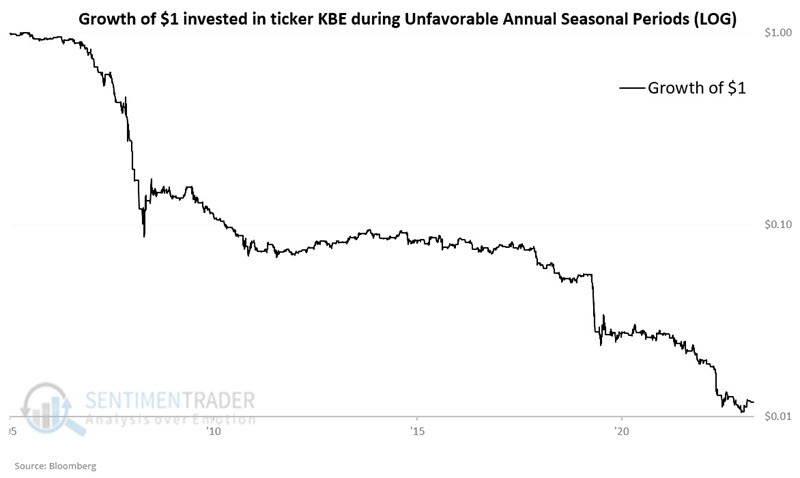
During any given unfavorable period, anything can happen. Likewise, past performance never guarantees future results. That said, you can see in the chart above why investors might think twice about investing in bank stocks during unfavorable periods.
Chinese stocks just set an inglorious record
Yet again, it has been a kind of torture for investors in Chinese stocks.
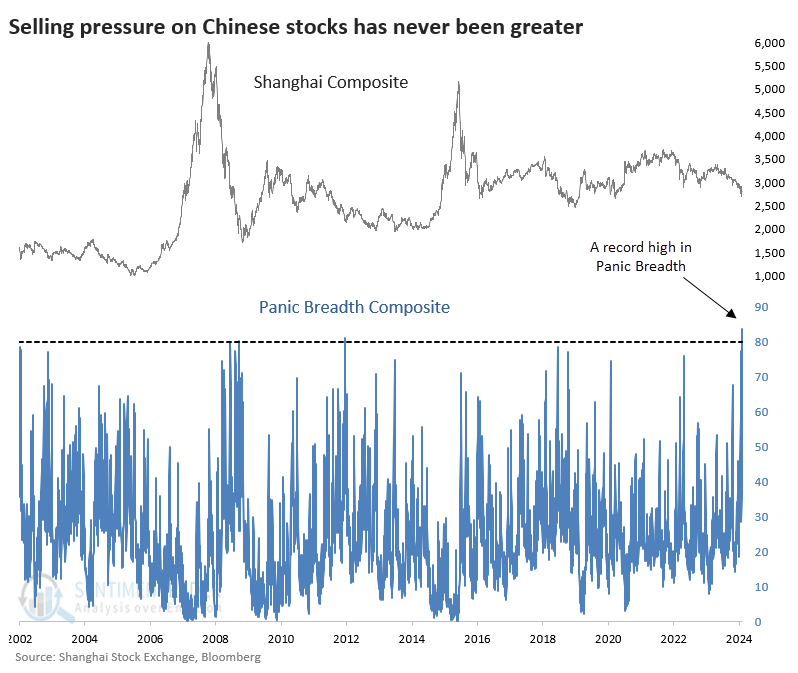
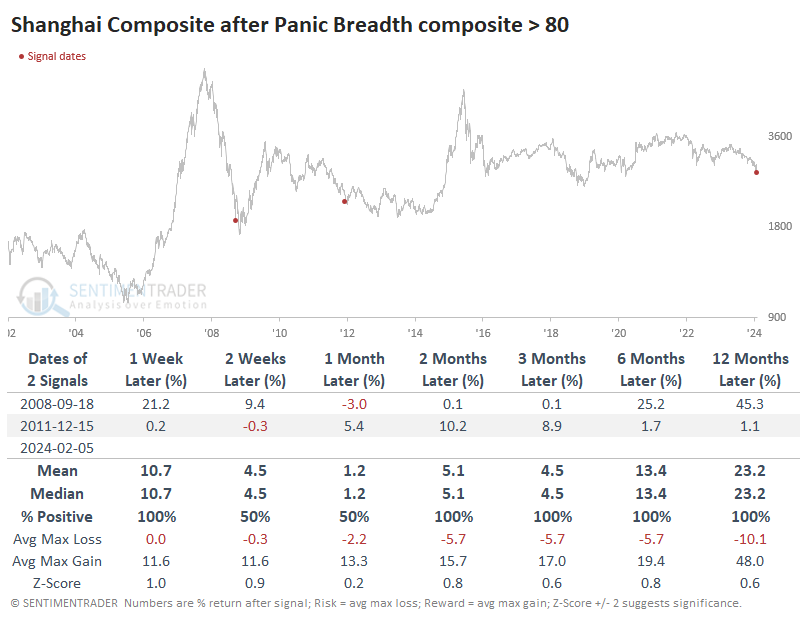
Last week, three out of every four stocks in the Shanghai Composite index fell to at least a 52-week low. That's an insanely large number that has been matched only twice, both during the financial crisis meltdown.
The number of stocks falling to 52-week lows is a good but incomplete picture of the selling pressure underlying an exchange or index. Let's revisit the Panic Breadth Composite we've discussed many times over the year to get a more complete view. It aggregates breadth measures to determine the level of selling pressure across time frames.
For the Shanghai, this Panic Breadth Composite just hit a record high.
The table below shows the only two other times it exceeded 80. Both preceded highly volatile conditions and limited risk relative to the reward of gains across most time frames.
We still don't see many precedents if we relax the parameters to get a larger sample size. There were seven times when Panic Breadth exceeded 75, and returns following those were unimpressive, primarily thanks to a couple of them triggering about halfway through major declines.
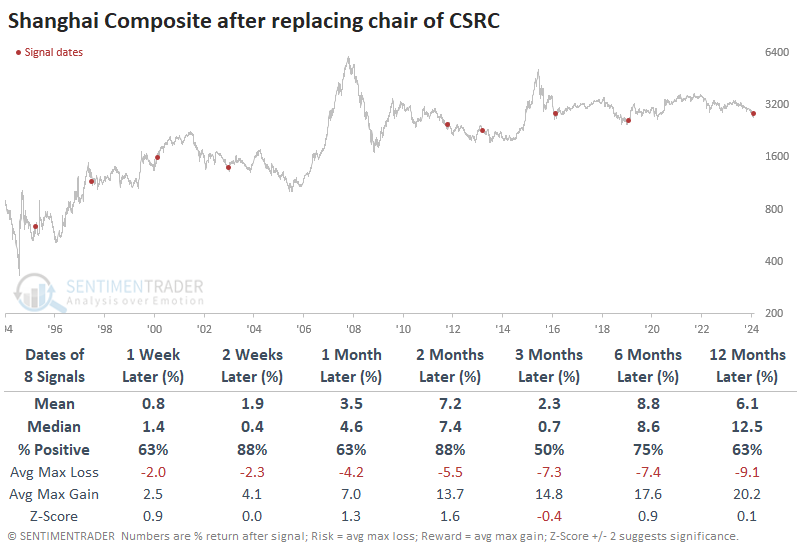
Another wrinkle is that the China Securities Regulatory Commission chairman was replaced just before the Lunar New Year holiday. While changes in the heads of regulatory commissions rarely get much broad-market attention in other markets, in China, they have tended to occur after major declines and before rallies.
To top off the worries, MSCI is removing many Chinese stocks from their indexes, which can potentially add even more selling pressure to Chinese shares.
The only other time there was a net deletion of stocks was in the May 2022 rebalancing. The Shanghai Composite rallied 7.4% from then to the next rebalancing. The dates following the top five net additions to MSCI indexes preceded losses four times, averaging -3.5%.
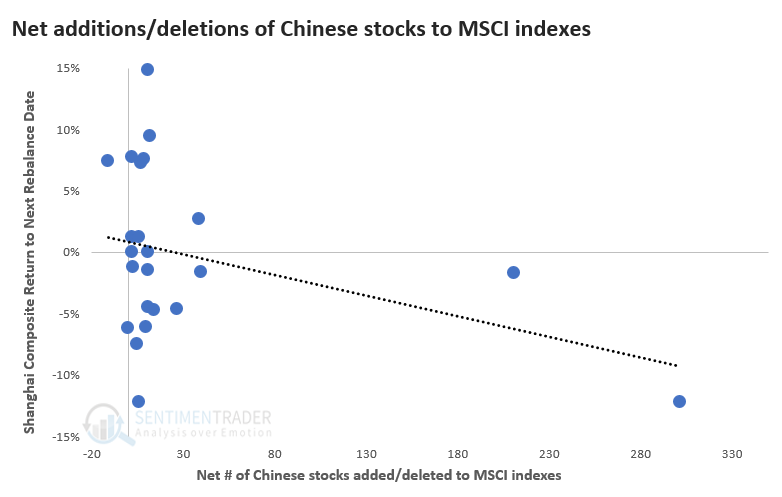
The latest announced deletion of stocks is the largest since MSCI added A shares in May 2018. There has been a modest negative correlation between how many net stocks MSCI adds/deletes from their indexes and the performance of the Shanghai Composite to the next rebalance date.
Indexers tend to be trend followers like most other investors.
A good time for gas
In early December and again in early January, Jay wrote about an unfavorable seasonal period for Natural gas, and it then plunged over -30% in just the last month. That seasonal trend is about to reverse from unfavorable to favorable.
The most important thing to remember about seasonality is that it is simply an average of what has happened in the past - it is NOT a roadmap for what will happen this year.
The chart below displays the annual seasonal trend for natural gas. The green box highlights the period from Trading Day of Year (TDY) #31 through TDY #115 since 1990, when natural gas futures started trading. For 2024, this period extends from the close on 2024-02-13 through the close on 2024-06-10.
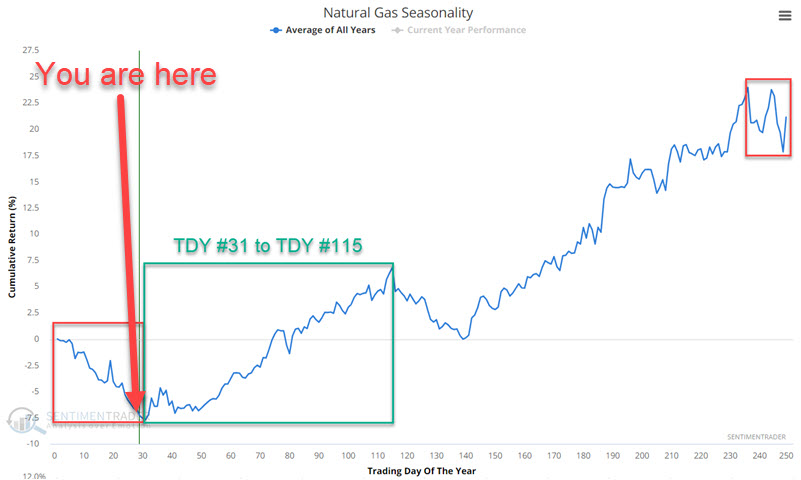
The chart below shows the hypothetical cumulative gain from holding a long position in natural gas futures during this period each year since 1990.
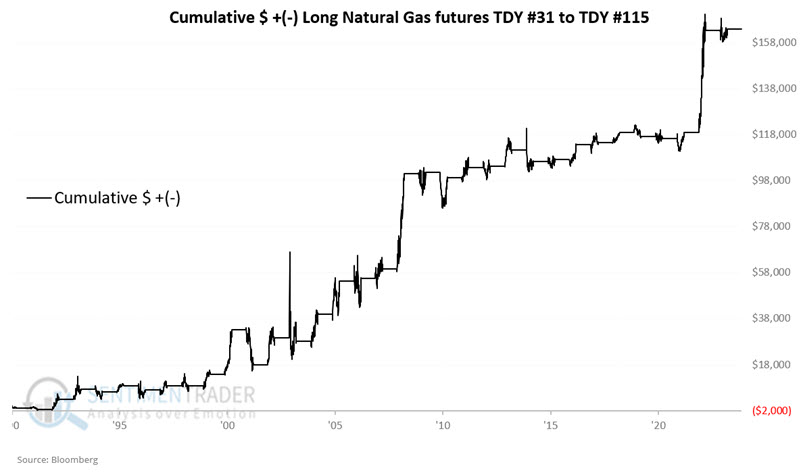
The good news is that historical results skew heavily to the favorable side (71% Win Rate, a median gain of +$4,315 versus a median loss of -$1,535, and $5K returns skew 9 to 1 to the upside). The bad news is losses of -$15,390 in 200, and -$5,050 in 2014, and a 71% Win Rate implies three losing periods in any ten years.
The bottom line: Deep pockets are required to trade natural gas futures and traders are encouraged to combine seasonality with their own favorite trend or price action confirmation method rather than relying solely on seasonality.
In many cases, non-futures traders can now gain exposure to a given commodity using ETFs. And there is a heavily traded ETF that tracks natural gas futures. That ETF is the United States Natural Gas Fund LP (ticker UNG). Unfortunately, in this case, trading UNG may not be helpful. This is due to a situation known as "contango," which acts as a major headwind for investors in the fund.
About TradingEdge Weekly...
The goal of TradingEdge Weekly is to summarize some of the research published to SentimenTrader over the past week. Sometimes there is a lot to digest, and this summary highlights the highest conviction or most compelling ideas we discussed. This is NOT the published research; rather, it pulls out some of the most relevant parts. It includes links to the published research for convenience, and if you don't subscribe to those products, it will present the options for access.