
TradingEdge Weekly for Feb 14 - Consolidating near highs, unemployment trends, commodity and China breakouts

Key points:
- The S&P 500 has been consolidating near record highs
- Stocks have been modestly volatile after President Trump's inauguration, an inauspicious sign
- Using trends in unemployment and stocks to gauge risk
- Homebuilding stocks are crumbling
- A way to use options to bet on homebuilders' trends to continue
- Stocks in Hong Kong have enjoyed broad participation during the latest rally
- Commodities are breaking out
- A way to use options to trade an energy rally
- Unleaded gas is heading into a good seasonal period
Consolidating near a high
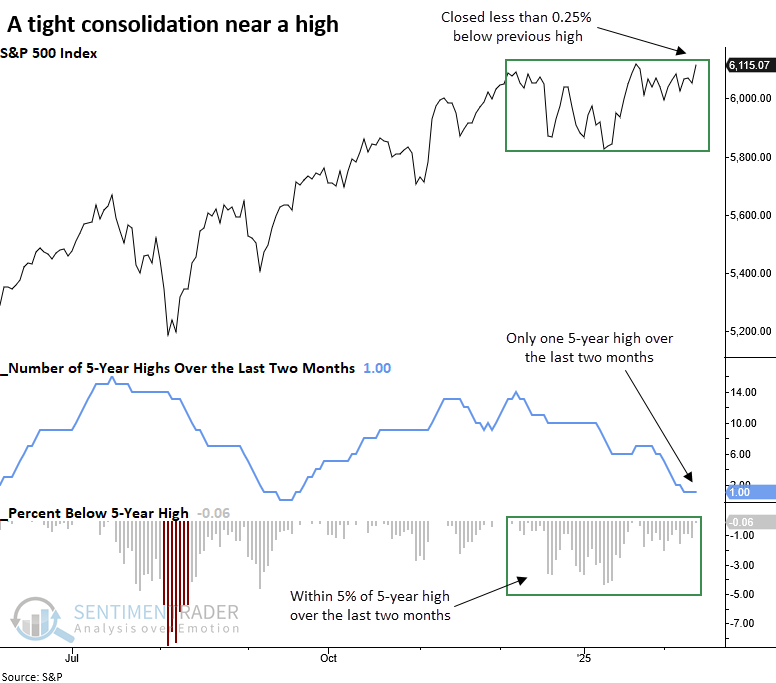
Over the last two months, the S&P 500 has consolidated in a tight range, recording only one high. Dean showed that similar consolidations saw the large-cap index rally 77% of the time over the subsequent two weeks.
Over the past two months, the S&P 500 has remained within 5% of its record high, recording just one new high despite unsettling headlines about tariffs and the DeepSeek announcement, which briefly rattled stocks. On Thursday, it closed 0.06% below its high. The previous multi-month consolidation with similar characteristics occurred in October 2019, leading to a 7.7% gain in the S&P 500 over the subsequent three months.
When the S&P 500 formed a tight consolidation pattern near a five-year high, it showed a strong tendency to rally in the near term, advancing 77% of the time over the subsequent two weeks with returns that displayed significance relative to random outcomes. The two-month outlook suggests the benchmark index could digest the near-term gains before rallying 82% of the time over the six-month horizon.
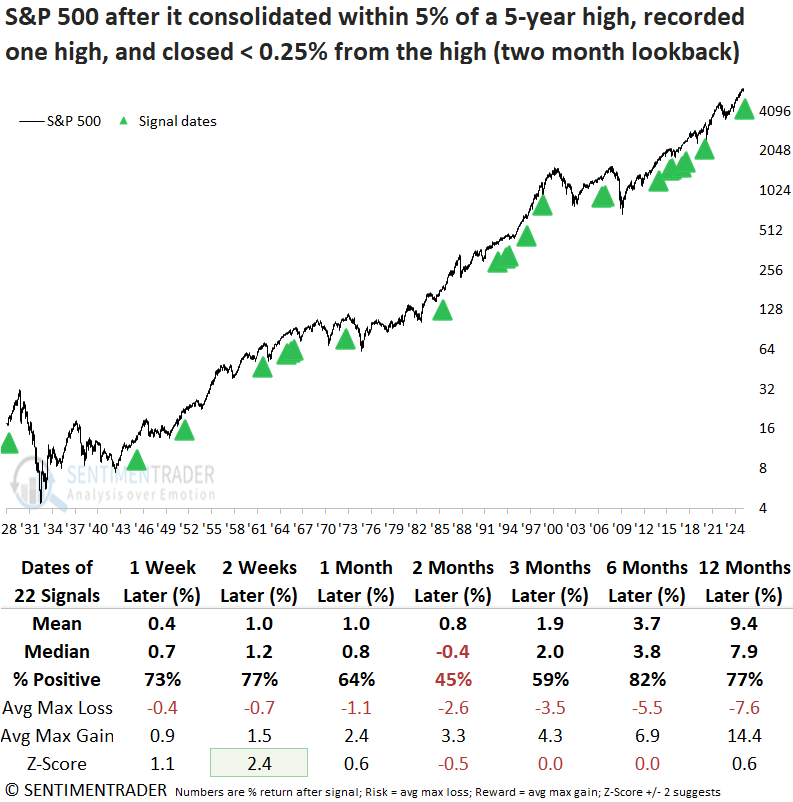
Over the next three months, the S&P 500 experienced only two maximum losses exceeding 10%, implying that a significant downturn is unlikely.
Never short a dull President
Pick a hysterical epithet and it's been used in the past few weeks to describe President Trump. It would stand to reason that stocks are being jerked around more than usual.
To gauge how volatile price action has been, we'll use the most benchmarked equity index in the world, the S&P 500, and measure its Average True Range (ATR). The 14 days since Trump's inauguration have marked the S&P 500's Average True Range at 1.14%. That's actually below the 20-year (and all-time) average of 1.3%.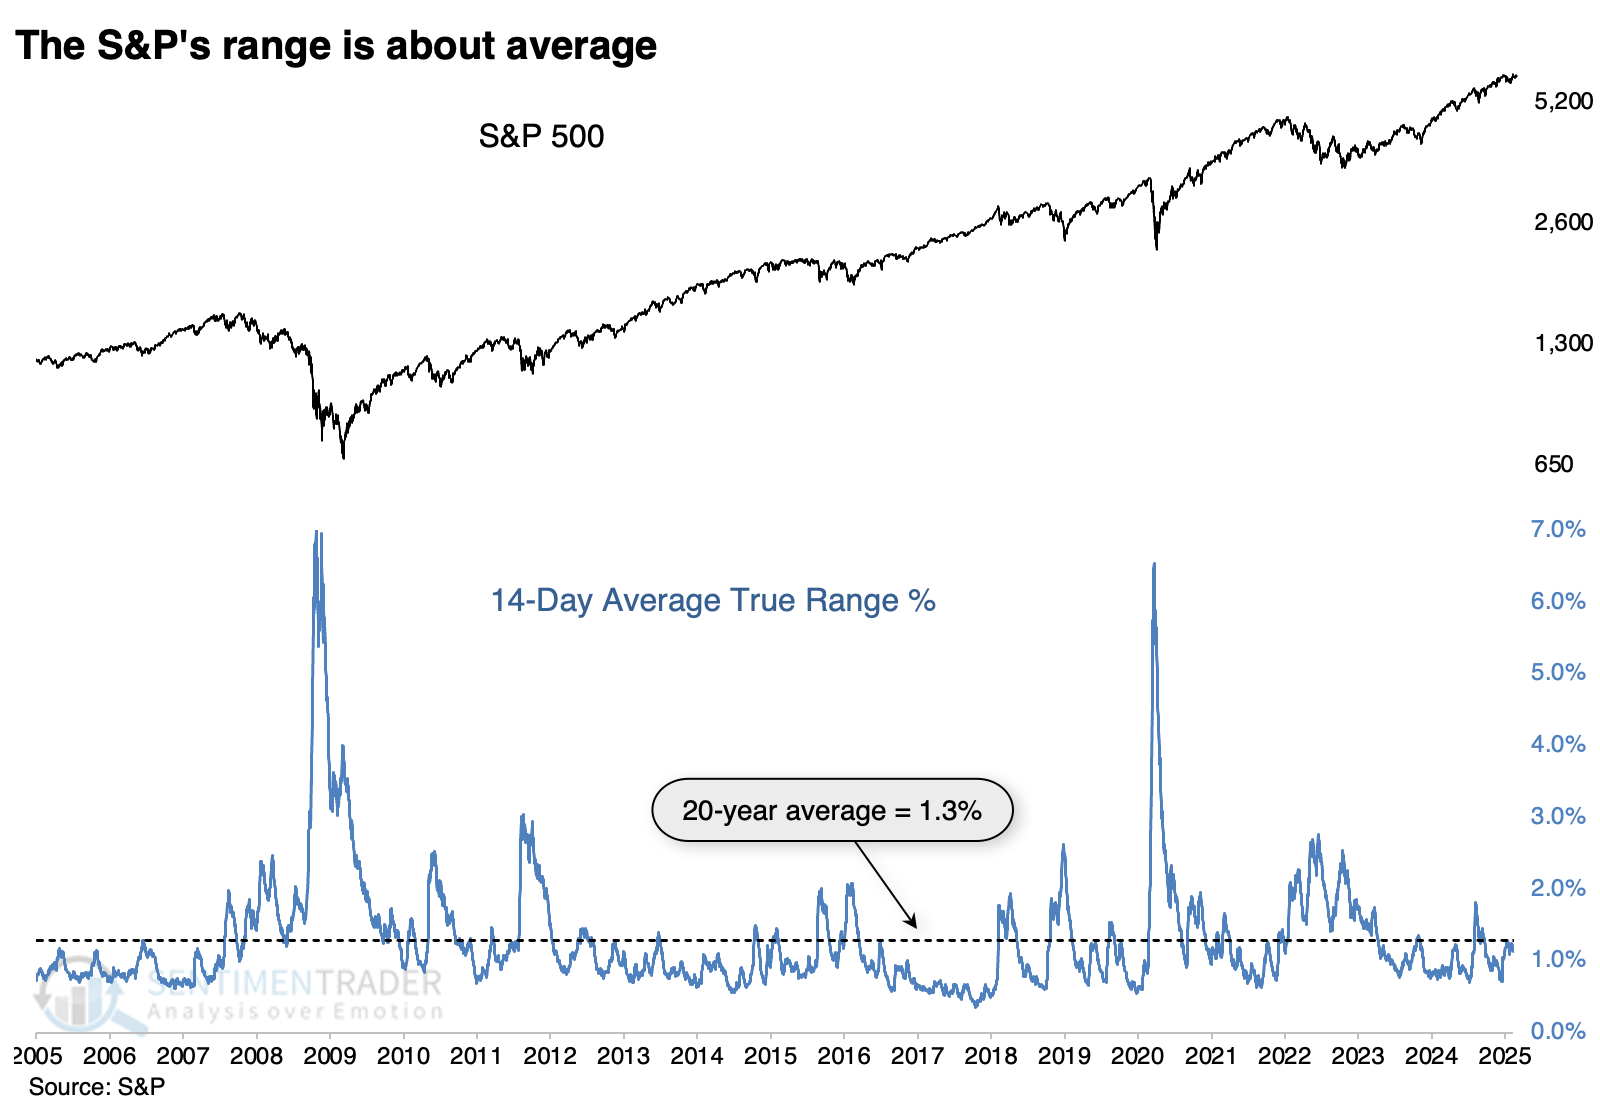
To see how this measures up to past Presidents' precedents, the table below shows when the S&P's ATR was greater than 1% in the 14 days following a U.S. Presidential inauguration. While the current instance barely qualifies, it still does, and it's not that great of a sign.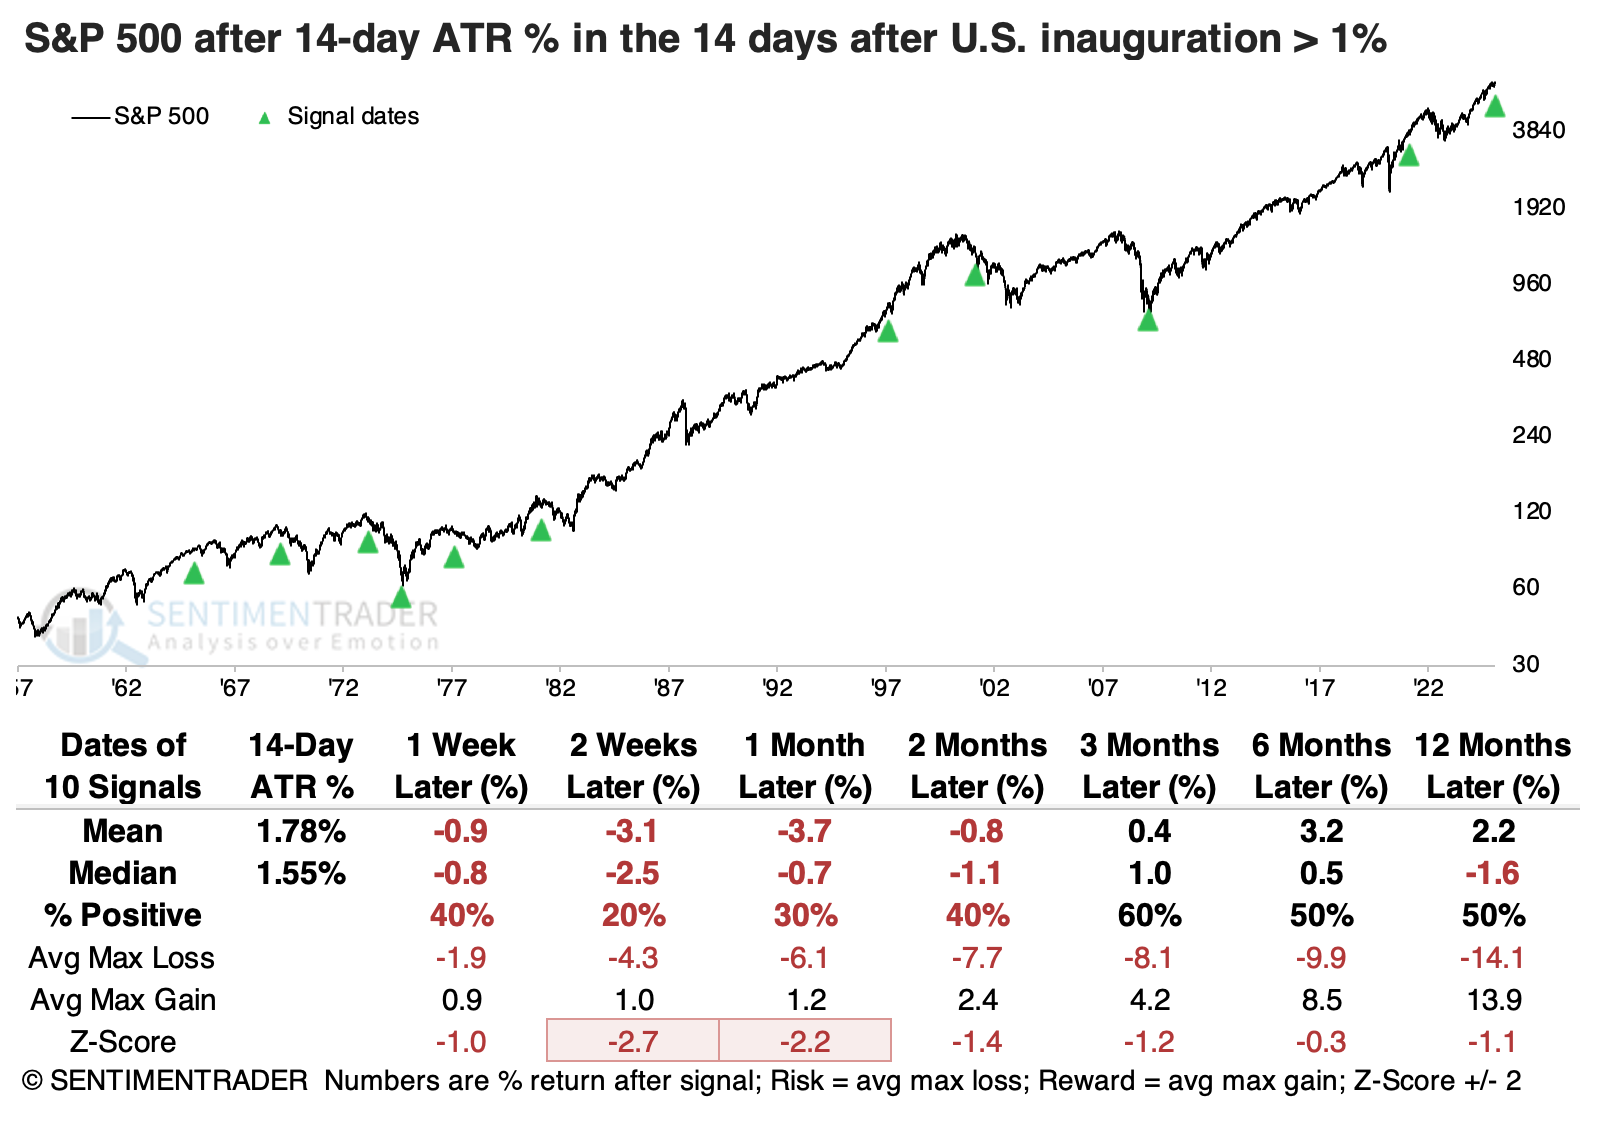
When the S&P 500 had the lowest ATR readings 14 days after inauguration, its returns, consistency, and risk/reward were remarkably better than the volatile post-inaugurations.
If the people claiming "agent of chaos" have a point, maybe it's that the ATR has jumped significantly since the election. Let's combine the two studies. The table below shows the "worst" combinations, when the S&P's ATR was higher than usual and increased between the election and inauguration.
While the S&P sported a gain four out of five times three months later, all but one of them showed a loss either six or twelve months later.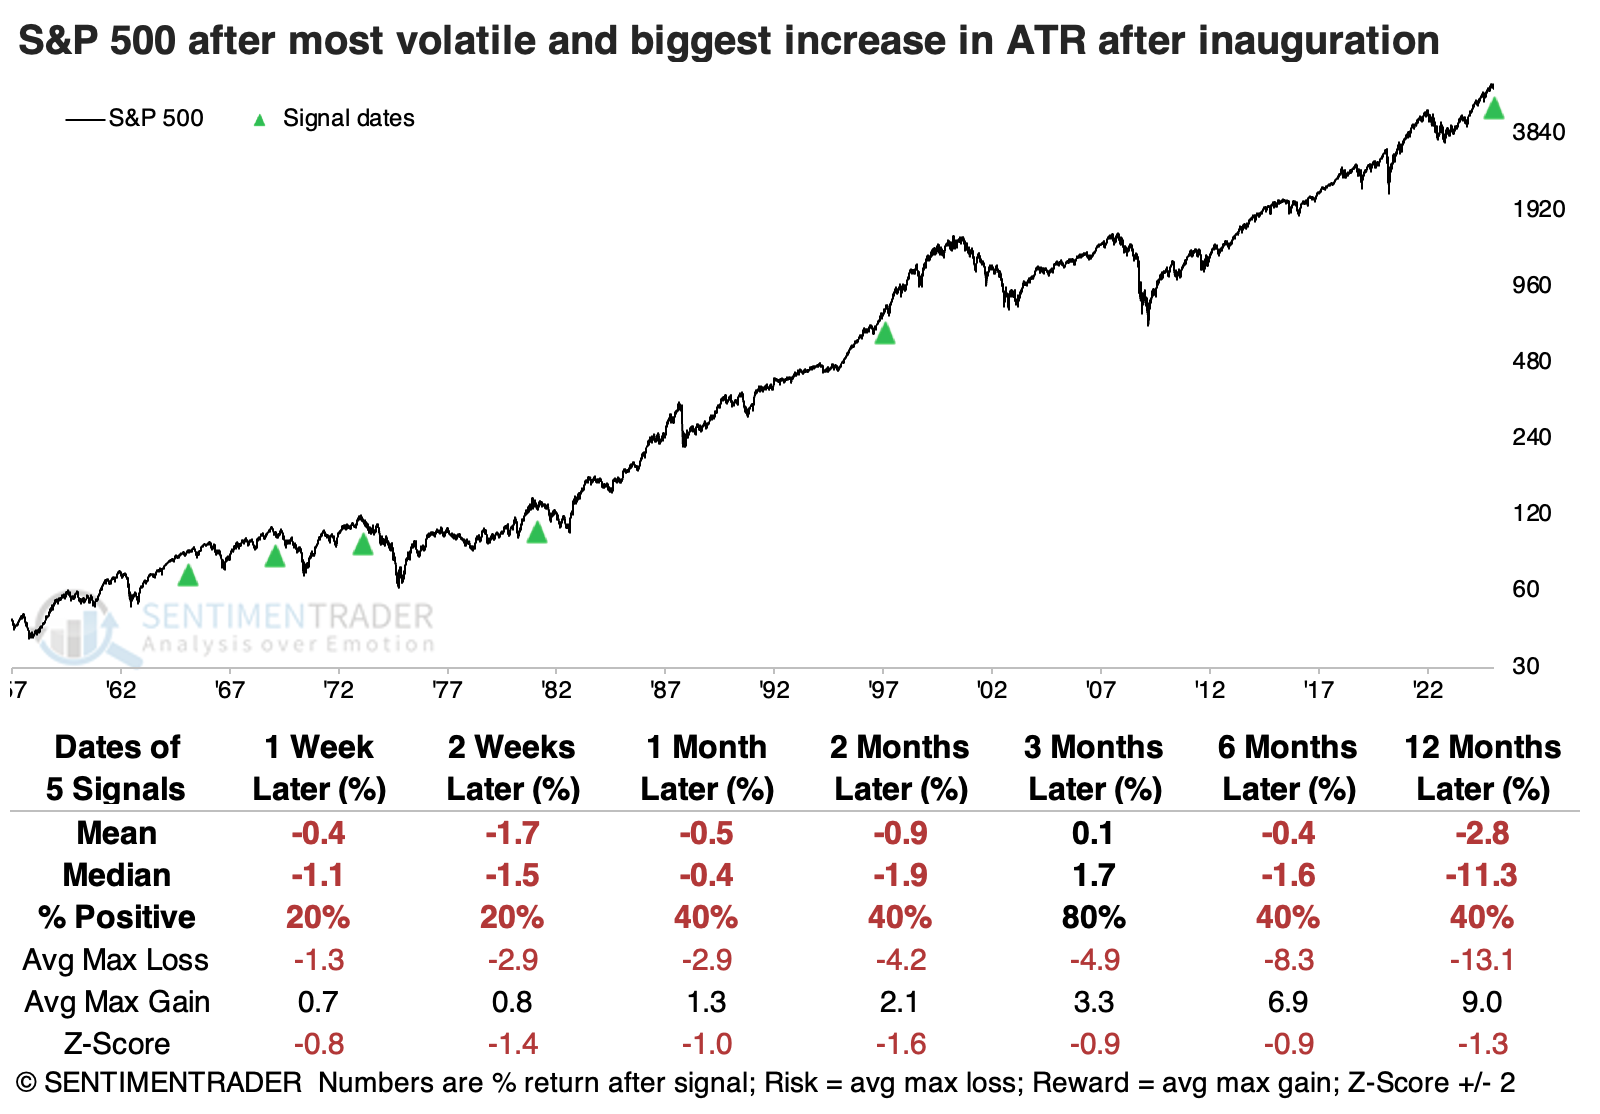
Compare those returns to the opposite scenarios, when stocks moved the least and showed the largest decrease in ATR between the election and inauguration. Only one suffered more than a -5% pullback within the following year.
Combining employment and stock trends
The economic environment is an important factor for stocks. Jay showed that continuing claims is a useful data series for objectively assessing the state of unemployment.
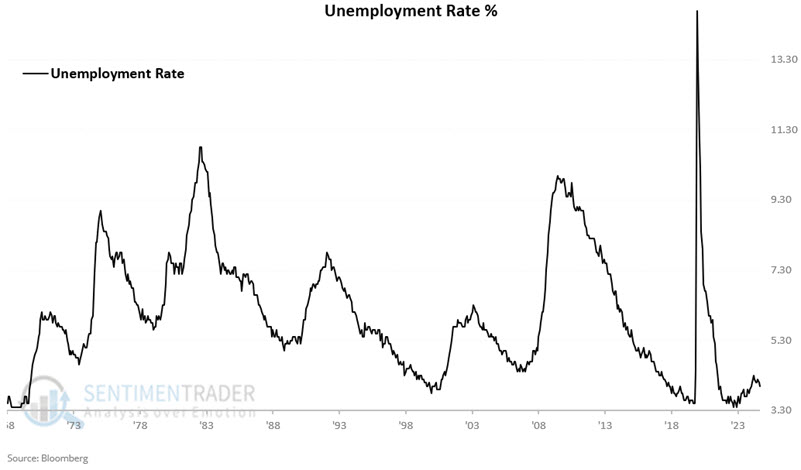
The chart below shows the official Unemployment Rate, which is 4.0%, which is relatively low on a historical basis.
To get a better sense of the deviation from trend, we'll subtract the 78-week EMA from the raw 4-week average. If the line is above 0, we can objectively designate the trend of Continued Claims as "rising," and when it is below 0, we designate it as "falling."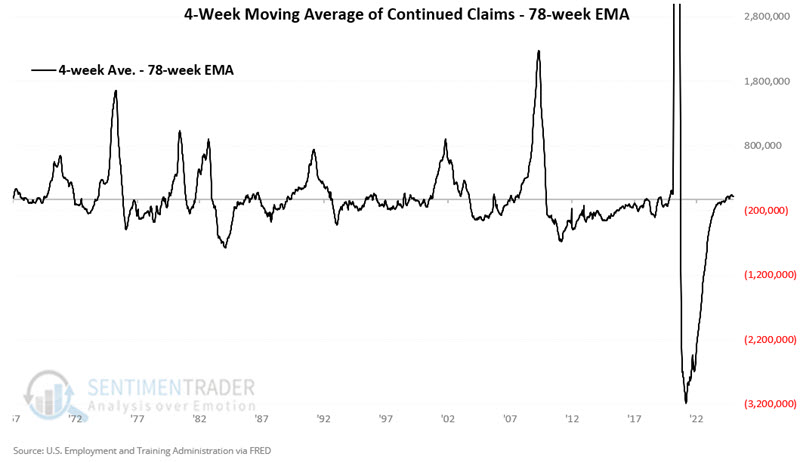
The chart below displays the hypothetical growth of $1 invested in the S&P 500 only when the 4-week average of Continued Claims is below its 78-week EMA (i.e., unemployment is deemed as "falling"). An initial $1 grew to $39.81 since February 1967.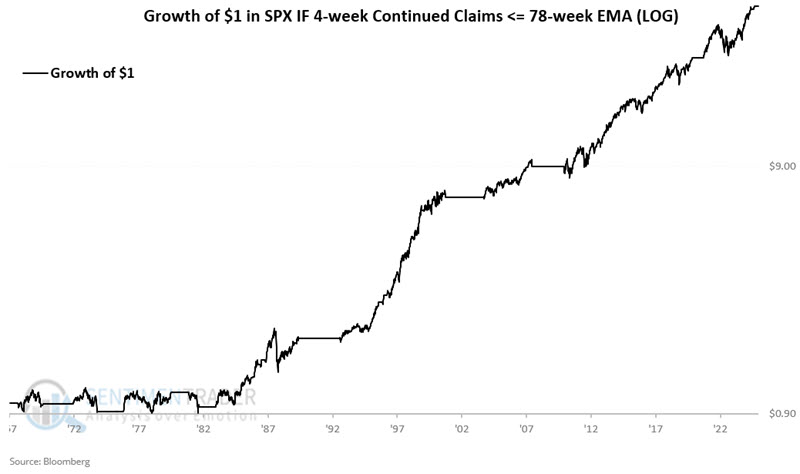
Conversely, the chart below displays the hypothetical growth of $1 invested in the S&P 500 only when the 4-week average of Continued Claims is above its 78-week EMA (i.e., unemployment is deemed as "rising"). An initial $1 grew to $1.73 since February 1967.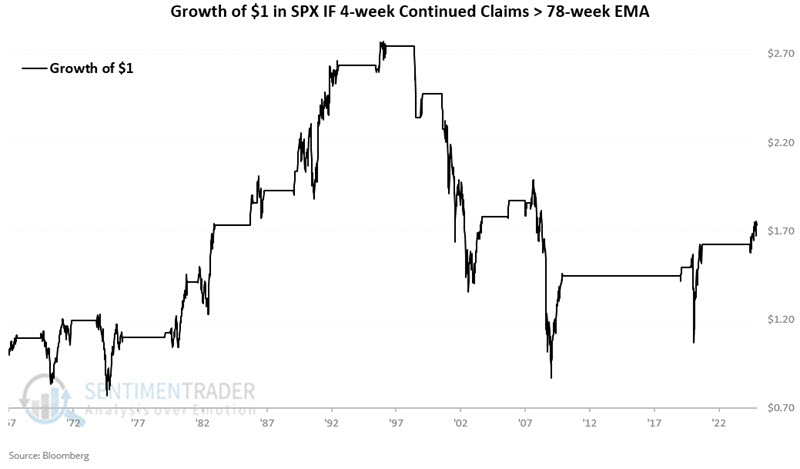
The problem with using any non-market data series to forecast stock prices is that, at times, the market will ignore it completely. So, let's create a rudimentary model.
- A = If SPX > 40-week EMA then A = 2, else 0
- B = If the 4-week average of Continued Claims is below its 78-week EMA, then B = 1, else 0
- C = A + B
So, our Continued Claims Model considers BOTH price action and indicator action. For any given week, the value can read 0 to 3. Readings of 0 are considered unfavorable for stocks (i.e., unemployment is in an objective uptrend, AND stock prices are in an objective downtrend).
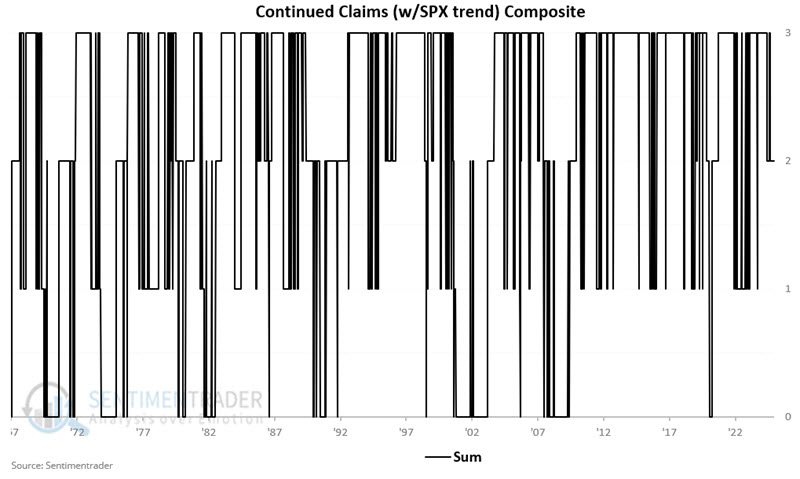
At the moment, the 4-week average of Continued Claims is above its 78-week EMA. However, the S&P 500 remains well above its 40-week average. So the model reads a favorable +2. The chart below shows the hypothetical growth of $1 in the S&P 500 only when the model = +2. A hypothetical $1 grew to $3.89.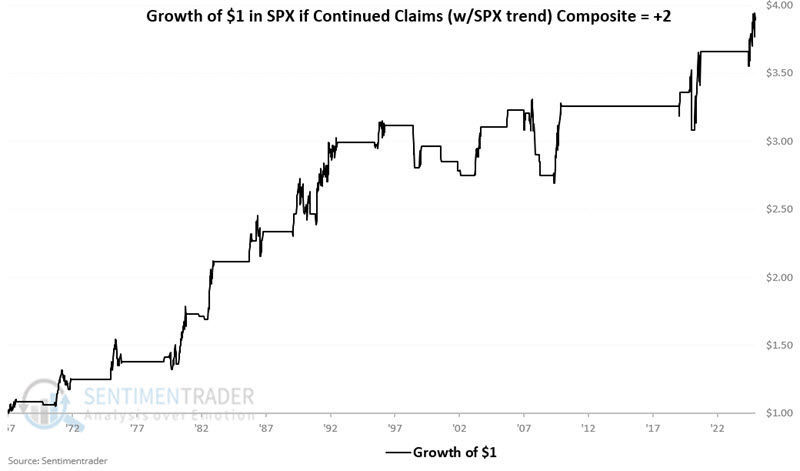
The chart below shows the hypothetical growth of $1 in the S&P 500 only when the model is greater than 0 on a logarithmic basis. A hypothetical $1 grew to $155.03.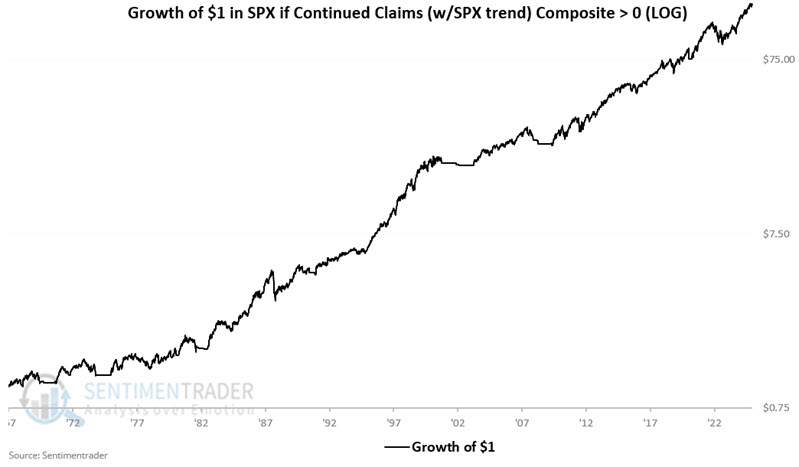
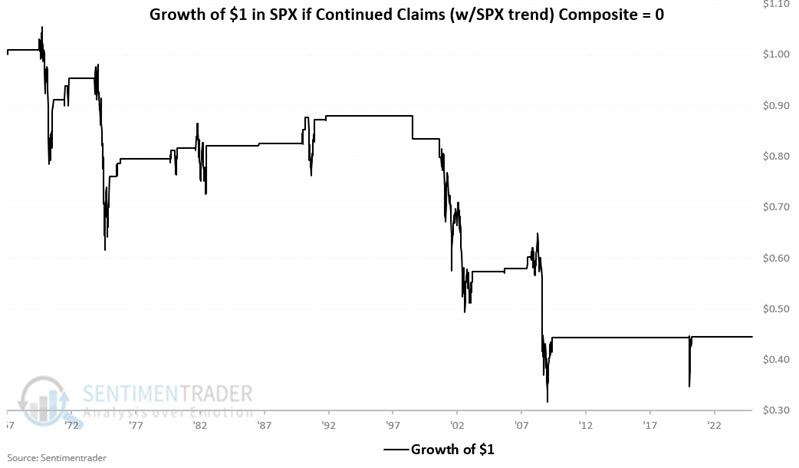
Finally, let's consider model readings of 0. Remember, this only occurs when unemployment is rising, AND stock prices are already in a downtrend. The chart below shows the hypothetical growth of $1 in the S&P 500 only when the model is = 0. A hypothetical $1 shrank to $0.44.
Homebuilders are crumbling
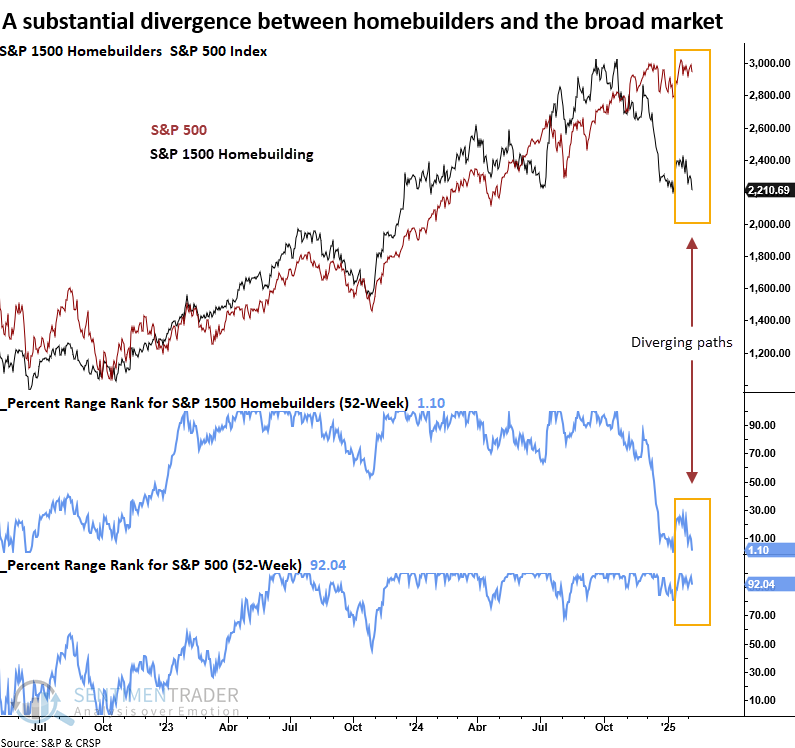
Homebuilders trade near a 52-week low, while the S&P 500 hovers around a 52-week high. Dean noted that similar divergences preceded a challenging period for homebuilding stocks over the next quarter.
Homebuilding stocks, a real-economy group susceptible to interest rate fluctuations, seem to be pricing in continued stagnation in housing as elevated home prices and borrowing costs strain affordability. The critical question remains: Could a slump drag down the broader economy, or does it result in a growth scare, similar to what we've seen with other cyclical industries?
Whenever homebuilders closed in the bottom 2% of their 52-week range while the S&P 500 remained in the 90th percentile or higher of its respective range, the S&P 1500 Homebuilders industry consistently declined, falling 100% of the time over the next two and three months.
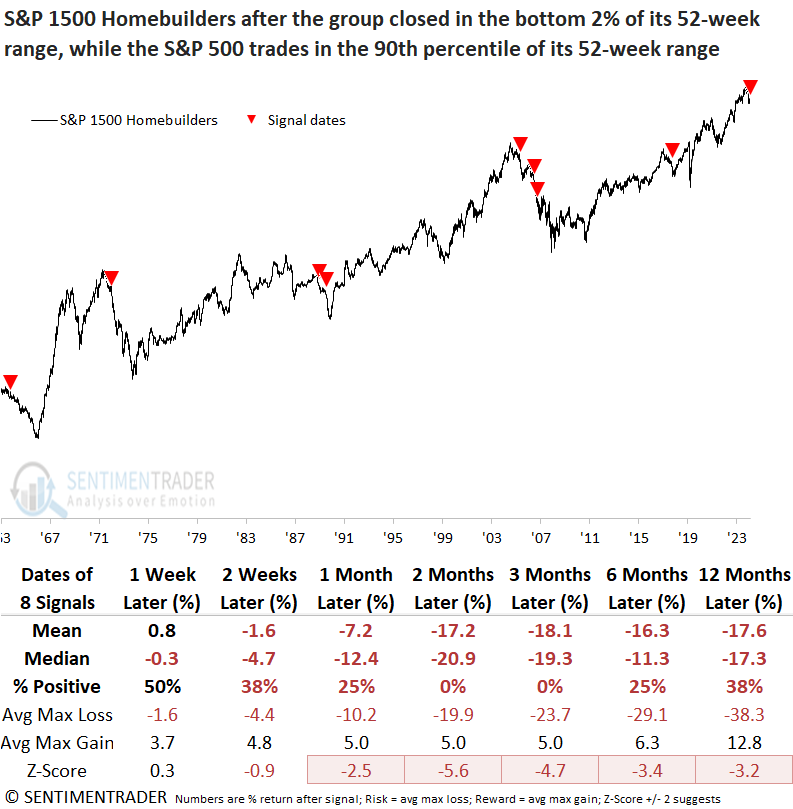
Over the subsequent two months, the S&P 500 declined in all but one instance.
Given the negative outlook for the broad market, it's not surprising to see cyclical sectors participate on the downside as defensive groups outperformed.
The housing market's primary obstacle is unaffordability, with elevated house prices and mortgage rates contributing to a stagnating market. The 30-year mortgage rate currently hovers around 7%, higher than 80% of all other readings over the last three years, a scenario that mirrors conditions seen in 2007 and 2018. However, other metrics like unemployment, residential construction job growth, housing starts, and building permits do not suggest a significant problem like 2007 is on the horizon.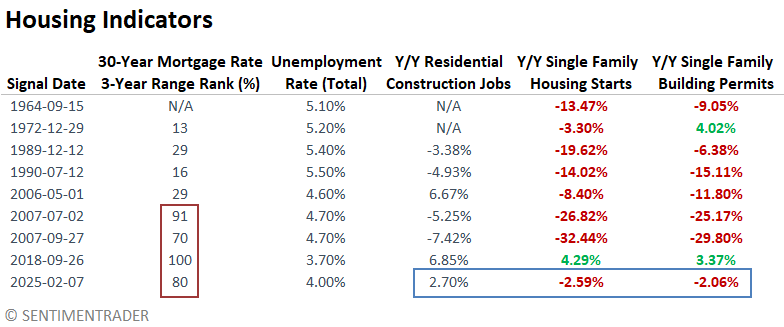
A cheap bet on a builder decline
Jay presented an example of one inexpensive way to play a potential breakdown in homebuilders.
We will use the iShares US Home Construction ETF (ticker ITB) as a proxy for the sector. As you can see from the annual seasonal chart for ticker ITB futures below, this sector does tend to show weakness during the period just ahead.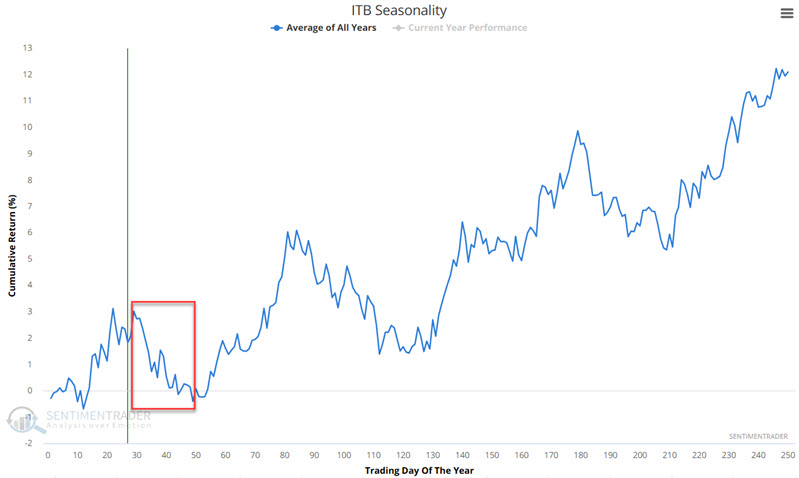
What follows is an example and not a recommendation. Consider a trader who thinks that homebuilders will continue to decline in the weeks and months directly ahead but is not willing to assume the risk of selling short shares of ITB.
A simple alternative would be to buy the ITB April 17 2025 105 strike price put option at $5.40, requiring a capital commitment of $540. The expected dollar gain or loss based on the price of ITB as of four different dates (the red line is today) leading up to options expiration (the black line) appears in the chart below.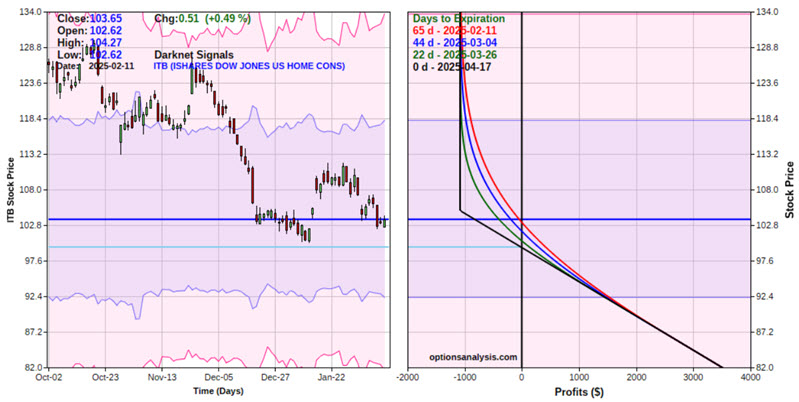
The worst-case scenario is that the position is held until expiration (April 17) and that ITB shares are trading at $105 or above, in which case the entire $540 will be lost. The breakeven for this price is $99.60 (strike price of $105 minus premium paid of $5.40).
Hong Kong stocks enjoy broader participation
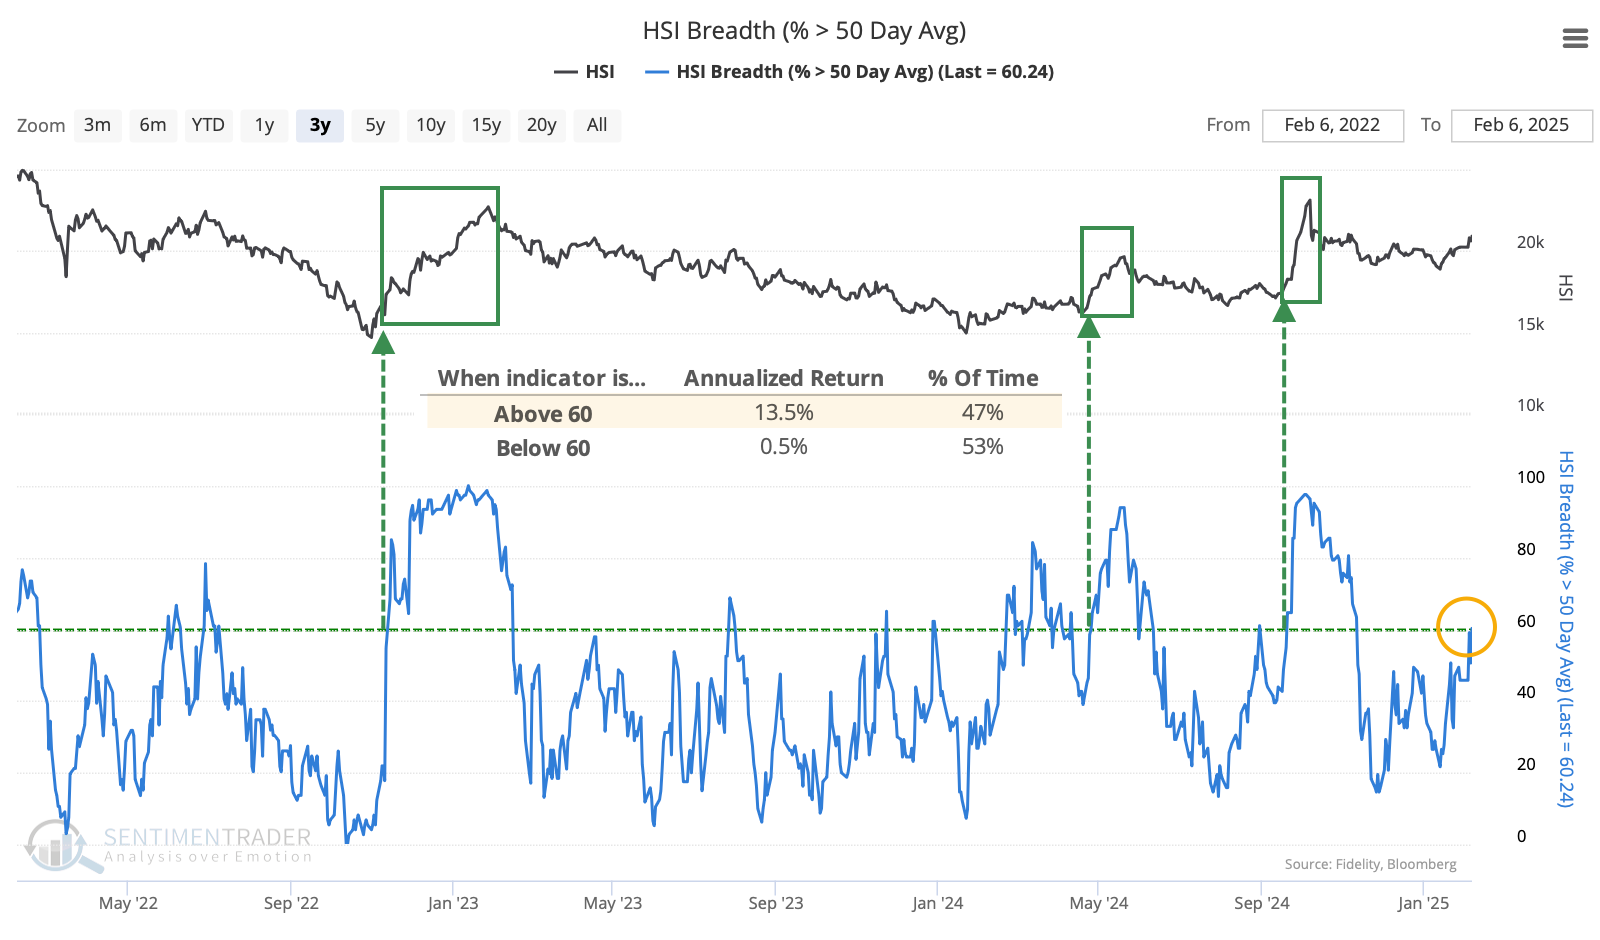
While "Chinese stocks" mean different things to different people, the Hang Seng index is one of the main gauges. And like we saw with developed European stocks recently, stocks in the Hang Seng are enjoying broad participation in the latest advance.
More than 60% of stocks in the index are trading above their 50-day moving average. When that's the case, the annualized return in the Hang Seng has been +13.5%, versus only +0.5% when the indicator is below that threshold.
According to Backtest Engine 2.0, when more than 60% of Hang Seng members trade above their 50-day average after having gone several months with fewer than that, the Hang Seng has struggled, especially over the next couple of weeks.
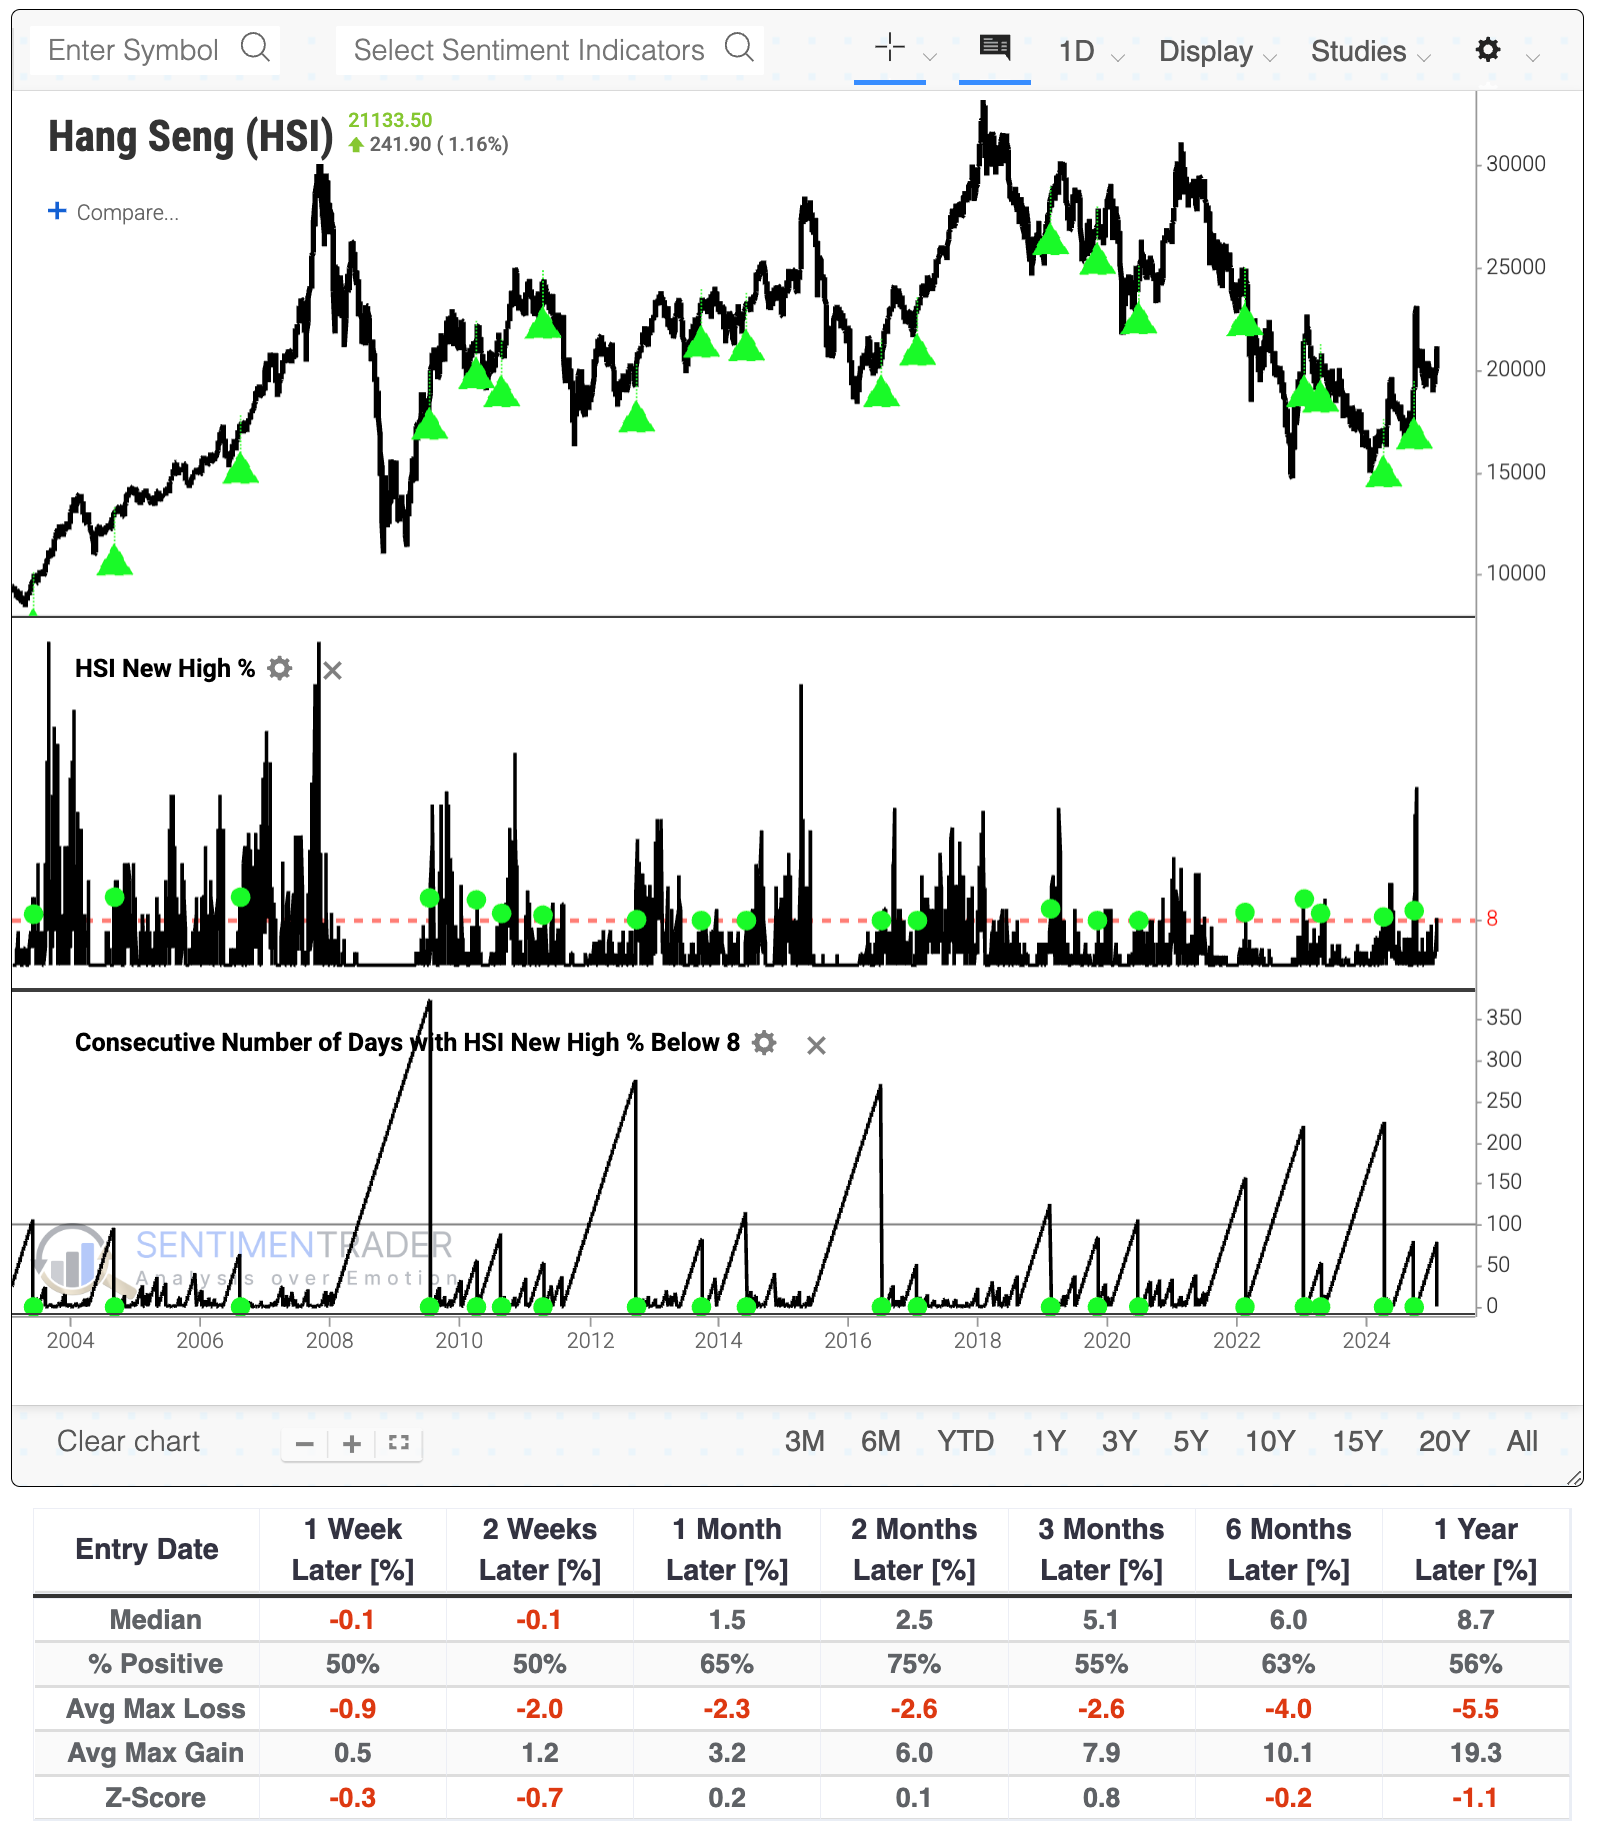
While the medium-term push is notable, it's more encouraging that some longer-term indicators are also looking up. For the first time in months, more than 8% of stocks in the Hang Seng have reached a 52-week high. Below, we can see that this was more constructive for the index. Over the next two months, the Hang Seng rallied 75% of the time, with three failures clustered during 2022-23. Outside that window, 15 of the 17 signals sported a positive return.
While not directly related to the Hang Seng or China writ large, it's interesting that copper prices are rallying strongly. Copper is often used as a proxy for Chinese economic conditions because China is the world's largest copper consumer.
The backtester shows us that copper was recently more than 20% below its 3-month high but has stormed back and is now trading at its highest price in months. Over the past decade, these copper recoveries have preceded some of the best rallies in the Hang Seng. Even over the past 30 years, the Hang Seng showed a positive return either one or two months later every time but once.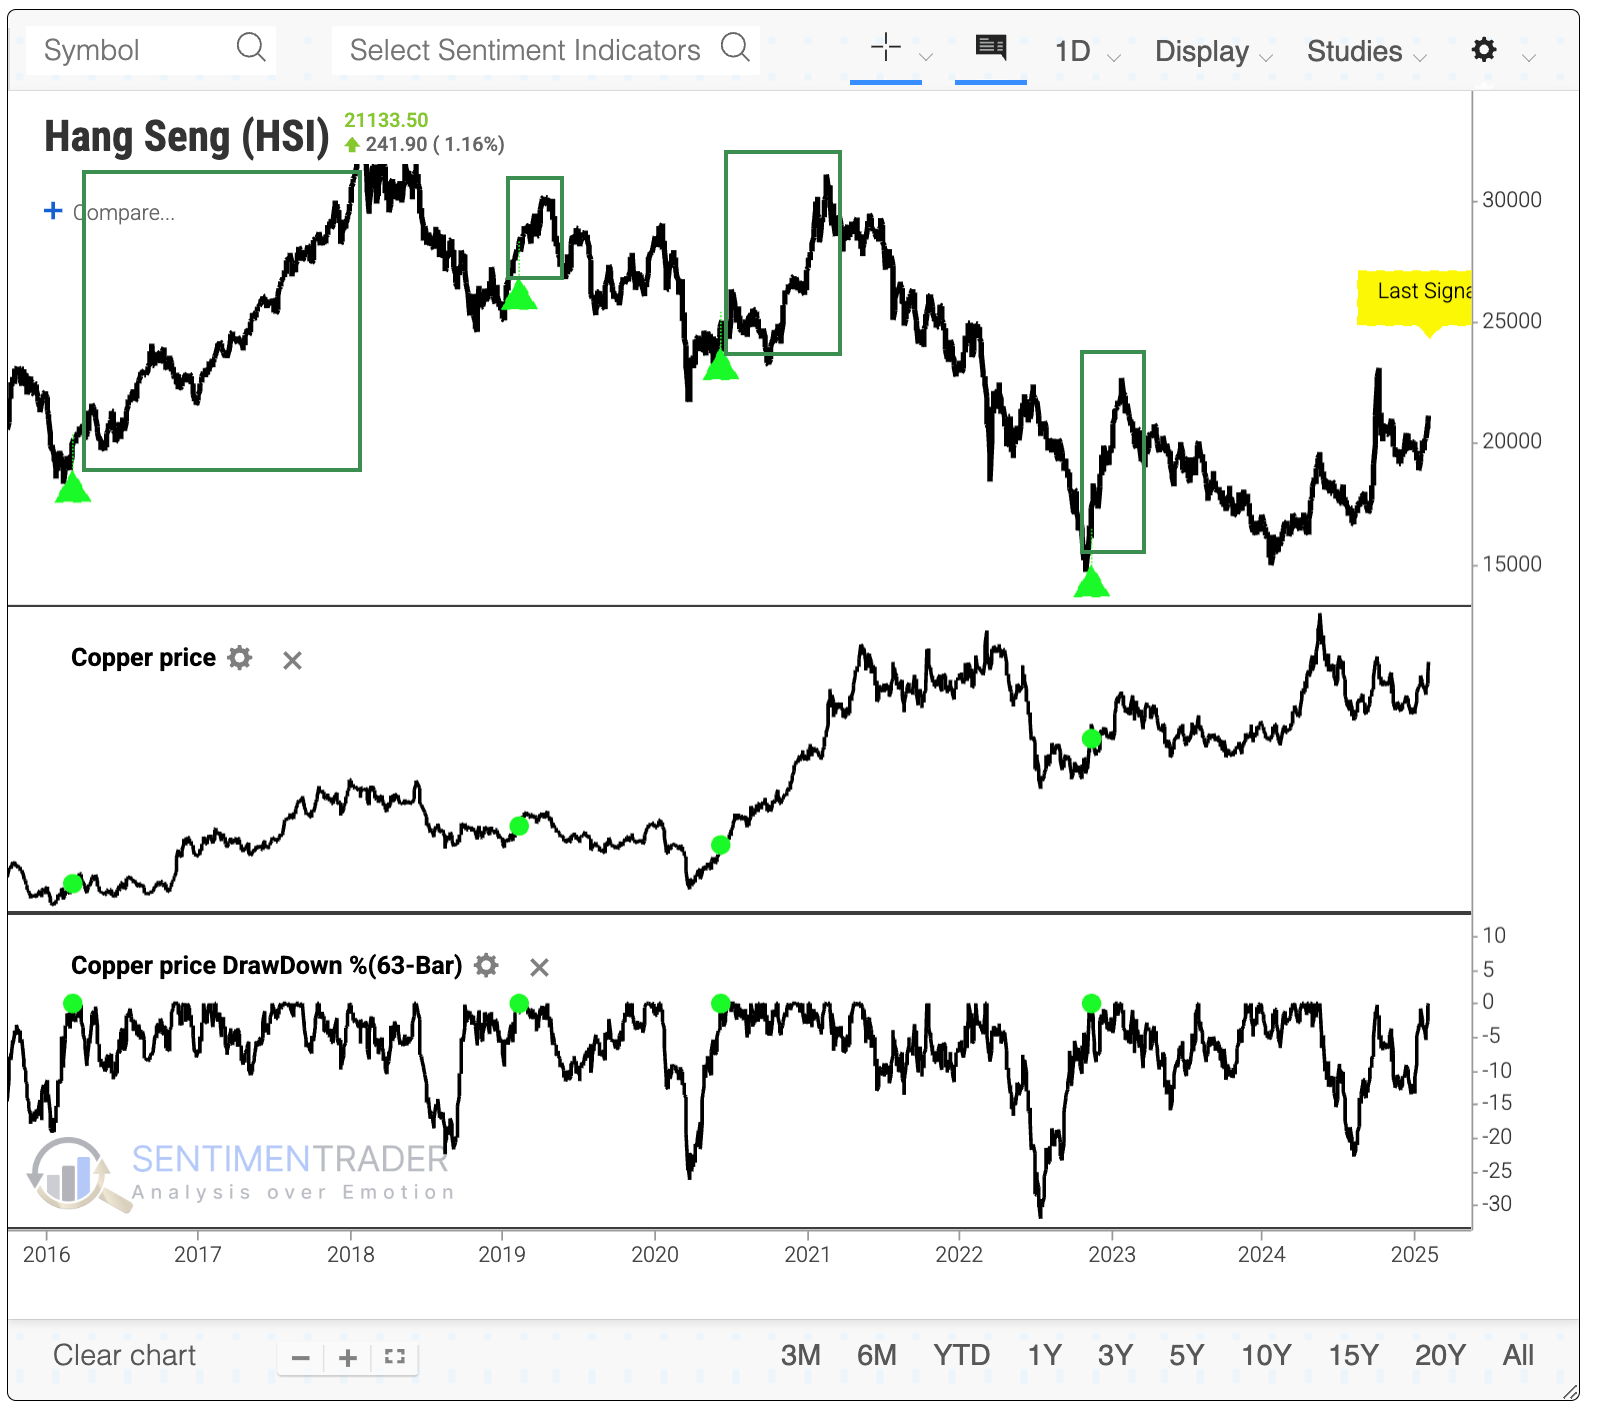
Commodity breakout
Over the last ten sessions, a spot commodity index closed at a multi-year high on three occasions. Dean showed that similar breakouts suggest the rally in a broad basket of commodities could persist over the next year.
Market technicians typically employ two concepts when analyzing breakouts to ensure sustainability. One method counts the number of trading days above the initial breakout point, while the other records the number of sessions achieving a high in a lookback period. Here we show the latter.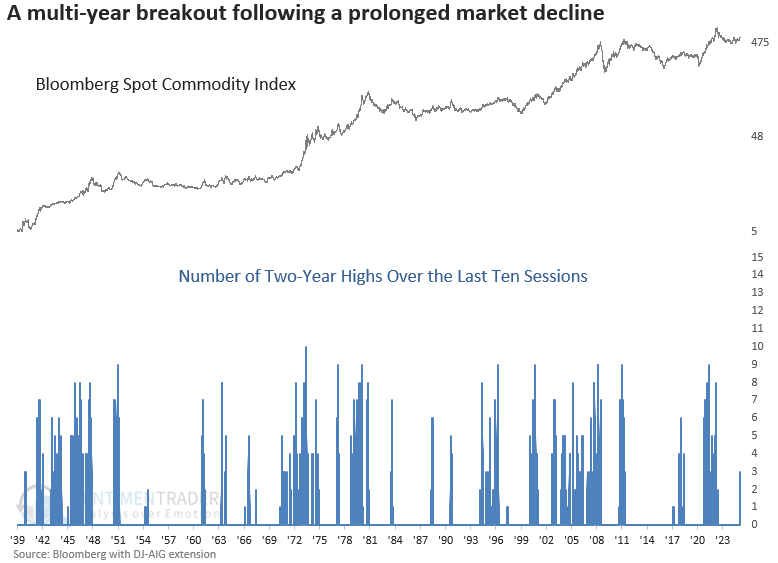
Whenever the Bloomberg Spot Commodity Index closed at a multi-year high in 3 out of 10 sessions for the first time after a two-year low, the rally in a broad basket of commodities tended to persist over the subsequent year. The initial two months showed notable strength, with the index rallying 77% of the time for a median gain of 4.6%, nearly reaching statistical significance compared to random returns.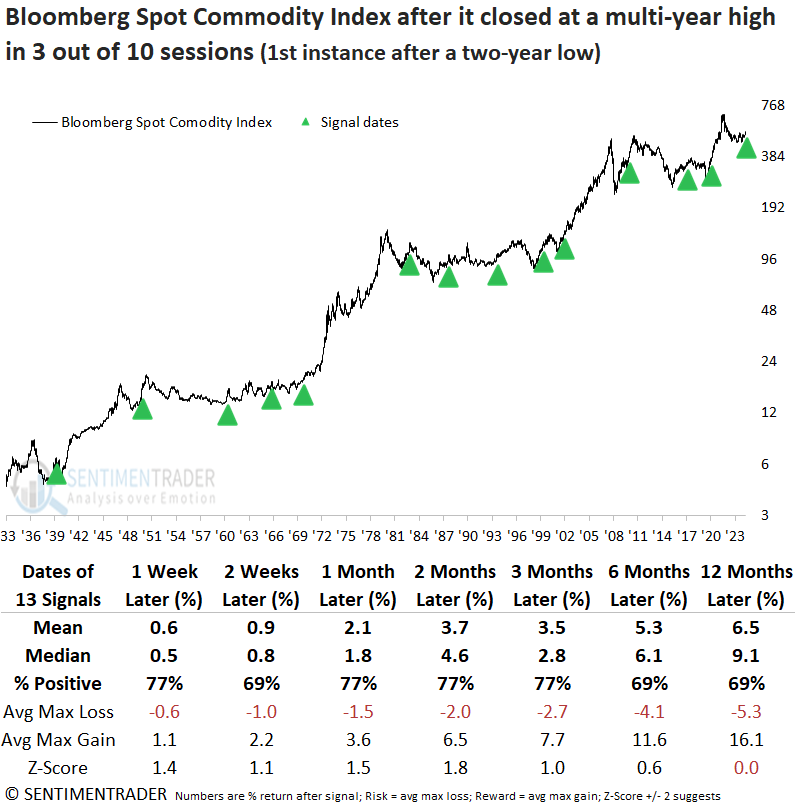
The energy sector rose in 92% of instances over the following year, posting a median gain of 8.1%. However, its average return of 18.3% outpaced all other sectors. Meanwhile, the materials sector, heavily tied to commodities, advanced 85% of the time in the next two months, delivering a median gain of 4.6%.
From a big-picture perspective, the stock market rallied alongside commodities, suggesting that the multi-year breakout aligns more with a reflationary phase associated with economic growth rather than a late-cycle inflationary spike that pressures equities. To assess inflationary pressures that could negatively impact equities, the 2-year rate of change for a basket of agricultural commodities is at 1%, well below the threshold historically linked to negative annualized S&P 500 returns.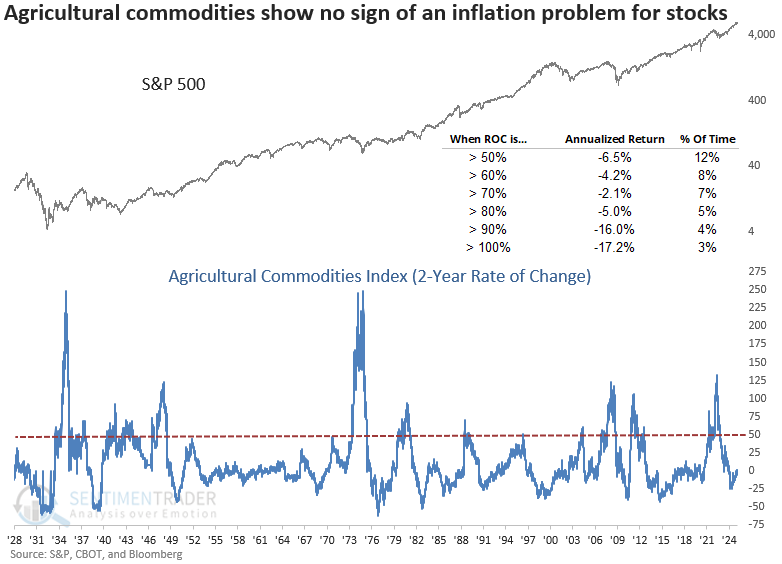
A bet on energy
If the positive implications for energy hold true, Jay showed an example of one inexpensive way to speculate on a bounce.
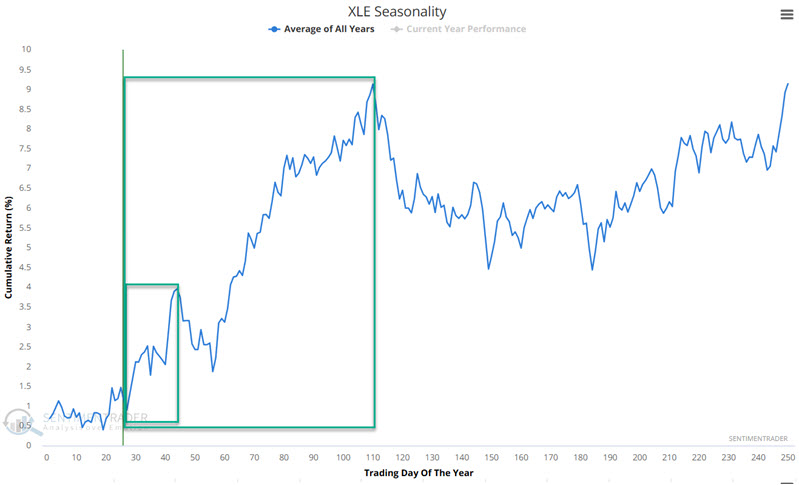
Options on oil ETFs like USO tend to carry a wide bid-ask spread. Because of this, Jay turned to the Energy Select Sector SPDR Fund (ticker XLE). The chart below notes that XLE has a seasonal expectation in the weeks and months ahead similar to crude oil.
Consider a trader who thinks that crude oil and, by extension, the highly correlated energy sector will "pop" sometime in the next several months. However, the trader is not interested in making a huge capital commitment.
One alternative is to buy 100 shares of XLE at $90.51 a share, which would require a commitment of $9,051. Another alternative for a trader looking to commit less capital would be to buy the XLE April 17 2025 90 strike price call option at $3.45, requiring a capital commitment of $345.
The expected dollar gain or loss based on the price of XLE shares as of four different dates (the red line is today) leading up to option expiration (the black line) appears in the chart below.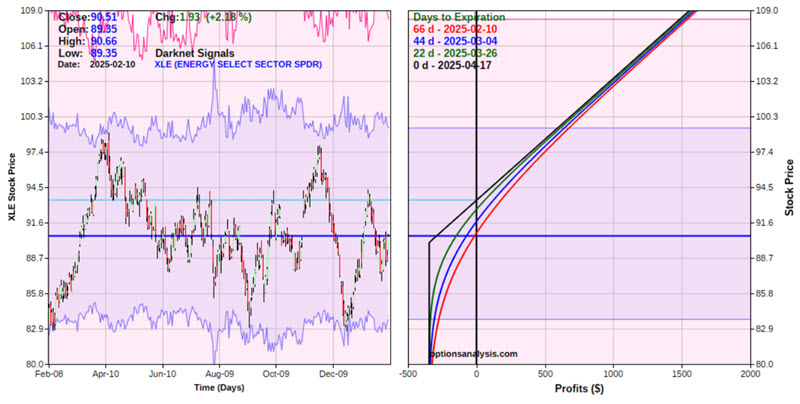
The worst-case scenario is that the position is held until expiration (April 17) and that XLE shares are trading at $90 or below, in which the entire $345 will be lost. The breakeven for this price is $93.45 (strike price of $90 plus premium paid of $3.45). Above $93.45, the option price will gain point-for-point with the stock.
More potential good news for energy
Unleaded gas prices have perked up recently and Jay showed that this vital commodity is entering a particularly favorable seasonal period. The chart below shows the annual seasonal trend for unleaded gas futures.
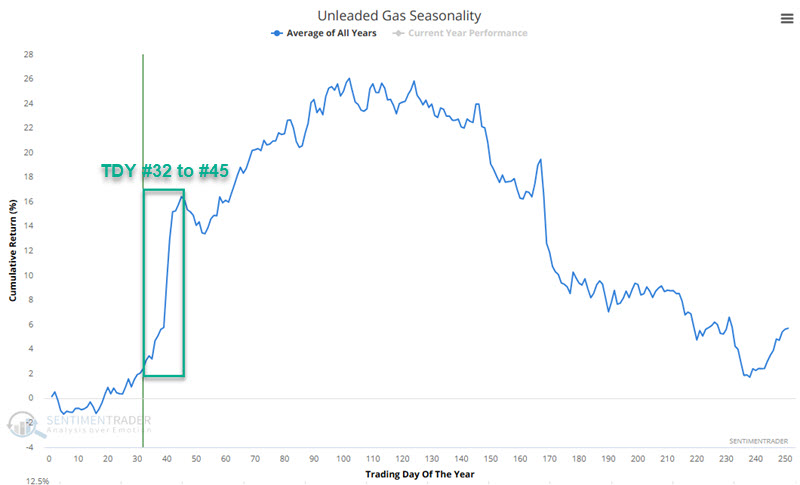
The green box highlights the period that extends from the close on Trading Day of the Year (TDY) #32 through TDY #45. For 2025, this period extends from the close on 2025-02-14 through 2025-03-05.
The chart below displays the hypothetical cumulative $ +(-) achieved by holding a long position in unleaded gas futures only during this period each year since 2006.
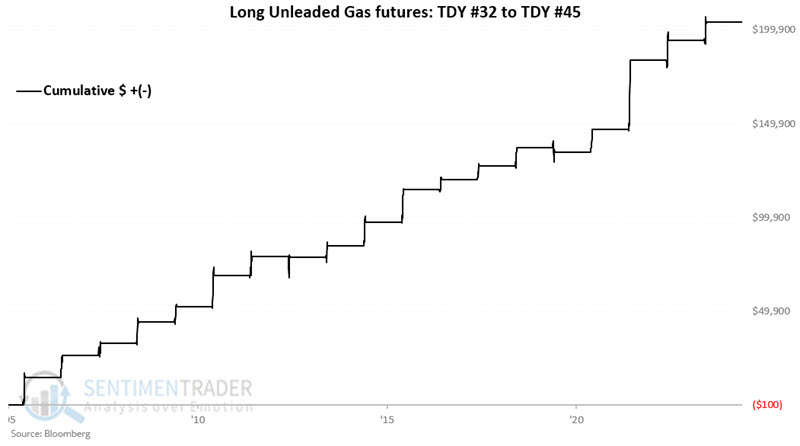
These periods witnessed a gain 89% of the years, with a median gain more than seven times larger than the median loss. The contract gained more than +$10,000 ten times, while never losing more than -$10,000 during the losing years.
About TradingEdge Weekly...
The goal of TradingEdge Weekly is to summarize some of the research published to SentimenTrader over the past week. Sometimes there is a lot to digest, and this summary highlights the highest conviction or most compelling ideas we discussed. This is NOT the published research; rather, it pulls out some of the most relevant parts. It includes links to the published research for convenience, and if you don't subscribe to those products, it will present the options for access.