
TradingEdge Weekly for Aug 5 - Returning confidence, a broad rally, impressive thrusts

Key points:
- Small traders haven't been chasing the rally
- Even so, overall Dumb Money Confidence rebounded to an important threshold
- The rally has been broad in stocks, and many S&P 500 companies have returned to uptrends
- That has led to a thrust in overbought signals
- A longer-term recovery has turned the McClellan Summation Indexes positive
- India's Sensex index is also showing some impressive internal thrusts
- For some reason, there have been certain days to NOT own cryptos
- Metal and mining stocks, and emerging markets, are facing a tough seasonal window
Small traders ain't buyin' it
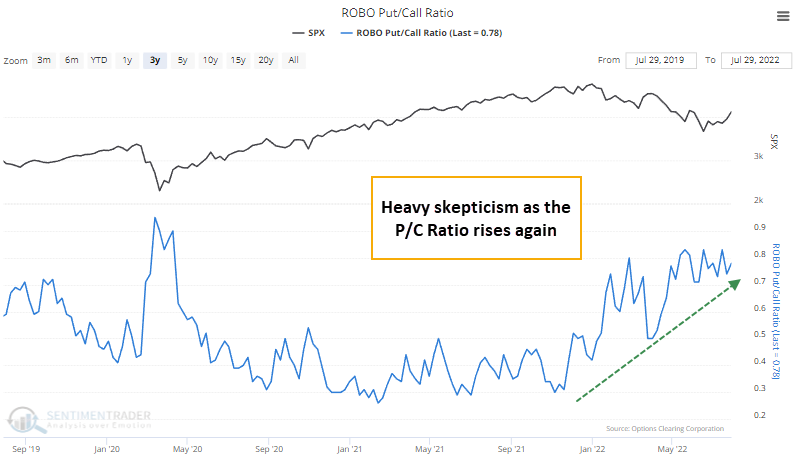
Two weeks ago, we saw that small options traders were pressing their bets against stocks. The bear market shifted traders' behavior from the speculative frenzy that peaked in early 2021; they're not giving up on their newfound skepticism.
Last week, despite a large and broad rally in stocks, small traders became even more negative. Continuing their heavy bets against stocks, traders used the rally to spend more of their volume on buying put options to open.
The table below shows every time when the S&P 500 rose 3% or more in a single week, yet small options traders bought at least 10% fewer call options than they did the prior week.
Forward returns were well above random, and the risk/reward ratio was quite positive. It wasn't perfect - there were some big losses in 2000 and during the financial crisis - but generally, stocks performed well.
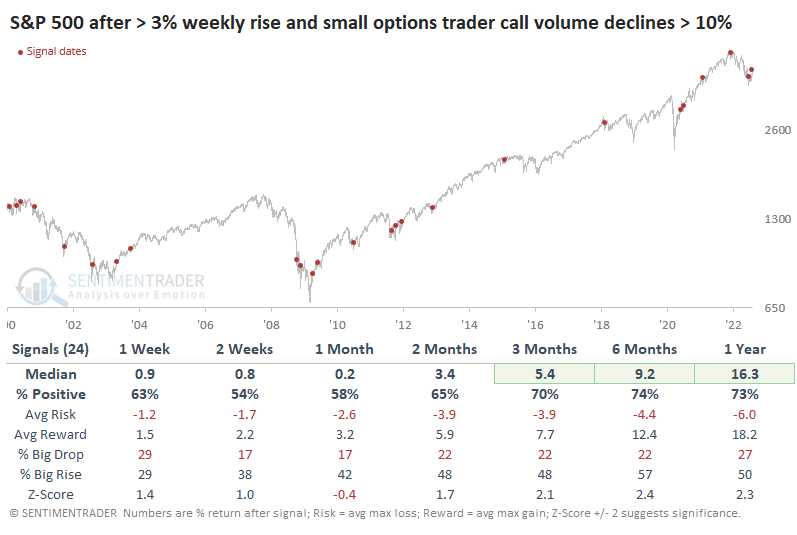
We often look at counter-examples to see if anything changes. We can have more confidence in a study if the opposite condition shows opposite results. In this case, it does to a certain extent. When the S&P rallies hard and small traders increase their call buying by 10% or more, forward returns were significantly weaker across most time frames.
Still, there has been a recovery in Confidence
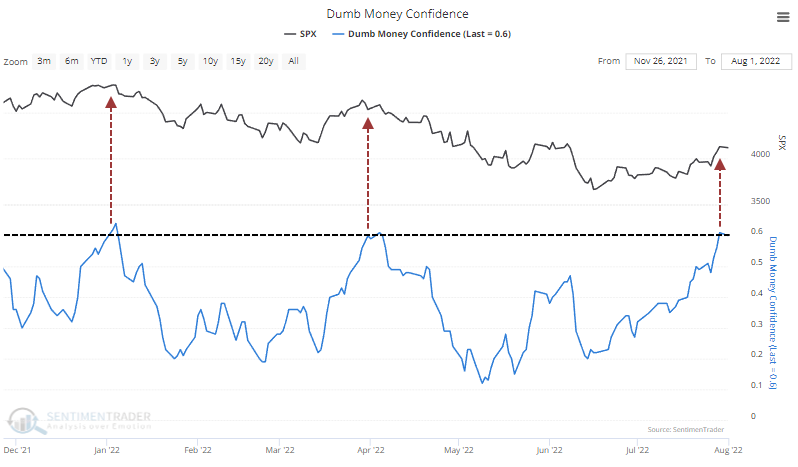
Even though small options traders are hesitant, others are not, and Dumb Money Confidence has climbed above 60% for the first time in months. This threshold generally serves as a good delineator between healthy and unhealthy markets.
When it stays below 60% consistently, sentiment is poor and periods of recovery tend to bring in sellers. That's what happened the last two times it got this high since the peak. Once sentiment recovered to the degree it has now, stocks peaked, and the next down leg was imminent.
The current move above 60% in Dumb Money Confidence ended one of the longest streaks in sub-60% Confidence since we began computing this in 1998.
If we look only at recoveries in bear markets, it's clear that further gains tend to be muted, with no gains more than 6.6% at any point within the next six months.
After Confidence recovered during bull market environments, there were few significant losses going forward. The only real exception was 2015 when the S&P suffered a double-digit drawdown within the next three months before recovering. The S&P rallied more than 6.6% within three months after five of the seven signals.
It's not clear at the time of the recovery in sentiment whether it might present us with a good opportunity to buy or sell (unlike the sentiment extremes and thrust signals in recent notes). This is more of an attitudinal check. Sentiment has moved out of a pessimistic extreme, and during bear markets, it doesn't usually get a chance to recover much more before sellers sense an opportunity. During bull markets, those sellers usually get rolled right over. Whichever behavior we see in the weeks and months ahead will determine whether long-term investors would best be served by adding more exposure.
A majority of stocks have recovered
A little over a month ago, we looked at the internal recovery among stocks in the S&P 500 after a string of violent moves. Similar behavior preceded excellent returns. It's only gotten better since then.
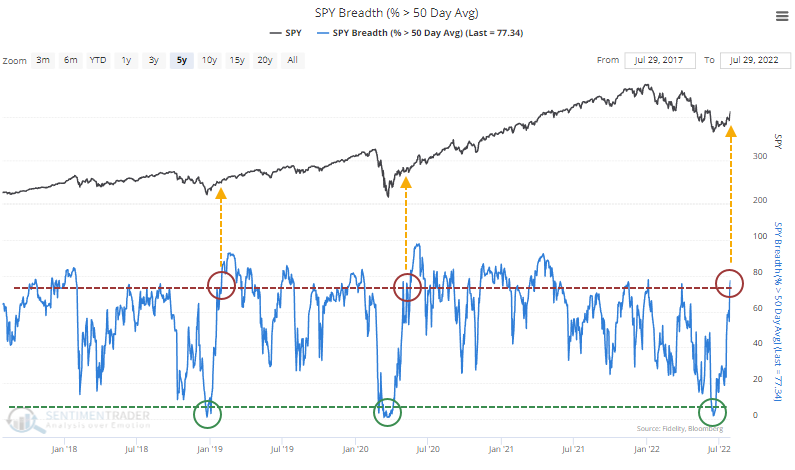
With a continued rise last week, more than three out of every four stocks in the index recovered above their 50-day moving averages, the most since the beginning of the year. The other two times in the past five years, when this cycled from fewer than 5% of stocks to more than 75%, it coincided with the kick-off to sustained rises.
Historically, this was more the rule than the exception. Since 1950, there have been 25 times when medium-term uptrends in S&P 500 stocks plunged to an extremely low level and then recovered to a high level. Over the next 6-12 months, losses were rare, and there was really only one complete failure in 1969.
The current cycle is even more notable because of how quickly it unfolded. It took only 27 trading days for stocks to recover, the 6th-fastest cycle in more than 70 years. The table below filters the cycles to include only those triggered within two months. The following 6-12 months showed excellent returns, with no losses a year later.
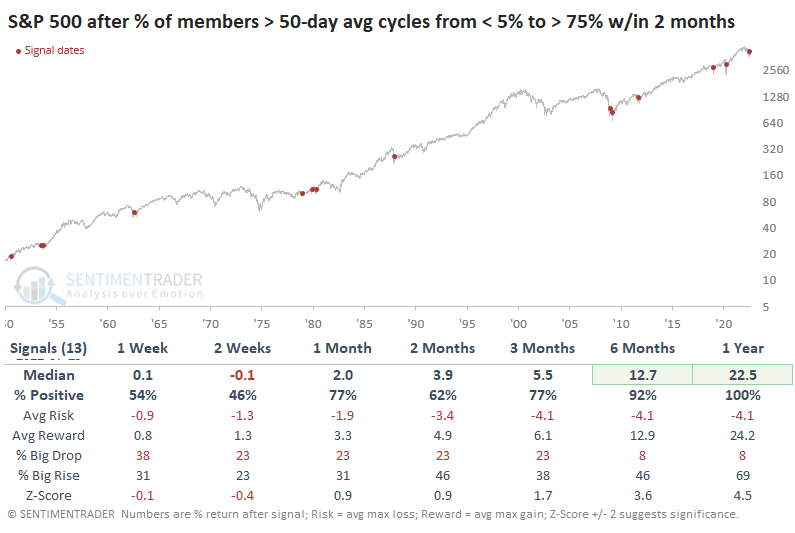
It took some grit for an investor to hold after the January 2009 signal, suffering a nearly 30% drawdown within the first three months. That was the only one that an investor would have hold through a double-digit drawdown.
The recovery triggered some overbought signals
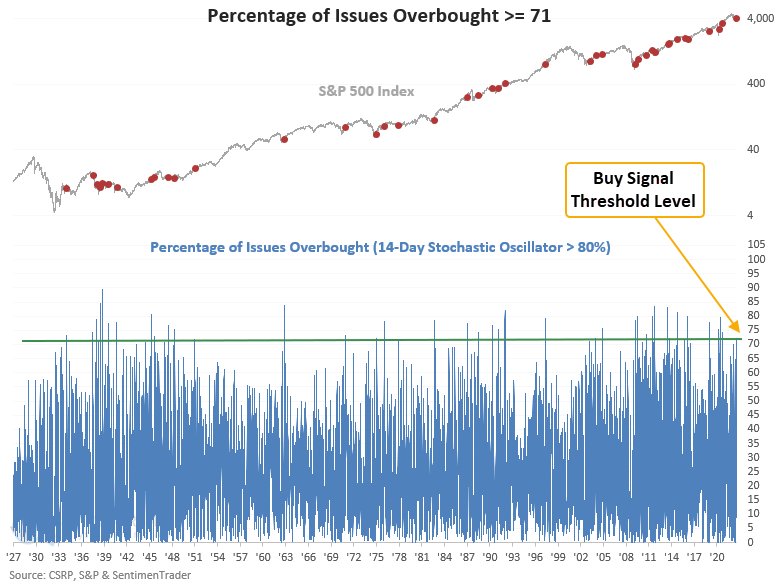
Dean noted that another type of thrust signal issued an alert at the close of trading on Monday.
The model uses the stochastic oscillator, a technical indicator that measures momentum by comparing the current closing price to the high and low price over a lookback period. The standard setting is 14 days, and the oscillator ranges from 0% to 100%. The algorithm identifies when the percentage of S&P 500 issues with a 14-day stochastic oscillator above 80% reaches 71.
This model generated a signal 40 other times over the past 88 years. After the others, S&P 500 future returns, win rates, and z-scores were excellent across almost all time frames. The signal shows a gain at some point in the first 2 months in 37 out of 40 instances.
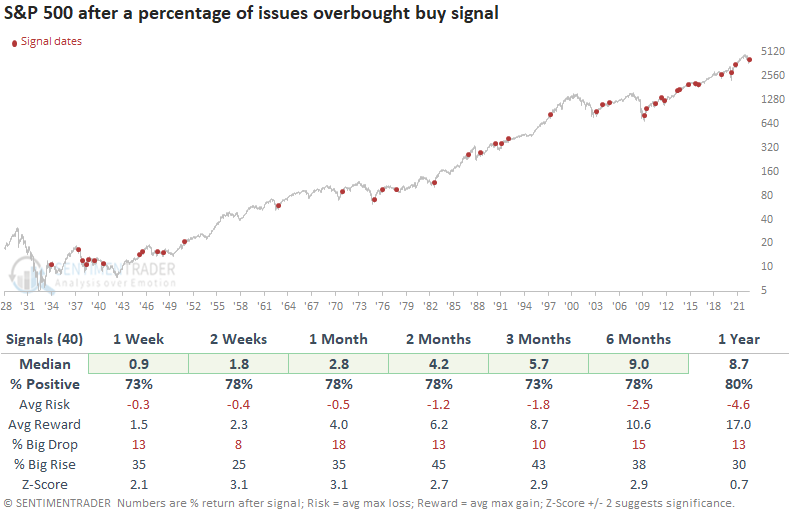
After the S&P 500 closed down 20%, the model generated a signal 16 other times in the last 88 years. Since 1950, the alert shows a perfect record 6 and 12 months later.
An important "market environment" metric turned positive
The fact that most stocks haven't fallen back much has helped improve some longer-term measures of internal momentum. The NYSE McClellan Summation Index has managed to claw back above zero. A positive and rising Summation Index is one key sign of a healthy market environment.
The return to a healthy state ended one of its longest-ever stays below zero, though a recovery in the Summation Index after a long period below zero wasn't necessarily an all-clear signal.
The Nasdaq exchange is more heavily populated by some of the technology and speculative stocks that took the brunt of the selling pressure this year. So, it has been an even longer stretch for the Nasdaq McClellan Summation Index below the zero threshold.
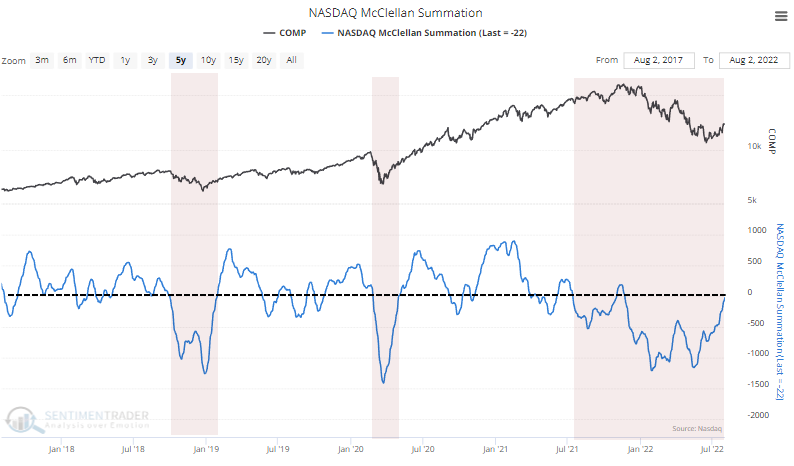
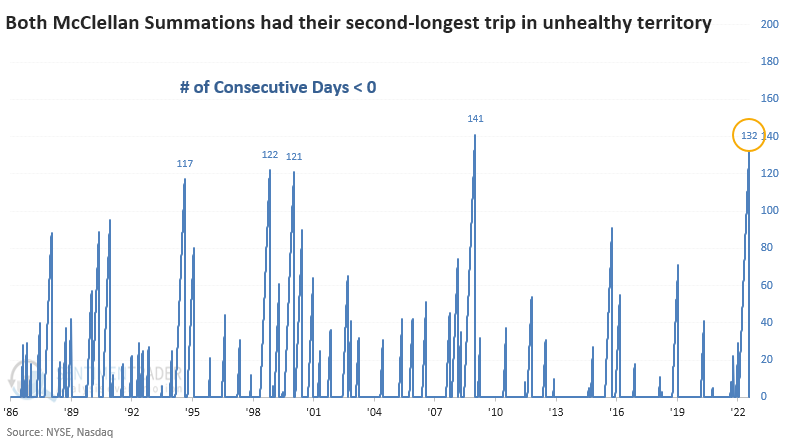
At 173 days, it was the second-longest stretch below zero for that indicator in nearly 40 years. Only the devastatingly unhealthy global financial crisis beat it out.
Internal recoveries on the Nasdaq were better for long-term returns. The Composite showed a gain either six or twelve months later all but one time. The only exception was a failed rally after the pricking of the internet bubble in 2001.
When we look at both Summation Indexes together, it was also the second-longest streak below zero, just eclipsed by the financial crisis. That's a pretty remarkable fact - that in the past ~40 years, only the worst market anyone has experienced since the Great Depression was (barely) worse than the past six months.
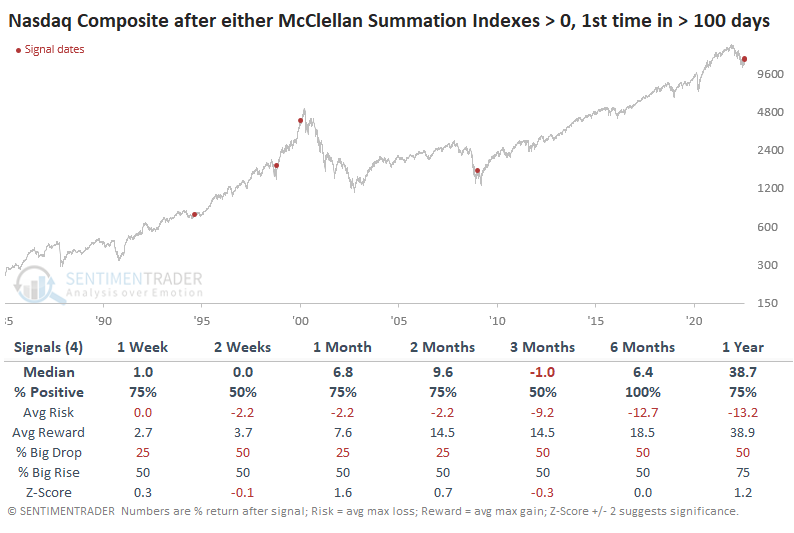
The Nasdaq responded well after the few precedents.
As an aside, both Dean and I have outlined recent thrusts in the high-yield bond market. Because of the recovery in many junk bonds, that market's Summation Index has recovered, too. This ends its longest-ever streak below zero, exceeding even the financial crisis.
The U.S. doesn't have the only markets showing positive thrusts
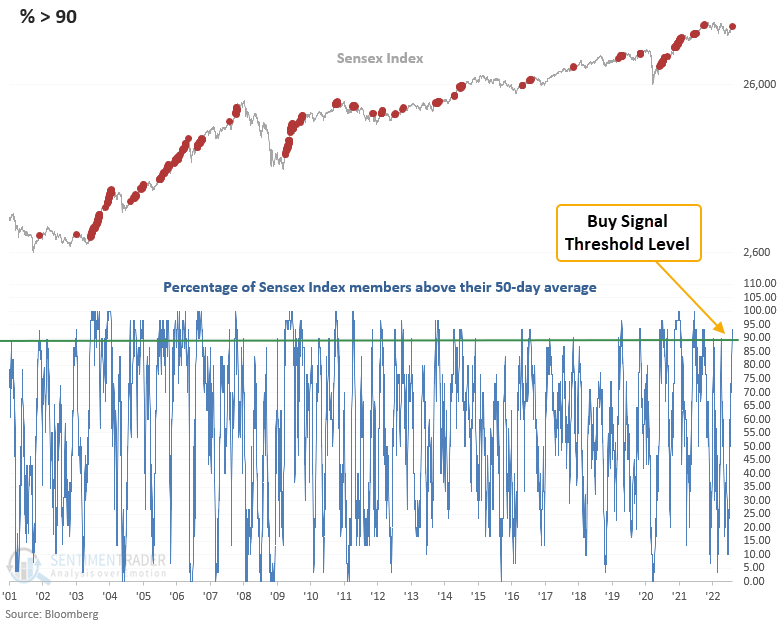
In a recent note, Dean shared a way to use the percentage of index members above their 50-day average to give an all-clear signal after a bear market. He noted that this week, the Sensex Index jumped out of the gate with a new alert.
For the first time in more than a year, the number of Sensex members trading above their 50-day average exceeded 90%. To generate a signal, this must drop below 25% before thrusting higher.
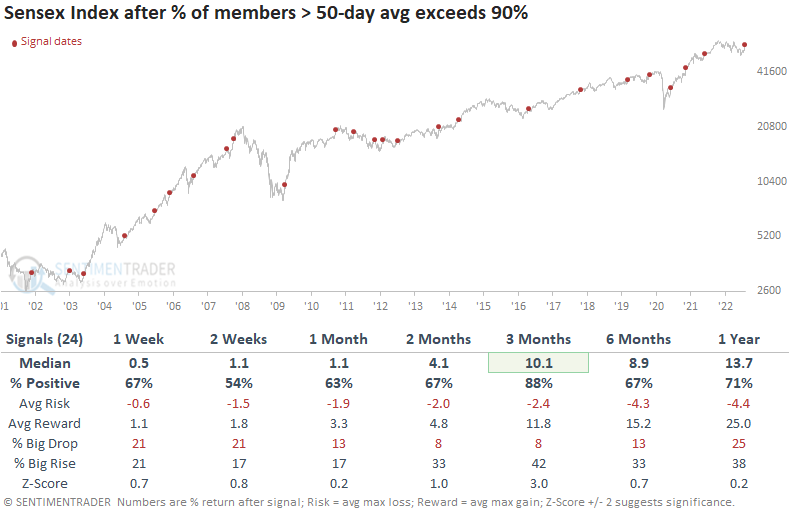
This model generated a signal 24 other times over the past 21 years. Forward returns, win rates, and z-scores look favorable, especially in the 3-month window.
Other technical aspects of the Sensex are improving as well, like a composite trend model, and its performance relative to domestic markets.
When NOT to own cryptos
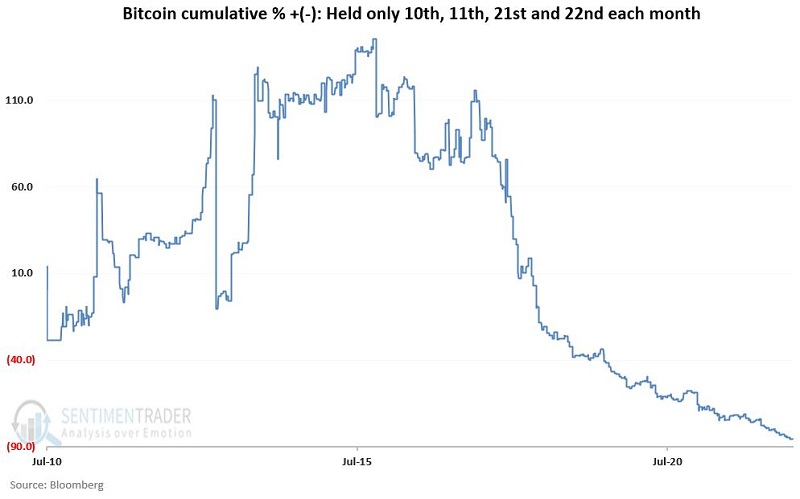
Bitcoin (BTC) is the most well-known cryptocurrency and has been trading since 2010. Jay showed that certain days of the month have consistently seen poor price behavior and certain months have typically shown below-average results.
The days to avoid are the 10th, 11th, 21st, and 22nd of the month (calendar days, not trading days). The chart below displays the cumulative % +(-) for an investment in Bitcoin if held only during these four days every month since July 2010.
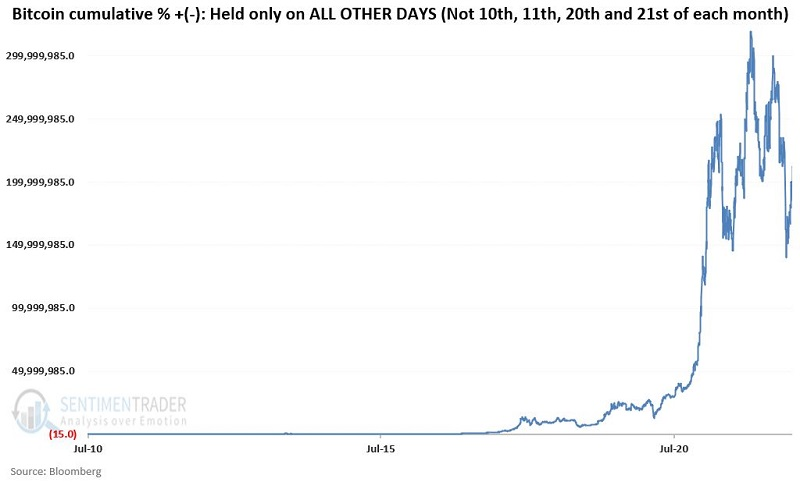
The chart below displays the cumulative % +(-) for an investment in Bitcoin if held during ALL OTHER days of the month since July 2010.
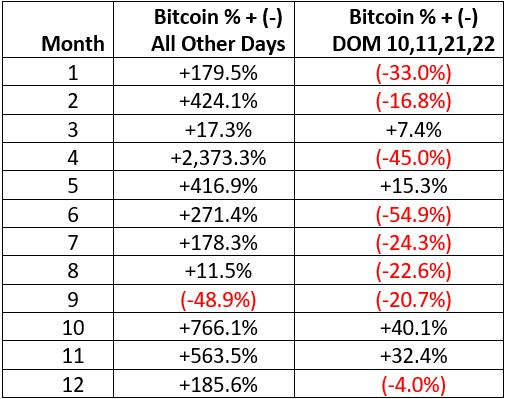
Now let's break things down on a month-by-month basis and look at performance on calendar days of month 10, 11, 21, and 22 each month. The table below displays the cumulative % gain/loss for Bitcoin each month during days of month 10, 11, 21, and 22 versus all other days of the month from 2010 until late July 2022.
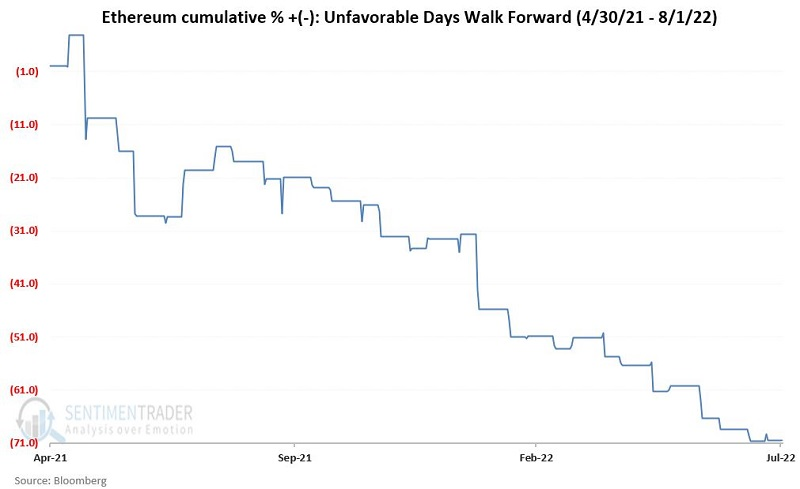
Jay followed up with other cryptos, showing that these bad days of the month extended to other coins as well. The backtested study period showed a near-steady decline for ethereum.
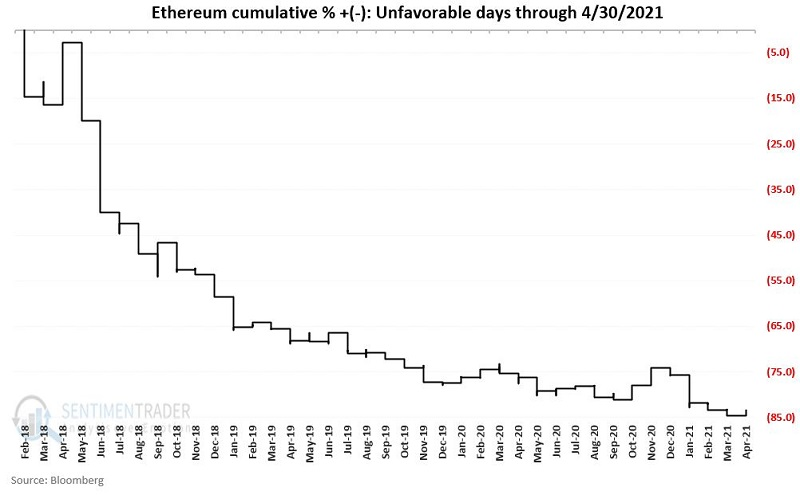
When using a "live" market, returns on these days were still exceptionally poor.
Metals and emerging markets are entering a tough spot
Jay showed that the S&P Metals and Mining Index and the MSCI Emerging Markets Index are entering unfavorable seasonal periods. The message is not so much that these sectors are likely to decline but rather that investors can likely find better opportunities elsewhere.
Ticker XME (SPDR Metals & Mining ETF) is an ETF that tracks the S&P 500 Metals and Mining Index. It has a seasonally unfavorable period between Trading Day of Year (TDY) #145 and TDY #191. For 2022, this period extends from the close on 8/1/2022 through the closing on 10/5/2022.
The chart below displays the cumulative % + (-) for the Metals & Mining Index only during this seasonally unfavorable period since 1980.
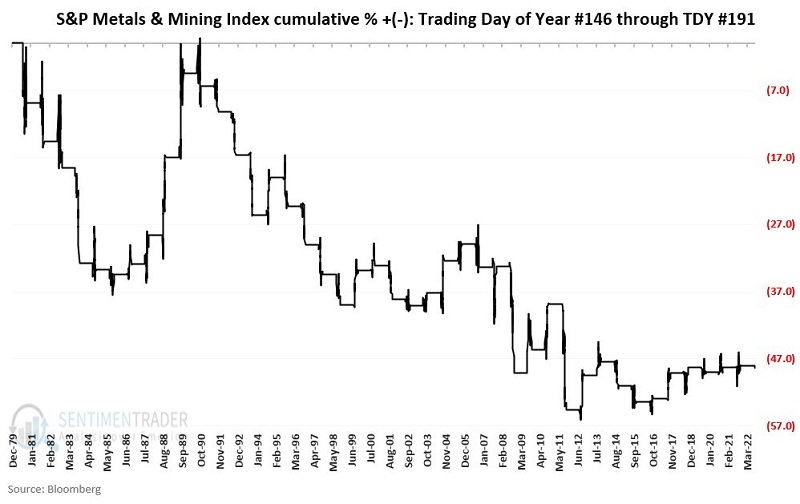
The net effect is pretty evident in the chart above. While the years it showed a negative return during these stretches only modestly outnumbered the years with gains, losses during the bad years tended to far outpace the good years.
About TradingEdge Weekly...
The goal of TradingEdge Weekly is to summarize the research published to SentimenTrader over the past week. Sometimes there is a lot to digest and this summary is meant to highlight the highest conviction or most compelling ideas we discussed. This is NOT the full research that's published, rather it pulls out some of the most relevant parts. It includes links to the published research for convenience; if you don't subscribe to those products it will present the options for access.