
TradingEdge Weekly for Aug 26 - Long-term momentum, worrying short-term signs, energy stock surge

Key points:
- The NYSE and Nasdaq McClellan Summation Indexes have cycled from oversold to overbought
- A worry is that index momentum is rolling over according to the MACD indicator
- Another worry is seasonality during the month of September
- Real estate is a sector that has also struggled during the month
- Energy stocks have perked up again, with a surge in members above their 200-day averages
- The German stock market faces some further short-term headwinds
- High-yield bonds have settled back after breadth thrusts similar to that seen in stocks
- Unleaded and natural gas prices are facing some headwinds
- Reasons why the recent momentum in coffee might be a bull trap
Longer-term internal momentum has a bullish thrust
A few weeks ago, we saw that a key to a healthy market environment had turned positive. It continued to improve until the last week.
Once the NYSE McClellan Summation Index crossed the zero line at the end of July, it kept going, exceeding +800 before starting to roll over in recent days. The only other times in the past five years it went through similar cycles were the starts of persistent uptrends.
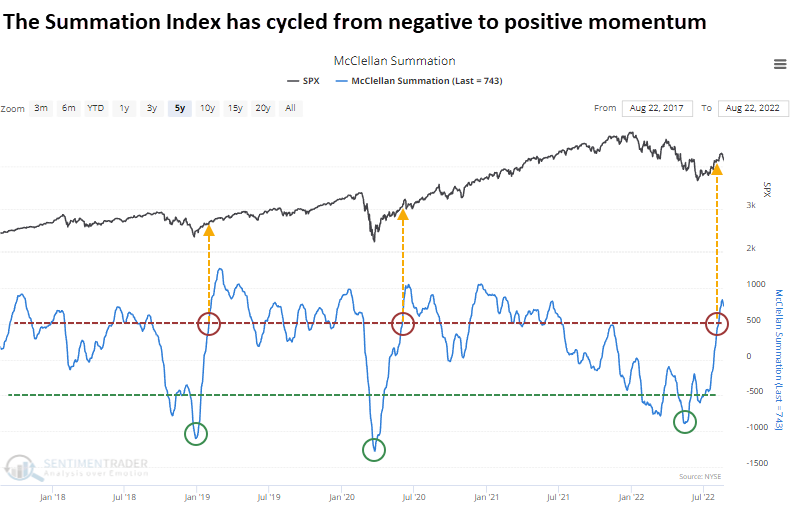
The same thing happened with the Nasdaq McClellan Summation Index. If we average the two indexes, they cycled from below -1000 to above +650. Since our Nasdaq data began in 1986, this has happened seven other times, shown in the table below.
All but one were the beginning of new bull markets. That sole exception, in 2001, is a bugger since it's a time period that has many similarities to our current environment.

Returns in the Nasdaq Composite after these signals were even more impressive. On average, the Nasdaq enjoyed more significant average gains, lesser losses, and bigger maximum gains across every time frame.
Shorter-term, a loss of index momentum is worrying
The Moving Average Convergence Divergence (MACD), invented by Gerald Appel, is a trend following momentum indicator.
Dean showed that on Monday, the differential between the MACD line and its nine-day exponential moving average turned negative, with the MACD line in positive or overbought territory. At the same time, the index remains below the 200-day moving average.
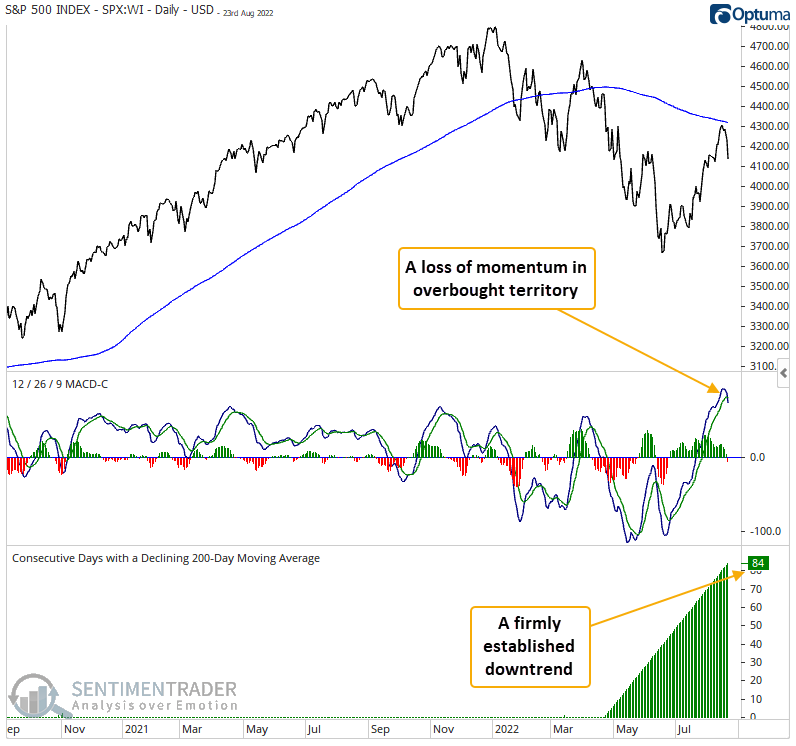
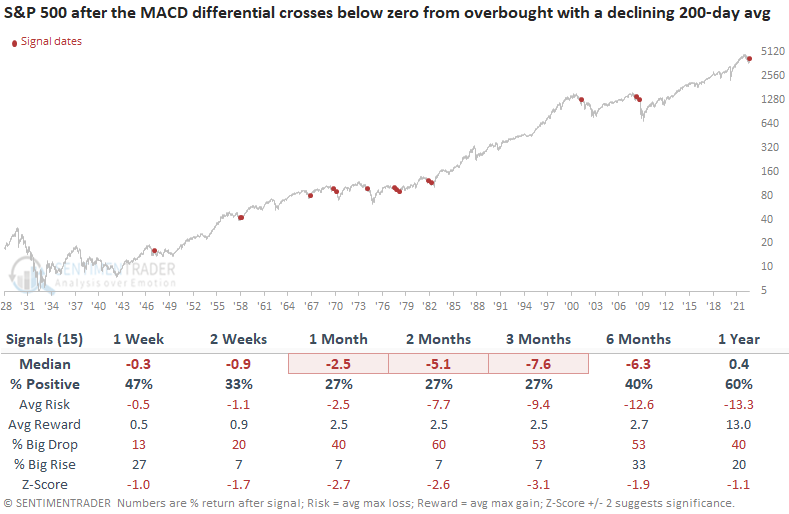
A loss of momentum from overbought territory within an established downtrend looks unfriendly across short to medium-term time frames. The signal shows a loss at some point in the first two months in 29 out of 37 instances.
Signals that occurred when the S&P 500 was down 20% or less from a multi-year high, which is the case now, show a significantly worse outlook across all time frames. Once again, the first few months look troubling, with a negative return at some point in 13 out 15 instances.
We've had a nice rally off the June lows with several thrust signals showing broad-based participation from index members. The weight of the evidence continues to favor the bulls. However, we always need to keep an open mind and remember that the market can throw us a curve ball from time to time.
Seasonality is also a shorter-term headwind
September has historically been the worst month for the stock market. Jay noted that factors that can affect performance are the four-year election cycle, the 20-year cycle, and whether the stock market is in an uptrend or downtrend entering September. These factors presently suggest caution in September 2022.
September has a bad reputation regarding the stock market, and deservedly so. The chart below displays the cumulative % +(-) for the Dow Jones Industrial Average during September starting in 1900.
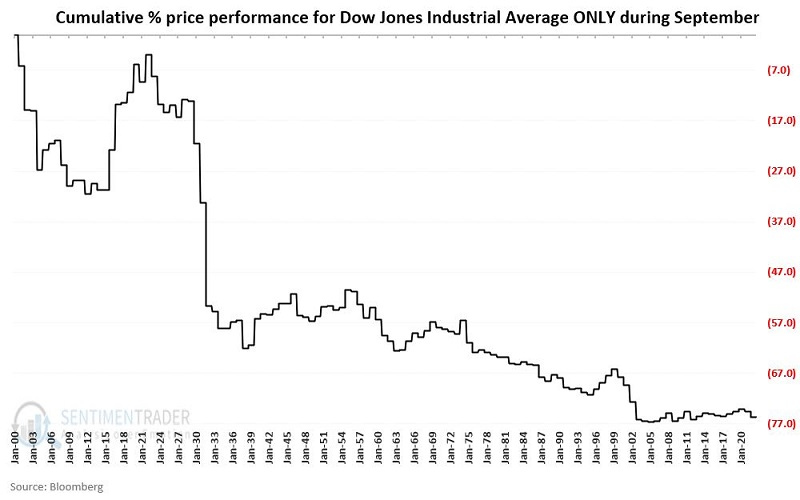
Let's break apart the results based on whether the Dow closed August above or below its 10-month moving average. The black line in the chart below displays the cumulative % +(-) for the Dow Jones Industrial Average during September if the Dow closed August above its 10-month moving average. The red line shows its return if it was below its 10-month moving average.
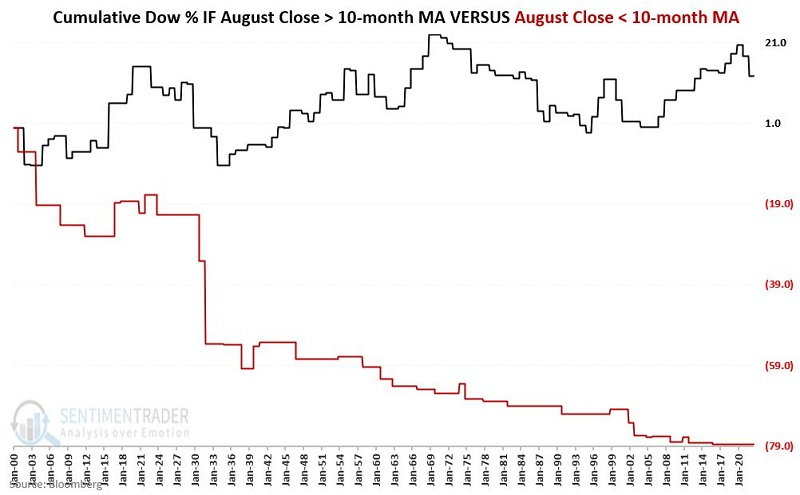
If the Dow was below its 10-month moving average at the end of August, it showed a gain in September only 11 times, versus losses 27 times. As this is written, the Dow is below its 10-month moving average.
Jay also showed how stocks have struggled during mid-term election years and during the "ugly 17 months" cycle. Both are pointing lower for September in 2022.
Real estate stocks also tend to have a tough September
Real estate has historically been a weak sector during September. Using sector index data, Jay looked at the long-term history of real estate during the month and found it lacking.
The cumulative total return for the real estate sector if held only during September starting in 1926 was disastrous. The massive collapse in the early 1930s dominated performance. So, to get a clearer picture, the chart below displays the cumulative total return for the real estate sector if held only during September during the post-WWII period starting in 1945.
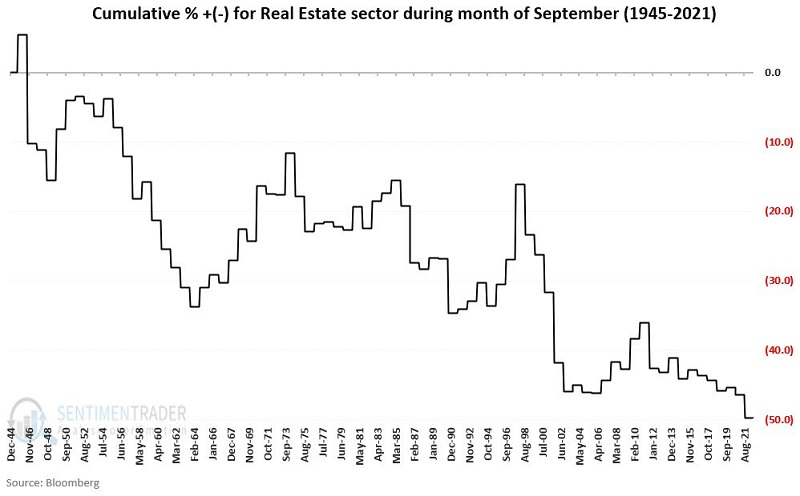
Even excluding the devastating September results from the 1930s, September has not been a banner month for real estate. It has been up 39 years and down 57 years. Average and maximum gains were lower than average and maximum losses. Something to consider as we head into the new month.
Energy stocks have perked up again
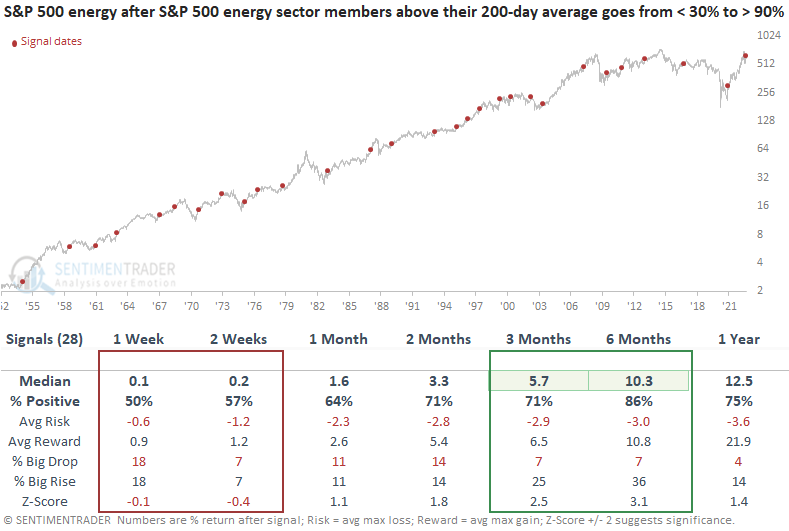
Dean showed that more than 90% of S&P 500 energy stocks are now above their 200-day average. The broad-based participation occurred after fewer than 30% closed above their average. After similar reversals, the S&P 500 energy sector was higher 86% of the time.
After dropping over 20% in seven days, one of the swiftest bear markets in history, the energy sector has reversed course. It now looks poised to reassert itself as a market leader.
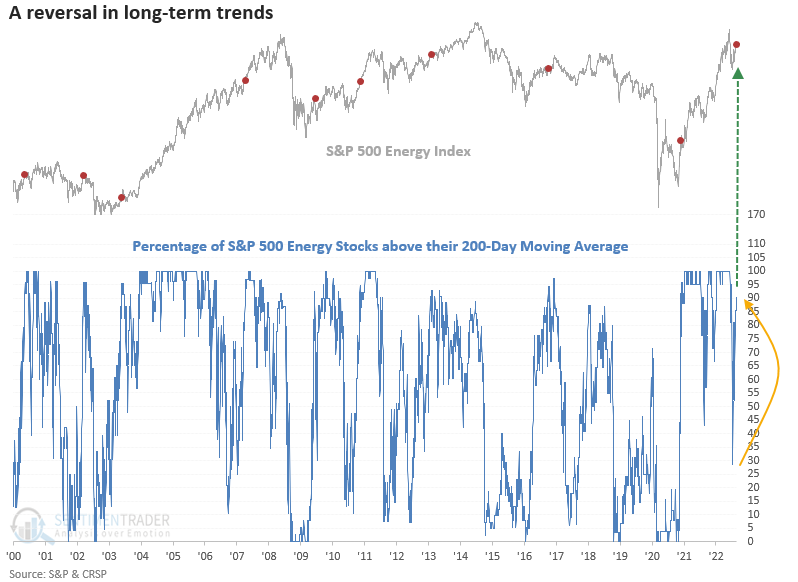
A reversal in long-term uptrends looks bullish across medium and long-term time frames with significant z-scores in the three and six-month windows. Besides March 2002, drawdowns were relatively benign across the long-duration time frames. The near-term looks mixed, especially more recent signals.
German stocks struggle with sky-high electricity prices and terrible seasonality
A month ago, Jay highlighted a bearish play on the German stock market. Since then, it has not moved much. However, energy prices and inflation have soared to historic levels, and Jay noted that unfavorable seasonality still portends potential trouble in the month directly ahead.
The annual seasonal trend chart for the iShares MSCI Germany ETF (EWG) below also suggests the continuing potential for weakness in the month or so ahead. The unfavorable seasonal period bottoms on October 11.
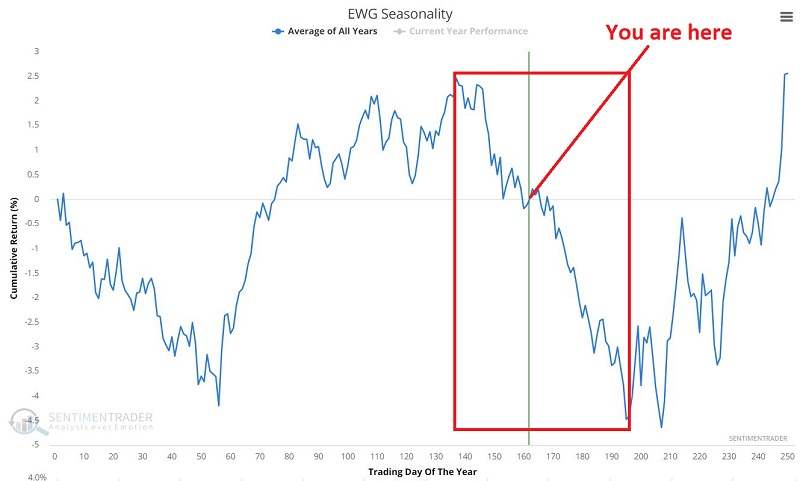
Jay then went on to detail what buying a put option would look like to potentially capture some of these downside influences while limiting risk in case the market bucks its headwinds.
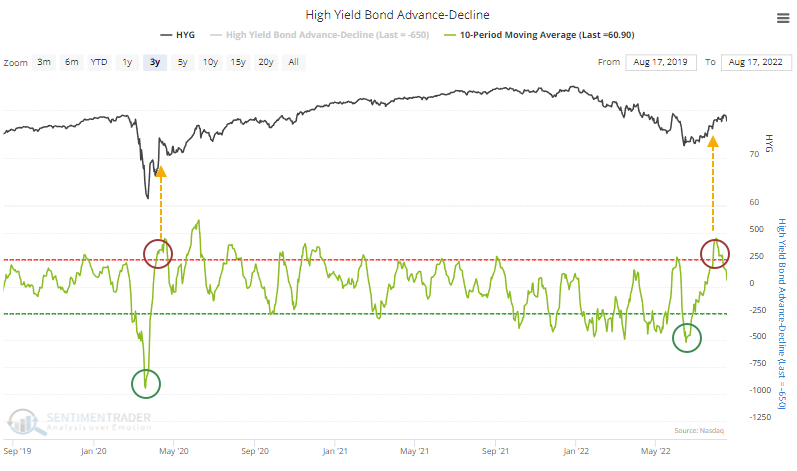
High-yield bonds are falling back after a big thrust
Signs of buying thrusts in stocks have been triggering for over a month. It's not the only market that has seen overwhelming bouts of buying interest, as high-yield bonds have as well.
We looked at this on July 28, showing that high-yield bonds are trying to recover, and Dean noted another thrust the next day. The 10-day Advance/Decline Line for high-yield bonds recovered from a severe oversold condition and has since returned to neutral, similar to the move after the pandemic panic.
As a result, the market triggered a modified Zweig Breadth Thrust. The table below shows when the 10-day exponential moving average of the Advance/Decline LIne for high-yield bonds cycles from below 40% to above 61.5%. Because this market tends to be slower-moving than stocks, we ignore the number of trading days between the oversold and overbought conditions.
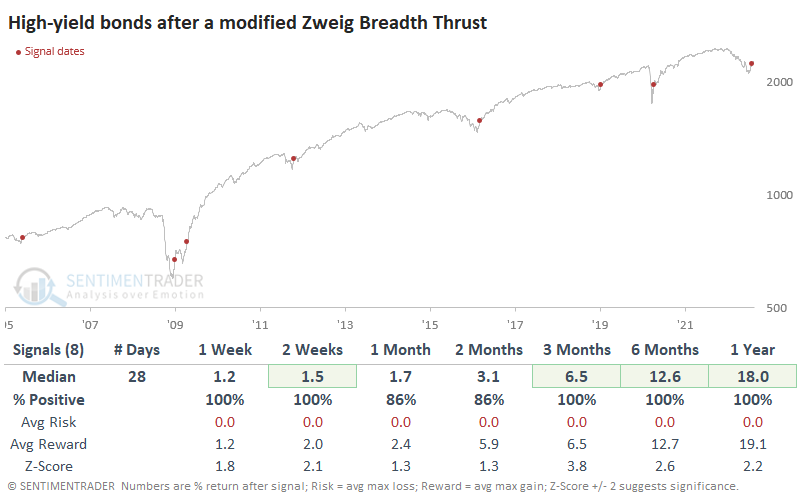
Buyers continued to show interest in the market (well, except for the last week), and so far the latest signal is showing gains. After some recent losses, the 10-day ema of the A/D Line has moved back below 50%. Anytime that indicator went from above 61.5% to below 50%, gains also followed.
As a result of the internal momentum, the McClellan Oscillator for high-yield is coming down off a record high. The Backtest Engine shows that the few times it exceeded +90, HYG fell back over the next month then rallied. The record high in the Oscillator powered the long-term Summation Index above +500 after what had been a record low. Again, history is limited here, but the only comparison is the immediate aftermath of the global financial crisis. After that first surge in the Summation Index, HYG fell back to test its low, which marked the bottom.
One thing that absolutely needs to change is the dominance of 52-week lows over 52-week highs among junk bonds. There was some improvement early last week, but it's back to being a negative spread, and that is not what we see in healthy markets.
More relief in gas prices on the way?
Energy prices soared following the 2020 Covid lows. Nevertheless, crude oil and unleaded peaked in June 2022 and have been trending lower. Seasonality suggests a strong possibility that the price of gasoline is headed lower still.
Unleaded gas futures are a highly cyclical market. Demand tends to ramp up as the first half of the calendar year progresses. Demand then slows as summer heads into fall. Finally, demand falls off drastically as the winter months approach. The typically annual pattern for price reflects this cyclical demand.
The chart below displays the Annual seasonal trend for unleaded gas futures and highlights the two key periods for gasoline traders. The sharp falloff in price in the year's second half is unmistakable.
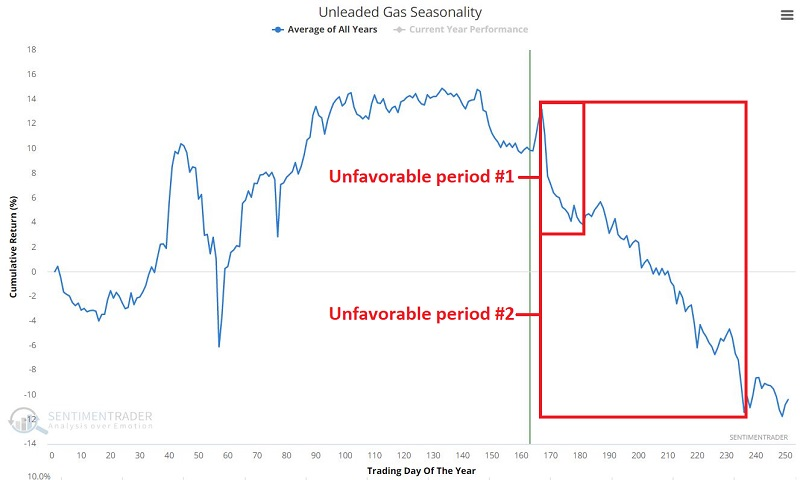
For 2022, unfavorable period #2 extends from the close on 2022-08-24 through the close on 2022-11-16. The chart below displays the cumulative $ gain/loss for unleaded gas futures only during this seasonally unfavorable period.
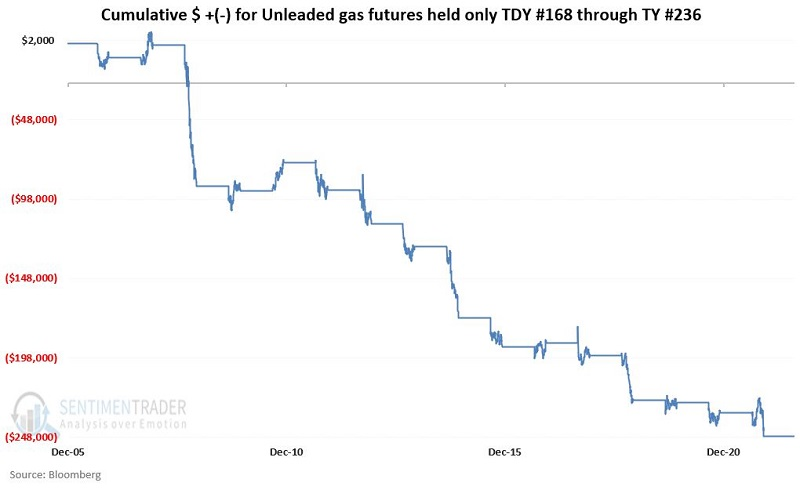
This seasonal window showed a gain only 3 times versus a loss 13 times. Every performance metric was skewed to the downside, suggesting that even when gas rallied, it tended to be weak relative to the losses suffered during down years.
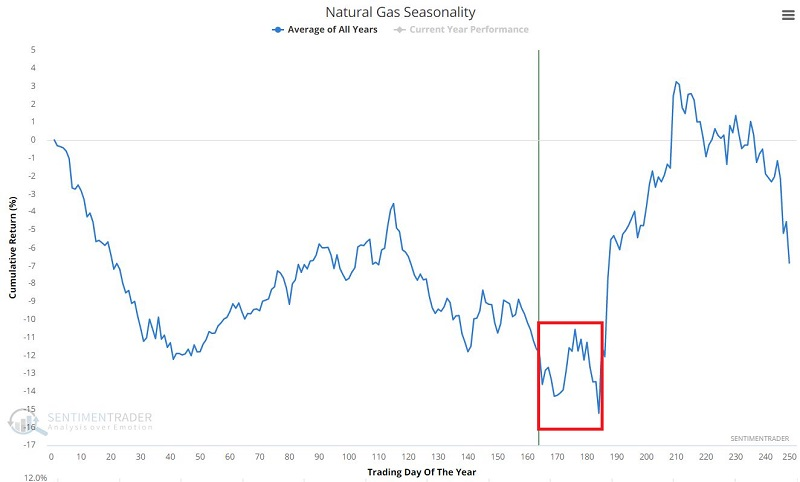
Similarly, Jay showed that natural gas recently formed a potential double top, our Optimism Index recently reached a frothy level, and natural gas remains in a slightly unfavorable seasonal trend for another month
The chart below displays the annual seasonal trend for natural gas futures. So far in 2022, natural gas has not followed its annual seasonal trend too closely, so we don't want to put too much weight on this factor. Nevertheless, the fact remains that the seasonal trend is unfavorable for roughly another month.
One way to play might be to sell short natural gas futures. However, selling short involves much leverage and theoretically unlimited risk. Instead, we could look at trading options on ticker UNG (United States Natural Gas ETF).
The example trade we will consider is an out-of-the-money bear call credit spread (shown for educational purposes only).
- Buy 1 UNG Sep16 2022 37 call @ $1.17
- Sell 1 UNG Sep16 2022 35 call @ $1.63
Some notes:
- The cost to enter a 1-lot is $154
- The maximum risk on a 1-lot is $154 and would only be realized if we held the trade until expiration and UNG is above $37 a share at that time
- The maximum profit potential is $46 (or 29.9% of capital at risk) and would be realized if we held the trade until expiration and UNG is below $35 a share at expiration
The bottom line is that this trade is a bet that natural gas (using UNG as a proxy) will not rally much beyond the latest high during the next 3+ weeks. However, entering an options trade is only half the battle. The other half is creating a plan for exiting the trade with a profit or a loss.
Coffee is on a caffeine kick
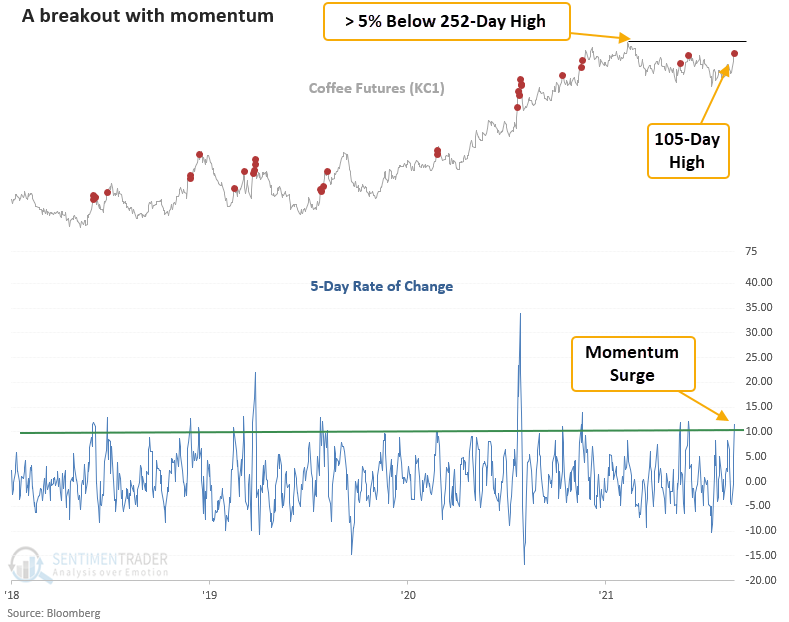
Coffee futures rallied more than 10% over the past 5 sessions and also closed at a 105-day high, but it remains below its one-year high. Dean showed that after similar setups, one should be mindful of a potential bull trap.
Let's use history as a guide to see if we should buy the momentum breakout in coffee. Dean identified when the 5-day rate of change for coffee increases by 10% or more and the commodity simultaneously closes at a 105-day high, which is the case now. it also has to be more than 5% from a 252-day high, a condition similar to now.
Buying a momentum breakout in coffee under conditions similar to now looks unfavorable across most short and medium-term time frames. If the commodity deviates from history, the next couple of weeks should provide us with a clue. Strong momentum in the first two weeks for signals in 1975, 1979, and 2014 led to more upside.
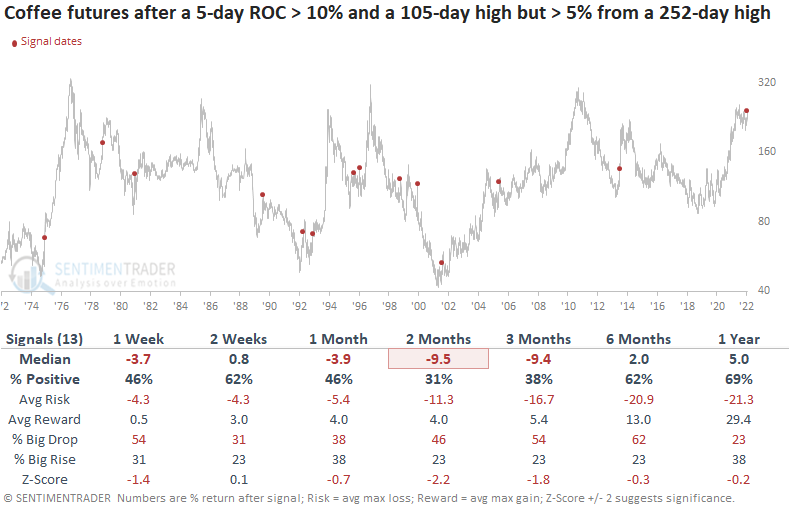
In addition, the 2-year rolling return exceeded 150% for only the 4th time in almost 50 years. Previous multi-year surges suggest the commodity is closer to the end of an uptrend versus the beginning of one.
About TradingEdge Weekly...
The goal of TradingEdge Weekly is to summarize the research published to SentimenTrader over the past week. Sometimes there is a lot to digest and this summary is meant to highlight the highest conviction or most compelling ideas we discussed. This is NOT the full research that's published, rather it pulls out some of the most relevant parts. It includes links to the published research for convenience; if you don't subscribe to those products it will present the options for access.