
Trading With Market Studies In 2019

Looking at quantified market studies proved effective again in 2019.
Studying the studies
Near the end of the past several years, we’ve been taking some time to review studies that were closed during the year.
For every study that has a solid conclusion, we track it in the Active Studies. To remain accountable and transparent, after the studies’ effective time frames have passed, we go back and rate them based on whether they were a good guide or not, and they then show up in the Archived Studies. If the way we look at markets isn’t helpful on a consistent basis, then we need to change.
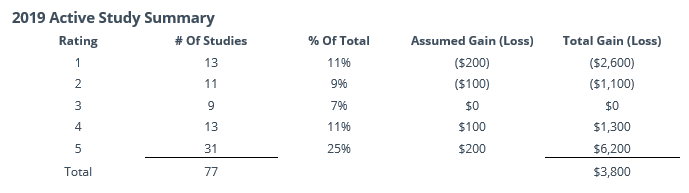
Using an extremely conservative grading procedure, the studies have continued to show a positive expectation. The ratings are based on how the indicated market performed over the time frame that was most consistent in the study. They range from 1 to 5 stars.
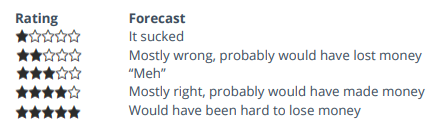
As we did last year, here is a breakdown of the study results for this year. The results from last year were good and were even better than indicated in the report because there were 18 studies that weren’t yet graded (they were still active at the time) and almost all of them ended up being rated 5 stars.
Granted, it’s not a trading system and would be hard or impossible to implement if it was. It’s just a shorthand way of trying to determine if the studies have been helpful over the years. As long as the expectation is positive, we think there’s value in this way of looking at markets.
We also track the number of studies over the past 5 days, netting them out between those with a bullish minus bearish outlook on stocks. Even if they have a long-term effective time frame, when this net number has been at either extreme, it’s been a good indicator for shorter-term returns.
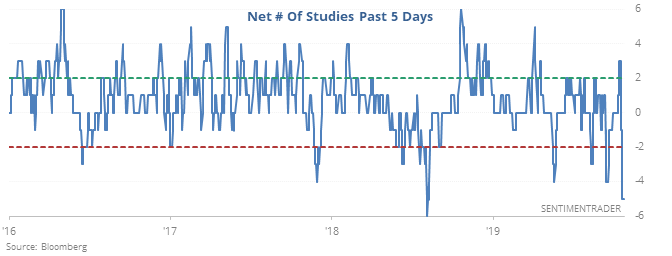
When the net was -2 or worse, as it is now, then the S&P had great difficulty rallying. This is especially notable given that 2017 was a big part of the study period, and it was rare to see any weakness at all that year. This is a warning as we head into 2020.
The good
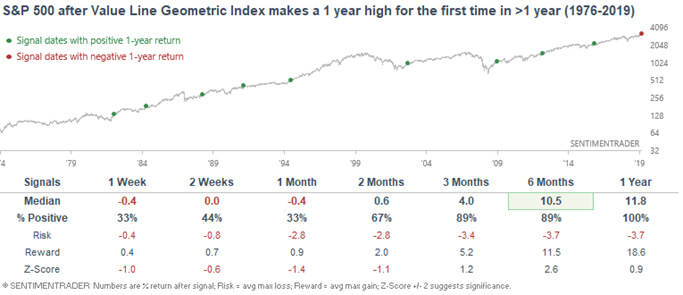
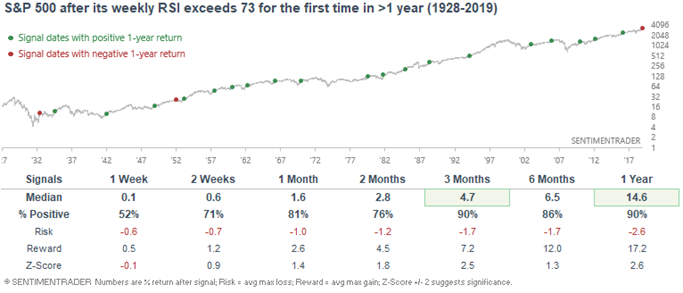
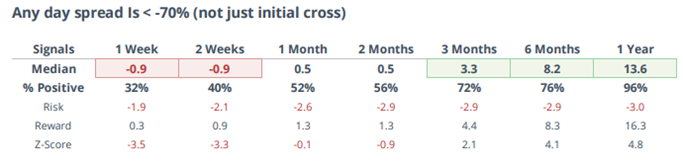
Heading into the New Year, the best signs are due to persistent momentum. When there are broad signs of momo at work, it tends to be good for longer-term returns. We see evidence of that in some breadth statistics, as well as extremely broad U.S. and even overseas indexes.
Just a couple of examples...
The bad
Shorter-term, the historically extreme optimism has a strong record at preceding weak or outright negative returns up to 1-3 months later, and as those indicators and studies have piled up, the net number of studies has turned decidedly negative. That has led to one of the worst spreads ever between Smart Money and Dumb Money Confidence.
This is an abridged version of our recent reports and notes. For immediate access with no obligation, sign up for a 30-day free trial now.
We also looked at:
- The S&P 500's shorter-term average won't stop rising
- The high-low ratio is the highest since February
- What happens to stocks when the Fed's balance sheet spikes
- Copper has rallied for 6 straight weeks
- Our weekly fundamental indicator overview