Data &
Technology
Research
Reports
Report Solutions
Reports Library
Actionable
Strategies
Free
Resources
Simple Backtest Calculator
Simple Seasonality Calculator
The Kelly Criterion Calculator
Sentiment Geo Map
Public Research Reports
Free Webinar
Pricing
Company
About
Meet Our Team
In the News
Testimonials
Client Success Stories
Contact
Log inLoginSign up
< BACK TO ALL REPORTS

Trading the S&P 1500 2-day RSI % below 30 indicator

Eric D. Brown
2017-04-19
null

A few months ago we added a few indicators based on how many components of the S&P 1500 have RSI values below 30 and above 70.   You can find these indicators here:

  • % S&P 1500 RSI 2-day > 70
  • % S&P 1500 RSI 2-day < 30
  • % S&P 1500 RSI 14-day > 70
  • % S&P 1500 RSI 14-day < 30

This morning, I took at a look at the % S&P 1500 RSI 2-day < 30 indicator to see if I could build an interesting strategy with it. Turns out, my 'simple extreme buy/sell' approach that I've shared a number of times before works pretty well.

Strategy Description

  • Trading vehicle: S&P 500 ETF (SPY)
  • Start Date: Jan 3 2005
  • End Date: April 17 2017
  • Initial Cash: $100,000
  • No margin
  • Commission is $0.01 per share
  • Entry rules:

    • Buy when the % S&P 1500 RSI 2-day < 30 is >= 70% (meaning that 70% of S&P 1500 components have a 2-day RSI less than 30).
    • The day after a buy signal is given, buy at the open with a market order
    • Each position is "all-in", meaning we buy as much as our cash balance allows
    • No stop

  • Exit rules:

    • Sell when the % S&P 1500 RSI 2-day > 70 indicator is >= 50% (meaning that 50% of S&P 1500 components have a 2-day RSI greater than 70). While the 'extreme' of this indicator is 70%, I chose 50% as a means to try to remove get out of the position before any large selloff might occur.
    • The day after a sell signal is given, sell at the open with a market order

Strategy Results

  • Annual Return is 6.54%
  • There were 72 total trades with 79% of those trades profitable.
  •  The average time-in-trade is 8 days with the median time-in-trade is 7 days.
  • Average return of each trade is 1.06%. Median return of each trade is 1.50%
  • The backtest was run over 124 months with 28 months left out for out-of-sample testing.

The out-of-sample performance isn't quite as good as the in-sample performance , which I suspect has to do with volatility during this time-frame (but would be open to other interpretations).

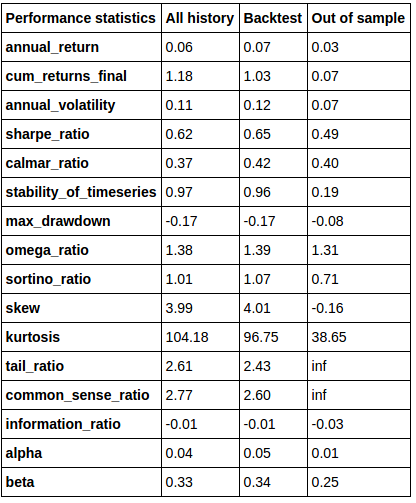
Additional trade stats/charts provided below. The annual return values in Table 1 are decimal values, rather than %'s - multiple by 100 to get actual annual return %'s.

[caption id="attachment_1216" align="aligncenter" width="416"]Performance Statistics Table 1: Performance Statistics (decimal values, not percentages)[/caption]

[caption id="attachment_1217" align="aligncenter" width="600"]Drawdown Information 
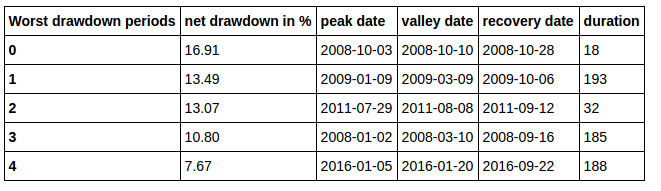
Table 2: Drawdown Information[/caption]

[caption id="attachment_1218" align="aligncenter" width="600"]Performance Charts 
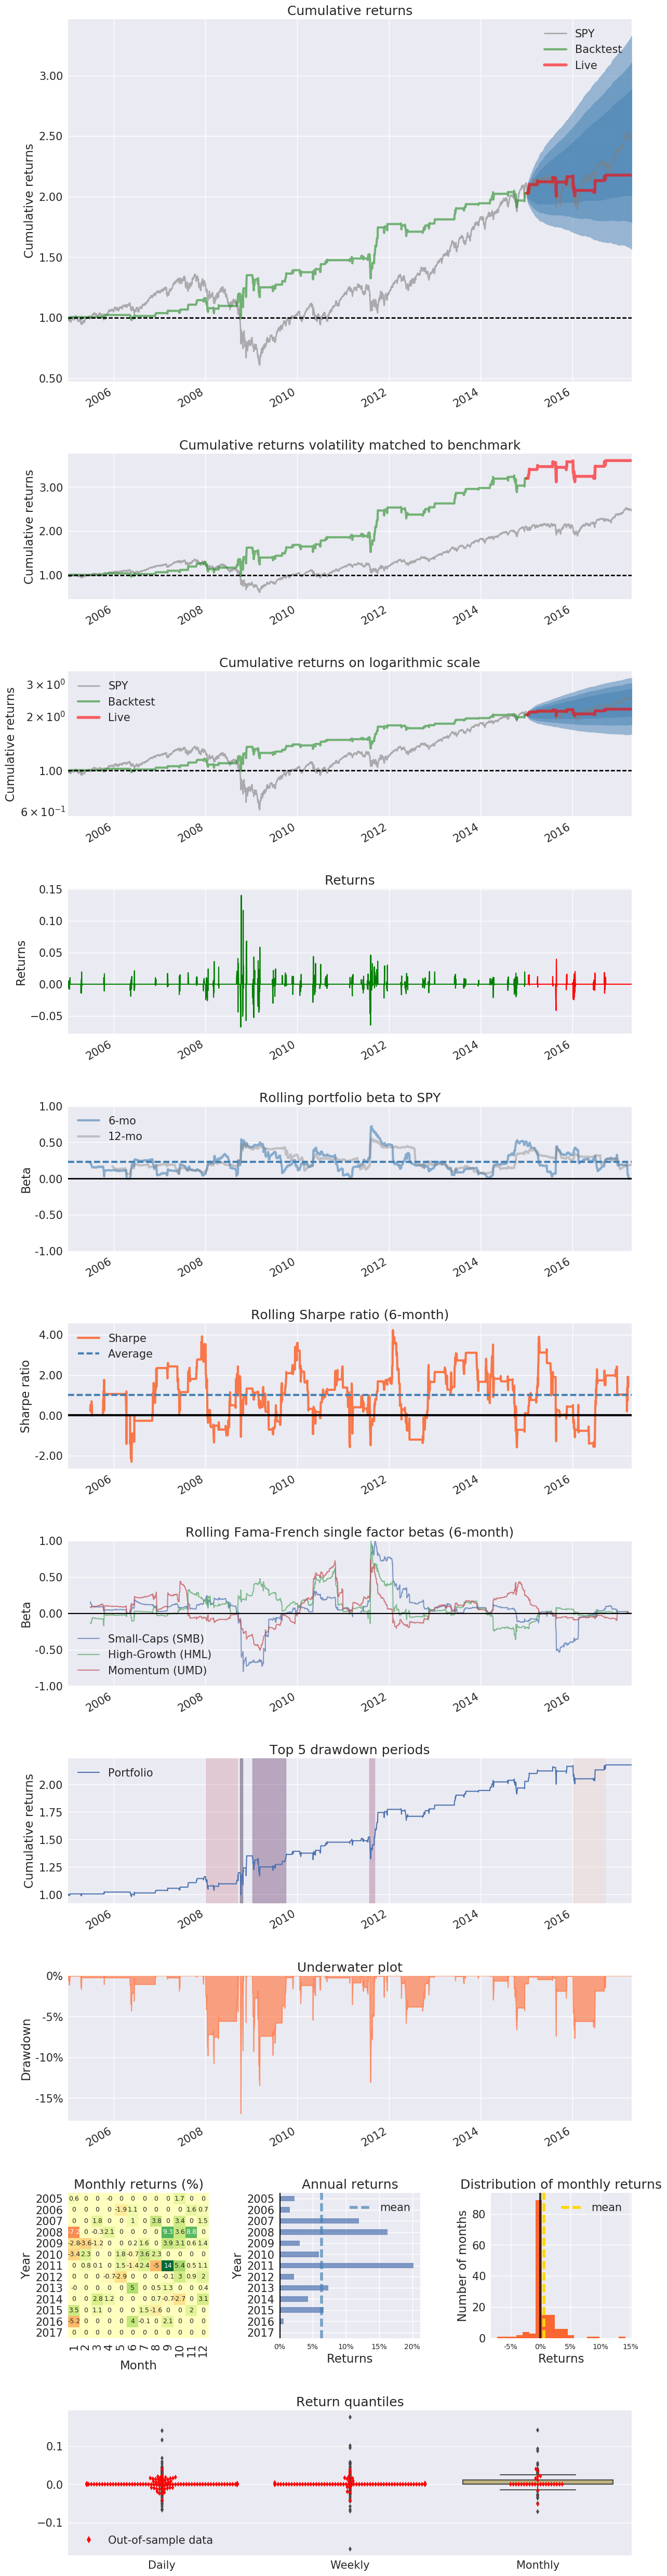
Figure 1: Performance Charts[/caption]

Sorry, you don't have access to this report

Upgrade your subscription plan to get access
Go to Dasboard
DATA &
TECHnologies
IndicatorEdge
‍
BackTestEdge
‍
Other Tools
‍
DataEdge API
RESEARCH
reports
Research Solution
‍
Reports Library
‍
actionable
Strategies
Trading Strategies
‍
Smart Stock Scanner
‍
FREE
RESOUrCES
Simple Backtest
Calculator
Simple Seasonality
Calculator
The Kelly Criterion
Calculator
Sentiment Geo Map
‍
Public Research Reports
‍
Free Webinar
COMPANY
‍
About
‍
Meet our Team
‍
In the News
‍
Testimonials
‍
Client Success Stories
Pricing
Bundle pricing
‍
Announcements
‍
FAQ
© 2024 Sundial Capital Research Inc. All rights reserved.
Setsail Marketing
TermsPrivacyAffiliate Program
Risk Disclosure: Futures and forex trading contains substantial risk and is not for every investor. An investor could potentially lose all or more than the initial investment. Risk capital is money that can be lost without jeopardizing ones’ financial security or life style. Only risk capital should be used for trading and only those with sufficient risk capital should consider trading. Past performance is not necessarily indicative of future results.

Hypothetical Performance Disclosure: Hypothetical performance results have many inherent limitations, some of which are described below. No representation is being made that any account will or is likely to achieve profits or losses similar to those shown; in fact, there are frequently sharp differences between hypothetical performance results and the actual results subsequently achieved by any particular trading program. One of the limitations of hypothetical performance results is that they are generally prepared with the benefit of hindsight. In addition, hypothetical trading does not involve financial risk, and no hypothetical trading record can completely account for the impact of financial risk of actual trading. for example, the ability to withstand losses or to adhere to a particular trading program in spite of trading losses are material points which can also adversely affect actual trading results. There are numerous other factors related to the markets in general or to the implementation of any specific trading program which cannot be fully accounted for in the preparation of hypothetical performance results and all which can adversely affect trading results.

Testimonial Disclosure: Testimonials appearing on this website may not be representative of other clients or customers and is not a guarantee of future performance or success.