Data &
Technology
Research
Reports
Report Solutions
Reports Library
Actionable
Strategies
Free
Resources
Simple Backtest Calculator
Simple Seasonality Calculator
The Kelly Criterion Calculator
Sentiment Geo Map
Public Research Reports
Free Webinar
Pricing
Company
About
Meet Our Team
In the News
Testimonials
Client Success Stories
Contact
Log inLoginSign up
< BACK TO ALL REPORTS

Traders are showing get-me-out behavior

Jason Goepfert
2020-02-27
This week,, we've seen a level of selling pressure that has rarely been matched. Fewer than half of S&P 500 stocks are above their 200-day average.

No bid

The first two sessions of the week saw an almost ‘no bid’ situation. Fewer than 10% of securities on the NYSE managed to rise either day and there was (almost) less than 10% of volume flowing into the stocks that did manage to rise. Over the past 60 years, there haven’t been many one-two punches like this.

Even on Friday, there were bouts of get-me-out selling. The average TICK reading at the lowest point over the past three sessions has been below -1500, more than 50% of issues on the NYSE.

The TICK shows the number of stocks that last traded on an uptick minus those that last traded on a downtick. Anything beyond +/- 1000 can be considered extreme.

NYSE TICK

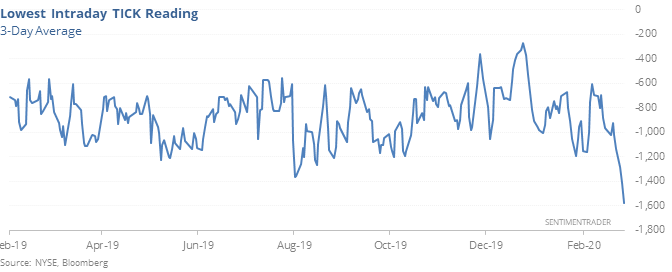
Going back to 1990, there have been a handful of days when the 3-day average of the lowest TICK reading of the day exceeded -1500. Because the number of issues changes over time, we also looked at dates when the average was at least -50% of total issues (over the past 3 days, it was -52% of issues). This kind of selling has led to consistent upside over the medium-term.


Fewer uptrends

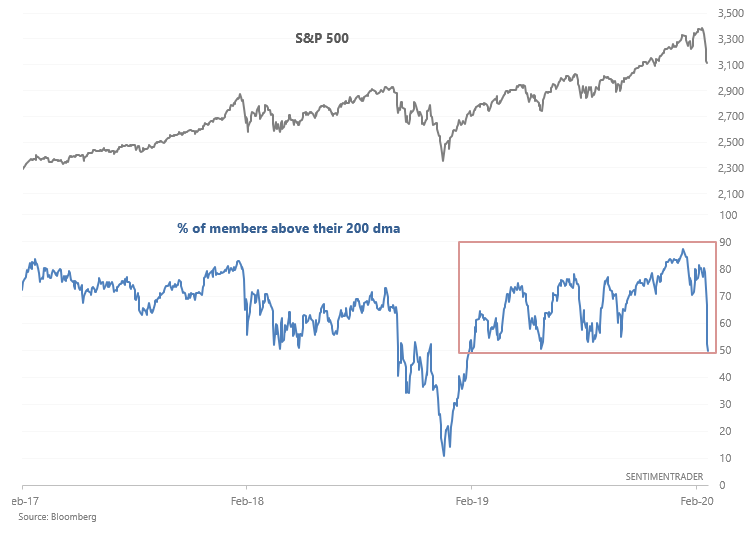
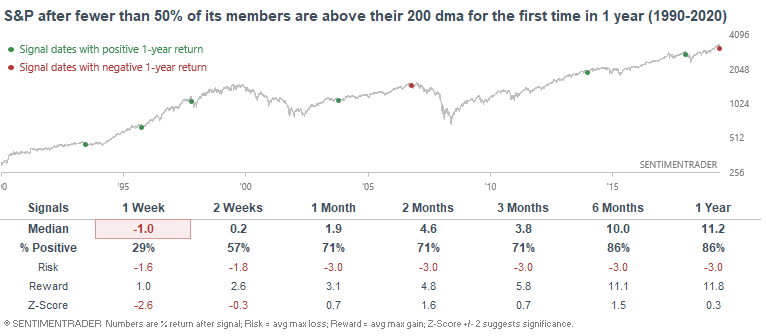
With the heavy selling over the past few sessions, fewer than 50% of the S&P 500's members are above their 200 day averages for the first time in more than a year.

When other long uptrends were broken, the S&P often faced weakness over the next week but that's about as long as it tended to last. By a month later, most were higher.


This is an abridged version of our recent reports and notes. For immediate access with no obligation, sign up for a 30-day free trial now.

We also looked at:

  • What happens after 2-day bouts of 90% down days (issues and volume)
  • Optimism on safe-haven assets like gold and bonds is very high
  • New home sales are surging
  • What happens after 5 straight down days after an all-time high
  • There has been a big surge in oversold stocks
  • Our CNN Fear & Greed proxy model is showing extreme pessimism already
  • Optimism on bonds is extreme
DATA &
TECHnologies
IndicatorEdge
‍
BackTestEdge
‍
Other Tools
‍
DataEdge API
RESEARCH
reports
Research Solution
‍
Reports Library
‍
actionable
Strategies
Trading Strategies
‍
Smart Stock Scanner
‍
FREE
RESOUrCES
Simple Backtest
Calculator
Simple Seasonality
Calculator
The Kelly Criterion
Calculator
Sentiment Geo Map
‍
Public Research Reports
‍
Free Webinar
COMPANY
‍
About
‍
Meet our Team
‍
In the News
‍
Testimonials
‍
Client Success Stories
Pricing
Bundle pricing
‍
Announcements
‍
FAQ
© 2024 Sundial Capital Research Inc. All rights reserved.
Setsail Marketing
TermsPrivacyAffiliate Program
Risk Disclosure: Futures and forex trading contains substantial risk and is not for every investor. An investor could potentially lose all or more than the initial investment. Risk capital is money that can be lost without jeopardizing ones’ financial security or life style. Only risk capital should be used for trading and only those with sufficient risk capital should consider trading. Past performance is not necessarily indicative of future results.

Hypothetical Performance Disclosure: Hypothetical performance results have many inherent limitations, some of which are described below. No representation is being made that any account will or is likely to achieve profits or losses similar to those shown; in fact, there are frequently sharp differences between hypothetical performance results and the actual results subsequently achieved by any particular trading program. One of the limitations of hypothetical performance results is that they are generally prepared with the benefit of hindsight. In addition, hypothetical trading does not involve financial risk, and no hypothetical trading record can completely account for the impact of financial risk of actual trading. for example, the ability to withstand losses or to adhere to a particular trading program in spite of trading losses are material points which can also adversely affect actual trading results. There are numerous other factors related to the markets in general or to the implementation of any specific trading program which cannot be fully accounted for in the preparation of hypothetical performance results and all which can adversely affect trading results.

Testimonial Disclosure: Testimonials appearing on this website may not be representative of other clients or customers and is not a guarantee of future performance or success.