
Top sectors during the heart of the election cycle

Key points:
- The upcoming ten-month period starting October 1st is the most favorable portion of the 48-month election cycle
- Specific sectors have demonstrated a tendency to perform better than others during these ten months
- These sectors have also tended to outperform the overall market
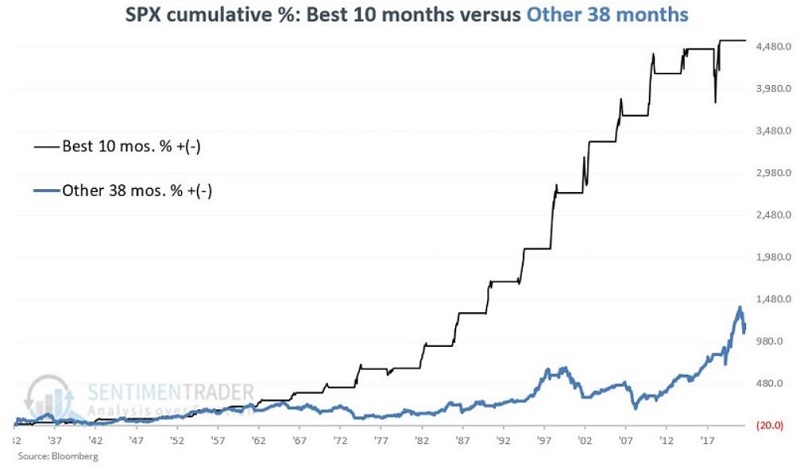
The best ten months of the election cycle
Last week, I highlighted the stock market's performance during the most favorable ten-month period within the 48-month election cycle. This ten-month period encompasses October of each mid-term election year through July of the following (pre-election) year.
While results have not always been wildly profitable, 21 of the 22 cycles (including the last 20) have seen the S&P 500 Index gain during this period.
Focusing on sectors
The method I used for selecting five sectors out of the eleven S&P 500 sectors is detailed below. For the record, yes, these selections were made with the benefit of hindsight and represent hypothetical and not real-time results.
I calculated the ten-month return for each S&P 500 sector index for October of each mid-term year through July of each pre-election year starting in 1934. For each sector, I performed the following calculations:
A = Average favorable ten-month cycle return
B = Median favorable ten-month cycle return
C = Standard deviation of all favorable ten-month cycle returns
D = A / C
I then ranked each sector for Variable A, B, and D and summed the ranks. Lower scores are better. The table below displays the values for each sector.
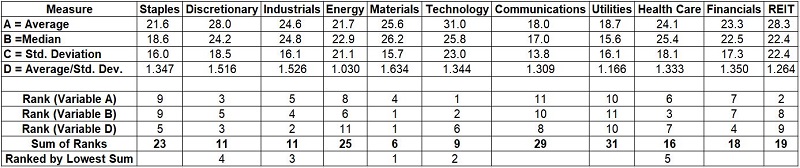
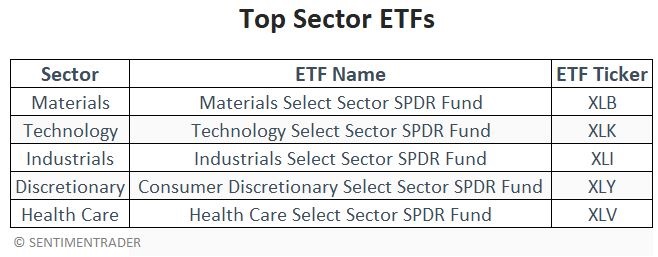
From the table above, we find the Top 5 sectors for this favorable ten-month period are:
- Materials
- Technology
- Industrials
- Discretionary
- Health Care
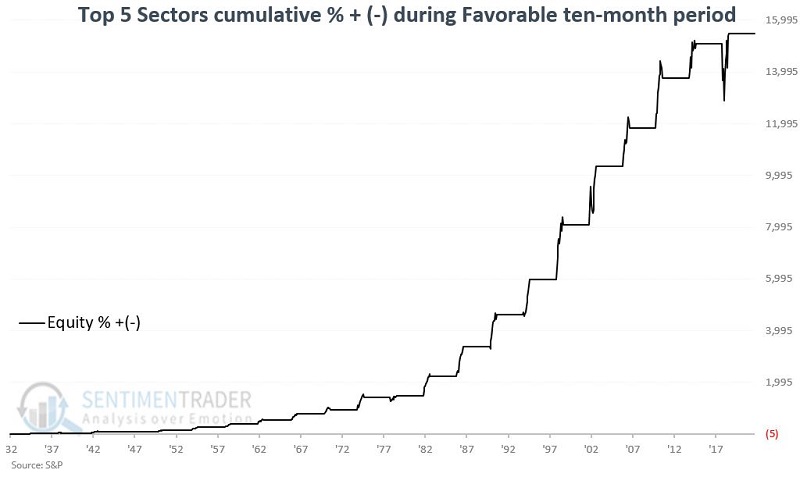
Let's consider the historical performance of these five sectors if held only during the favorable ten-month period. At the close of September during the mid-term election year, we assume each sector holds 20% of a hypothetical portfolio.
The chart below displays the cumulative return for this five-sector portfolio held only during the favorable ten-month period every four years.
Top sectors versus S&P 500 Index
The black line in the chart below displays the same cumulative return for this five-sector portfolio held only during the favorable ten-month period every four years. The blue line shows the cumulative return for holding the S&P 500 Index only during this period.
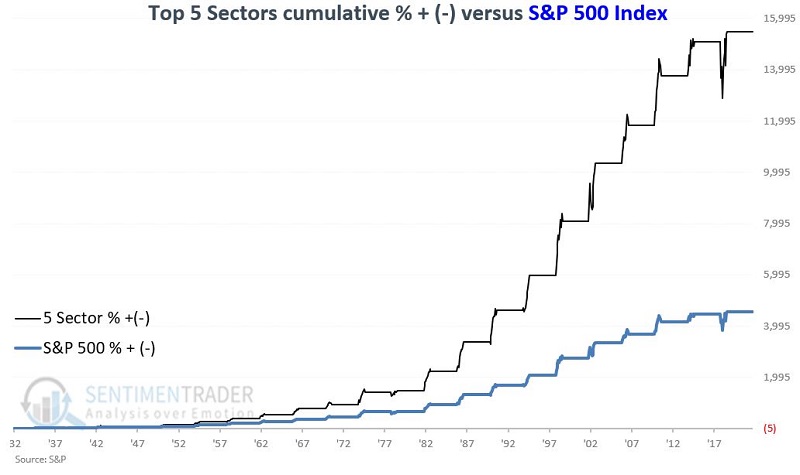
The chart below displays the cumulative return for the Top sectors relative to the cumulative return for the S&P 500 Index.
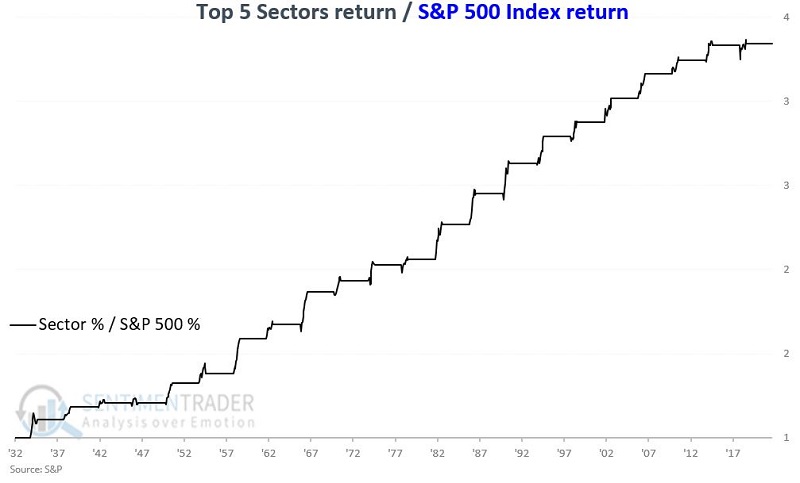
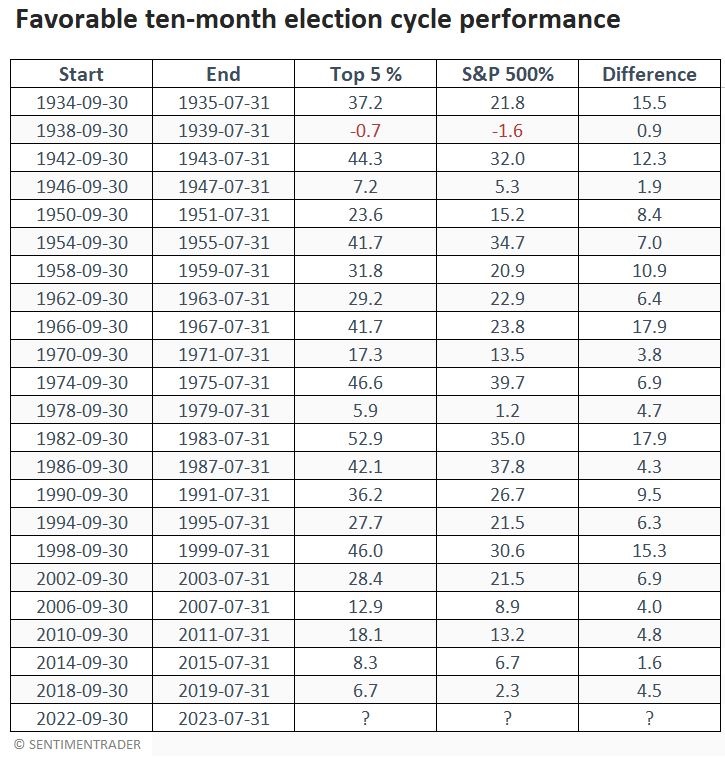
The table below displays the hypothetical cycle-by-cycle returns for the Top 5 sector portfolio versus the S&P 500 Index held only during the dates indicated in the two left-hand columns. They outperformed the S&P during every cycle.
Trading the portfolio
While the above strategy is for informational purposes only and not a recommendation, for those interested in digging deeper, let's consider how to trade the portfolio detailed. The most straightforward approach would be to trade SPDR ETFs designed to track the sector indexes used in the tests above.
What the research tells us…
The stock market has demonstrated a historical tendency to advance from October of a mid-term year through July of a pre-election year. It appears that specific sectors have also consistently tended to outperform the S&P 500 Index during this period.
There are several important caveats to remember: First, as with any seasonal trend, there is no guarantee that market results will be favorable from October 2022 through July 2023. Secondly, it should be remembered that sector performance was analyzed with the benefit of hindsight.