Timing A Move Out Of Stocks, As They Whip Around And Bond Spreads Blow Out

This is an abridged version of our recent reports and notes. For immediate access with no obligation, sign up for a 30-day free trial now.
Bond blowout
The riskiest segment of the corporate bond market has been suffering, while safer bonds have been less of a focus for sellers.
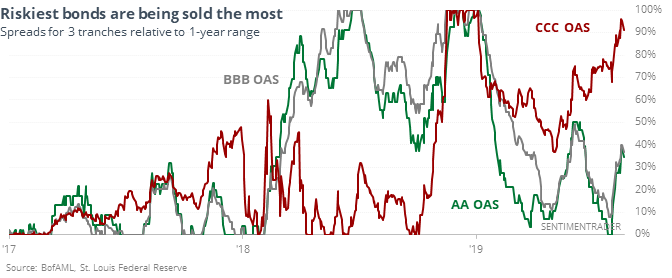
That raises the specter that some of the most economically sensitive investors in the market are seeing warning signs and getting out early. They haven’t been a consistent group to follow. The four times it happened, stocks rallied over the next two months three times, one of which rolled over into large losses. The one that showed a loss a couple of months later turned into a gain.
A whippy few weeks
The S&P 500 has endured a daily change of more than 0.75% for most of the past 15 sessions. That’s not an unusual amount of volatility during a bear market, but it is a high level when relatively near a high.
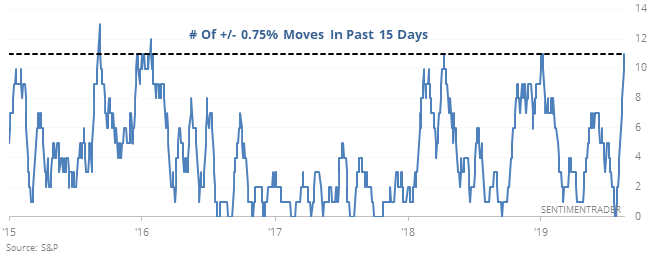
This did happen as stocks were forming a major top in 1929, 2000, and 2007, but it failed to lead to a large decline far more often. And even when we did see this kind of volatility cluster those years, the S&P still managed to rise over the next month each time.
A leading new high
The Conference Board Leading Economic Index - a popular leading economic indicator for the U.S. economy - has made a new all-time high.
One way to judge the Conference Board LEI's trend is to look at its 6 month moving average, and whether this average is going up or down.
The following chart looks at:
S&P 500
1. Buy and hold the S&P 500 if the Conference Board LEI is going up. Otherwise, sell and shift into cash.
2. Buy and hold the S&P 500 if the Conference Board LEI is going up. Otherwise, sell and shift into the Bloomberg Barclays U.S. Aggregate Bond Index
3. Buy and hold the S&P 500 if the Conference Board LEI is going up. Otherwise, sell and shift into the Bloomberg Barclays U.S. Corporate Bond Index
4. Buy and hold the S&P 500 if the Conference Board LEI is going up. Otherwise, sell and shift into the Bloomberg Barclays U.S. Treasury Bond Index
5. Buy and hold the S&P 500 if the Conference Board LEI is going up. Otherwise, sell and shift into gold.

With the Conference Board LEI making new highs, this strategy remains a BUY right now (Conference Board LEI's 6 month average is going up).
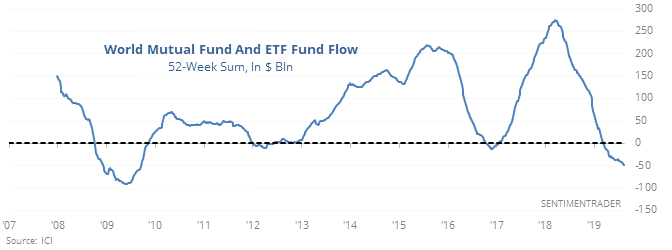
World exodus
Investors have been selling overseas equities week after week (after week after week…). The selling stretch over the past 3 months is about the most severe since the financial crisis, and it’s even creeping up on that.
Almost perfect
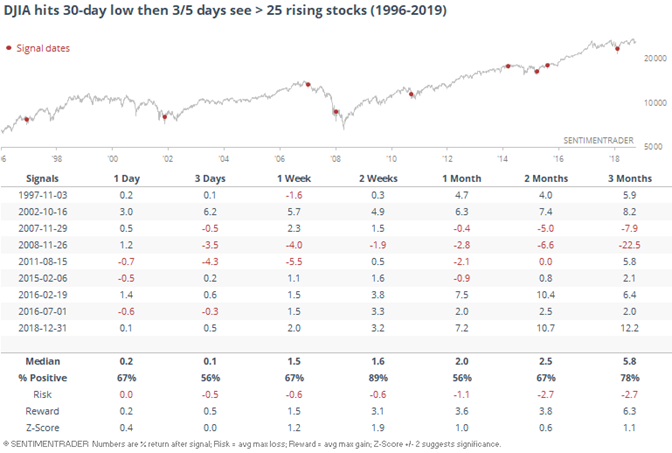
After hitting a 30-day low a week ago, the Dow Industrials Average has seen 3 of the 5 sessions with more than 25 of its members rising on the day. Of the 9 other times that’s happened since 1996, the Dow continued to rise 8 times over the next 2 weeks.