
Time to Keep an Eye on The Economic Surprise Index

The Economic Surprise Index has been getting a lot of attention lately. And for a good reason:
- Since plunging during the Covid crisis in early 2020
- Then soaring in the months immediately thereafter
- The index has been declining steadily for the last 13 months
As of 9/7/2021, the index stood at -59.4. This is significant because it can set the stage for an important signal - one that bears watching in the days and weeks ahead.
The Citigroup Economic Surprise Index:
- Weighs various economic indicators based on their influence on the foreign exchange market when they are released
- Looks at the standard deviation of the actual release of various indicators versus economists' estimates
- Is a three-month average of the raw daily figure
If the Surprise Index is:
- Above zero, it means that economic releases have been coming in better than analysts had estimated
- Below zero, then economic releases have been worse than expected
Let's look at a couple of specific ways to use this index in the stock market.
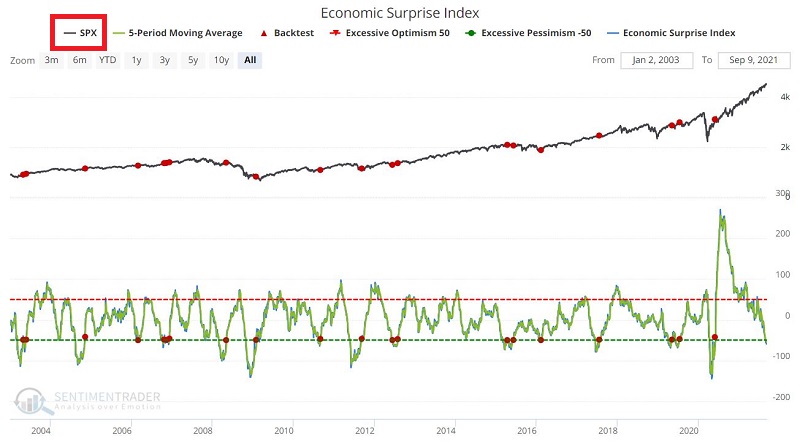
CROSSES ABOVE -50
Let's look first at those occasions when:
- The 5-day average of the Economic Surprise Index
- Has moved from below to above -50
The chart below shows the signals versus the S&P 500 Index, and the table below displays the results.
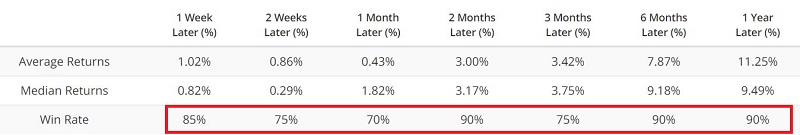
Interestingly (and somewhat oddly):
- The Win Rate % is very high across all time frames
- However, the Median Returns are only so-so
Let's substitute the Nasdaq 100 Index instead. The chart below shows the signals, and the table below displays the results.
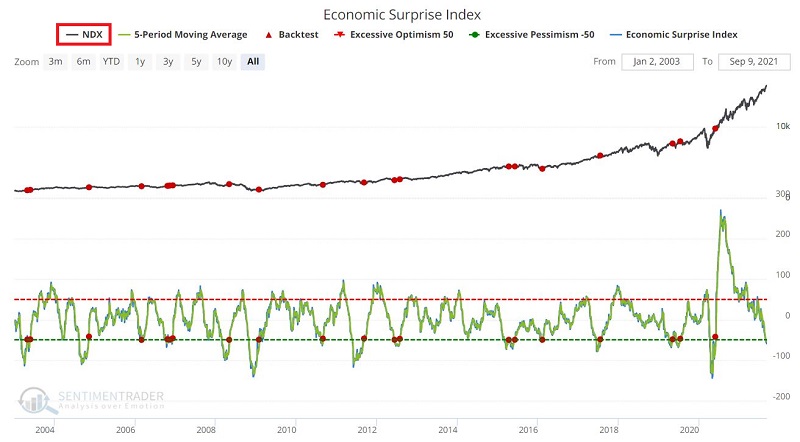
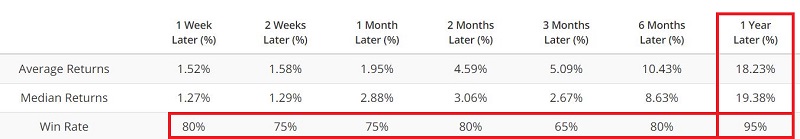
Note that for the Nasdaq 100:
- The 1-year Win Rate is 95%
- The 1-year Median Return is a robust +19.38%
So, if the Economic Surprise Index manages to reverse course and move back above -50, it could set the stage for another up leg in the stock market.
CROSSES ABOVE -101
Of course, there is no guarantee that this index will reverse course and trend higher anytime soon. In fact, it may continue to sink. While this would generally be considered an unfavorable development, it could set the stage for a more powerful positive reversal if it sinks far enough.
Under the category of "Bad News can be Good News," let's look at those occasions when:
- The Economic Surprise Index has moved from below to above -101
The chart below shows the signals versus the S&P 500 Index, and the table below displays the results.
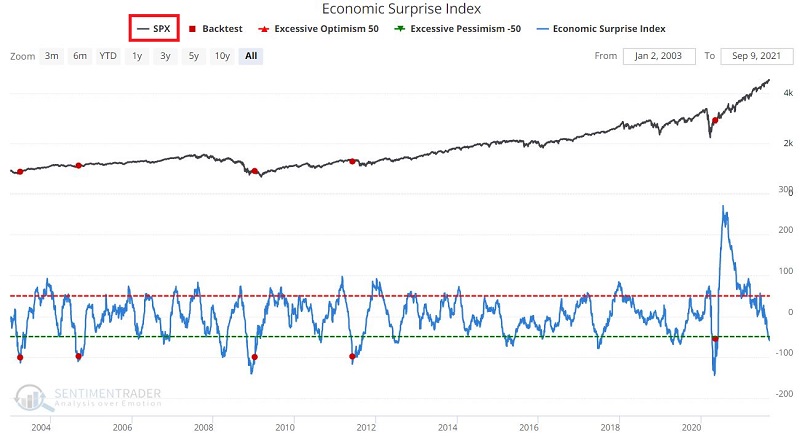
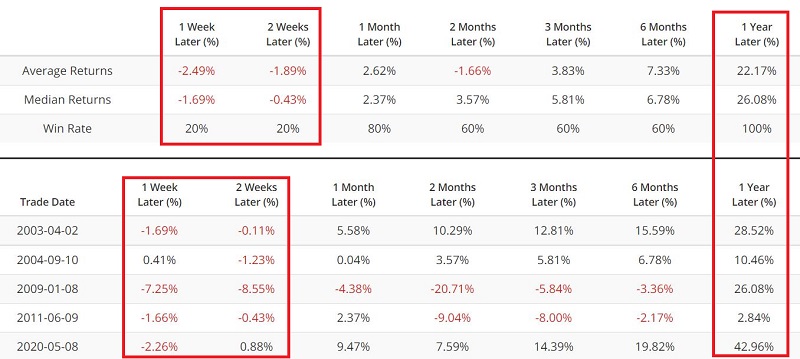
As you can see in the chart above, this signal does not often occur - typically only after some meaningful economic and/or stock market trouble. So small sample size is a concern.
However, the results - limited in number though they may be - are compelling:
- The 1-Year Win Rate % is 100%
- The 1-Year Median Return is +26.08%
It should be noted that the 1 and 2-Week periods after these signals showed weak returns. This could argue for waiting for a week or two after a signal before acting to take a bullish position.
Let's once again run the same test using the Nasdaq 100 Index. The chart below shows the signals, and the table below displays the results.
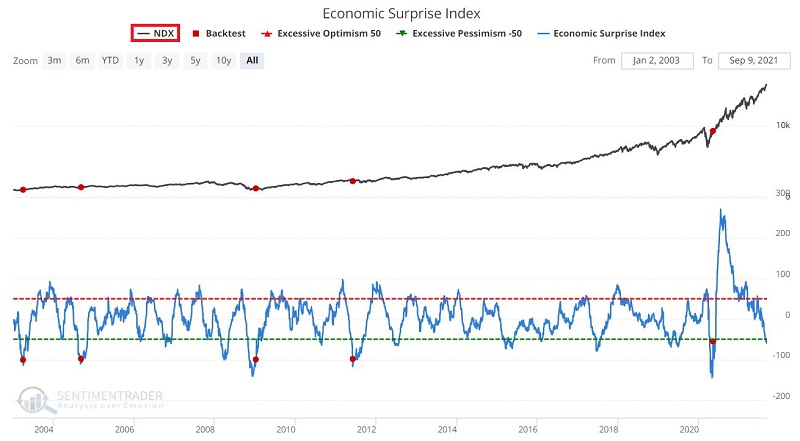
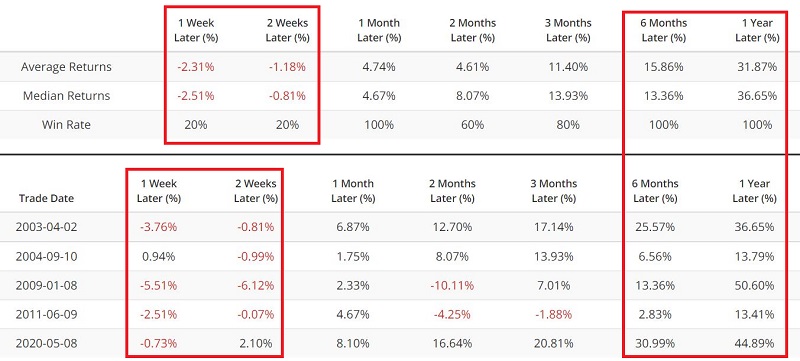
Note that for the Nasdaq 100:
- The 1-Month, 6-Month, and 1-Year Win Rate is 100%
- The 1-year Median Return is a robust +36.65%
Here too, it appears that waiting a week or two before diving in might make sense, as the 1 and 2-Week results mostly show losses.
SUMMARY
Now is the time to start monitoring the Economic Surprise Index closely.
- If it reverses sooner than later and moves back above -50;
- Or if it continues to trend lower below -101 and then crosses back above that level
It could highlight a potential buying opportunity. Likewise, when a signal does ultimately occur - if history is a guide - you may have a week or two to zero in on exactly what you want to buy.