
Time to Keep a Close Eye on the U.S. Dollar

When it comes to the U.S. dollar, too often, the "cycle" goes something like this:
Step #1. In the financial news, the conflicting stories typically fall into one of two categories:
- Those that argue that inflation and debt mean the dollar is doomed to decline
- Those that argue that the Fed will ultimately have to raise interest rates and that higher rates will make the U.S. dollar more attractive relative to other currencies, thus the dollar is destined to rise
Step #2. The average investor weighs these two conflicting theories and decides which they feel is the better argument.
For better or worse, I prefer to look at things I can quantify.
PRICE
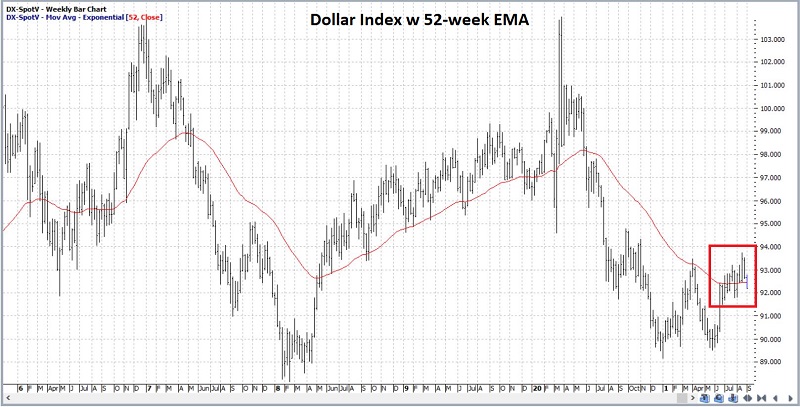
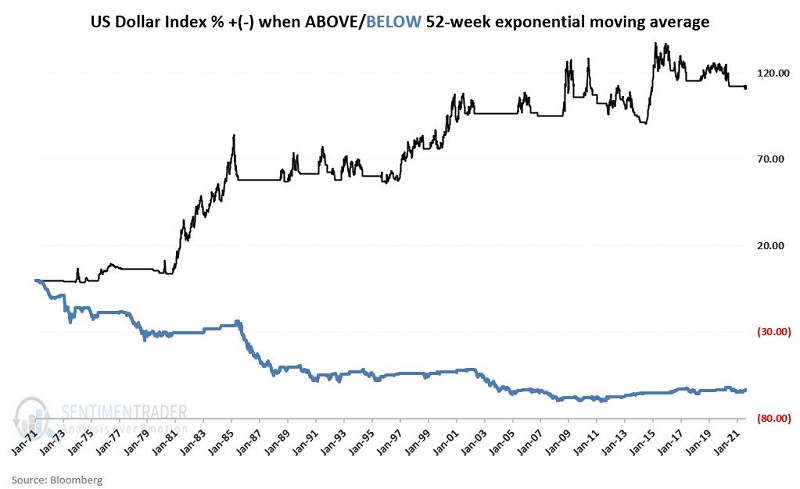
The chart below (courtesy of ProfitSource) displays the U.S. Dollar Index along with its 52-week exponential moving average.
The chart below displays the same index with a longer time frame, highlighting a key support/resistance level.
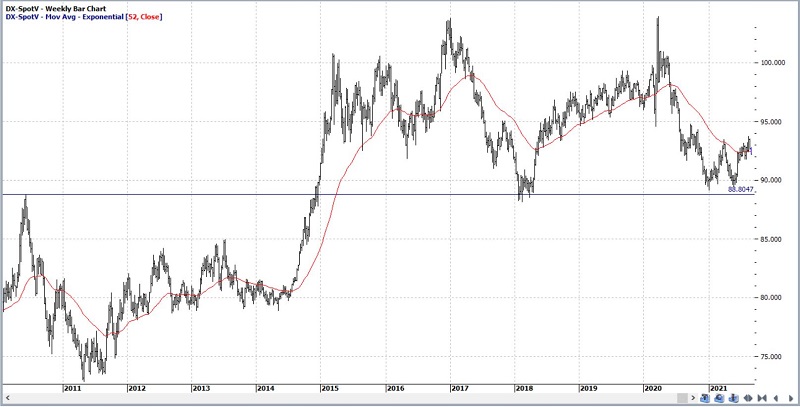
In general, if the U.S. dollar is above its 52-week EMA and above support/resistance near 88.80, this is favorable for the dollar.
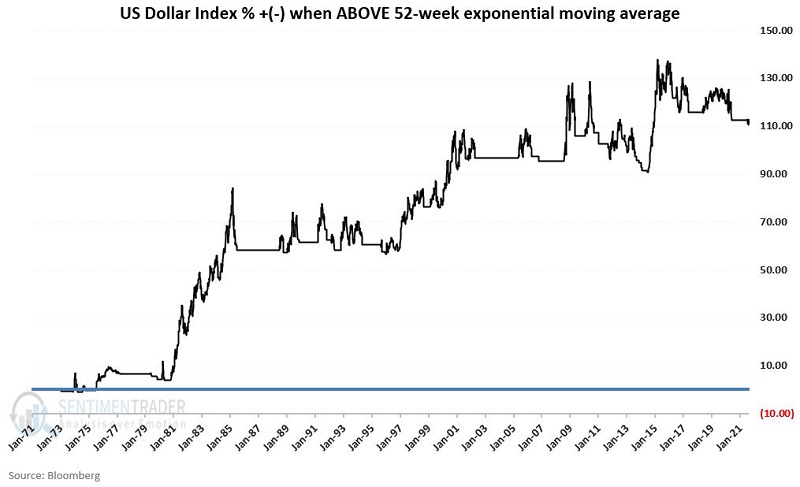
However, this paints a more ominous picture if the price drops below the 52-week EMA (particularly if it drops back below 88.80). To understand why, the chart below displays the cumulative percentage price change for the dollar when it is above its own 52-week exponential average. Since 1969, the cumulative gain has been +111%.
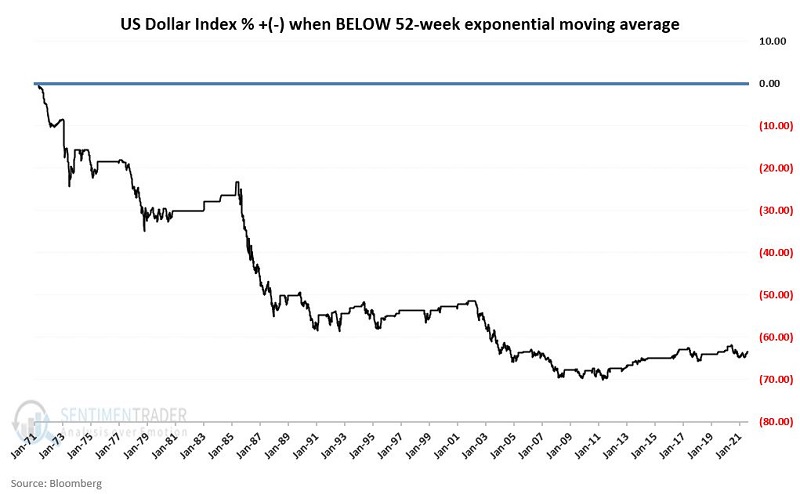
At the other end of the spectrum, the chart below displays the price change for the dollar when it is below its own 52-week exponential moving average. Since 1969, the cumulative loss has been -64%.
To drive home the point, the chart below displays the equity curves above on the same chart.
The bottom line:
- The dollar above its 52-week EMA does not guarantee higher prices
- The dollar below its 52-week EMA does not guarantee lower prices
But if you are looking for an edge, that would appear to be the way to bet. Remember that we are not talking precision market timing and/or automatic buy/sell signals here. The primary point is simply that an edge can be gained merely by paying attention to the price.
CYCLICALITY
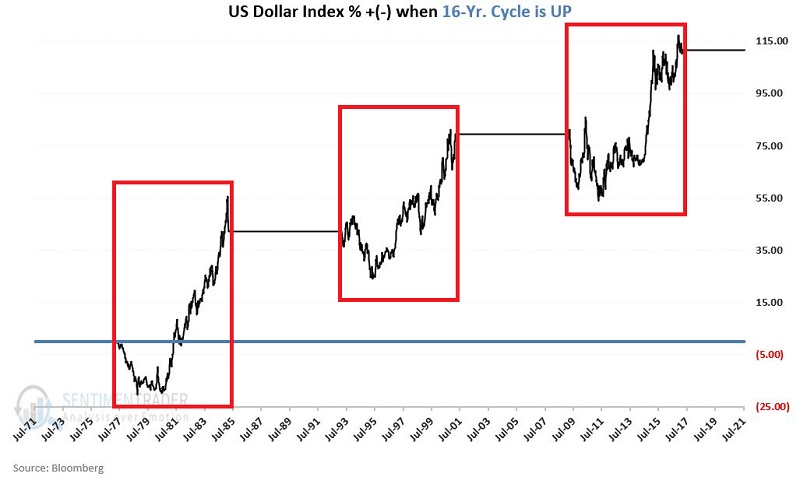
The dollar has tended to move in four-year swings. Once again, we are not talking about picking tops and bottoms with uncanny accuracy. We are merely trying to gain an edge by paying attention to long-term cycles.
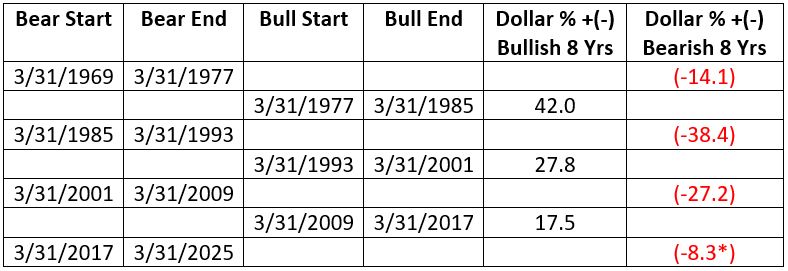
The chart below displays the first four years of price performance (highlighted in the red boxes) in each 8-year period starting on 3/31/1969.
The chart below displays the second four years of price performance (highlighted in the red boxes) in each 8-year period starting in 1969.
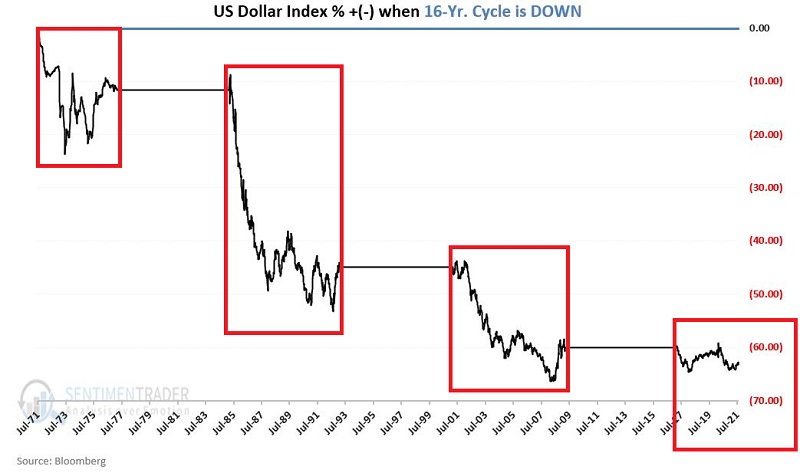
NOTE: The most recent "unfavorable" 4-year period began on 3/31/2021 and extends through 3/21/2025.
Does this mean that the dollar is doomed to fall for the next 3 ½ years? Not at all. Many factors can impact the dollar, and there is nothing magic about cycles. Still, as you saw in the chart above, a cautious approach may be wise unless and until the dollar proves that something else will power it higher in the years ahead.
The table below shows performance for the dollar during each previous "favorable" and "unfavorable" 4-year cycle, as highlighted in the charts above.
COMBINING PRICE AND CYCLICALITY
First, a few caveats:
- Just because the U.S. dollar drops below its 52-week EMA does NOT mean that it will continue to trend lower for any appreciable length of time
- Just because the U.S. dollar is in the "unfavorable" four-year portion of its own 8-year cycle does NOT mean that the dollar is doomed to a relentless decline
With those caveats in mind, the chart below displays the cumulative % price performance for the U.S. dollar ONLY during those times since 1969 when the dollar was below its 52-week EMA and it was within the 4-year "unfavorable" portion of the 8-year cycle.
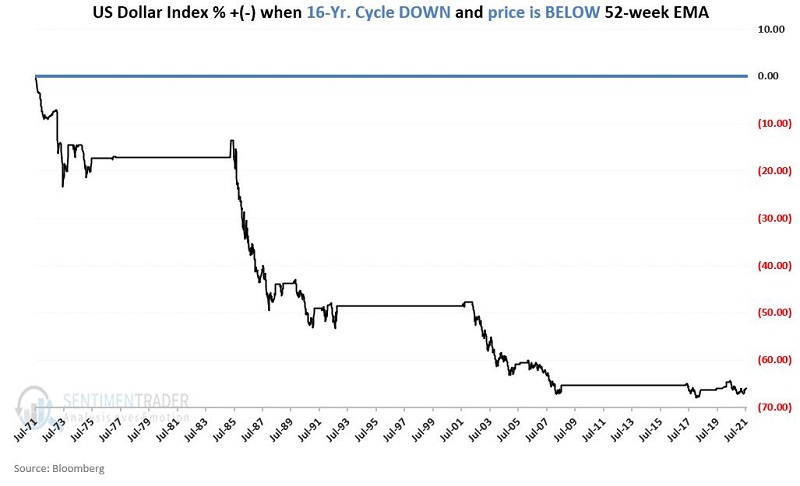
It is always possible that the cycle will prove the exception to the rule and that the U.S. dollar may advance significantly. The important thing to note is that it will have to swim upstream of these historical trends to do so.
SEASONALITY
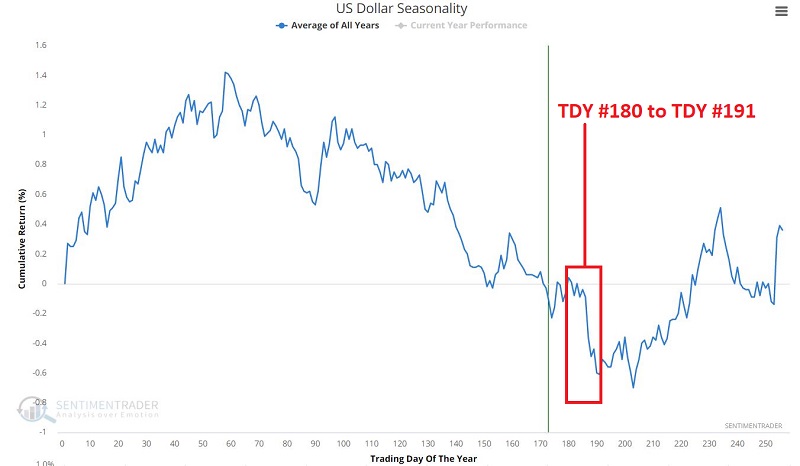
The chart below displays the Annual Seasonal Trend for the U.S. dollar. There is a period of typically significant weakness approaching in mid-to-late September.
The chart below displays the % change for the price of the U.S. dollar if held long ONLY from the close on Trading Day of the Year #180 through the close on Trading Day of the Year #191 since the early 1970's.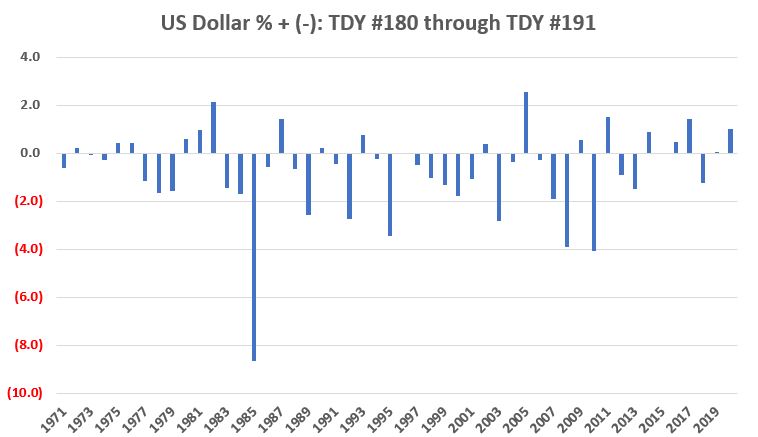
The totals:
- # of times UP = 18 (36% of the time)
- # times DOWN = 32 (64% of the time)
- Average UP = +0.89%
- Average DOWN = (-1.58%)
The chart below displays the cumulative % change for the price of the U.S. dollar if held long ONLY from the close on Trading Day of the Year #180 through the close on Trading Day of the Year #191 every year since the early 1970s.
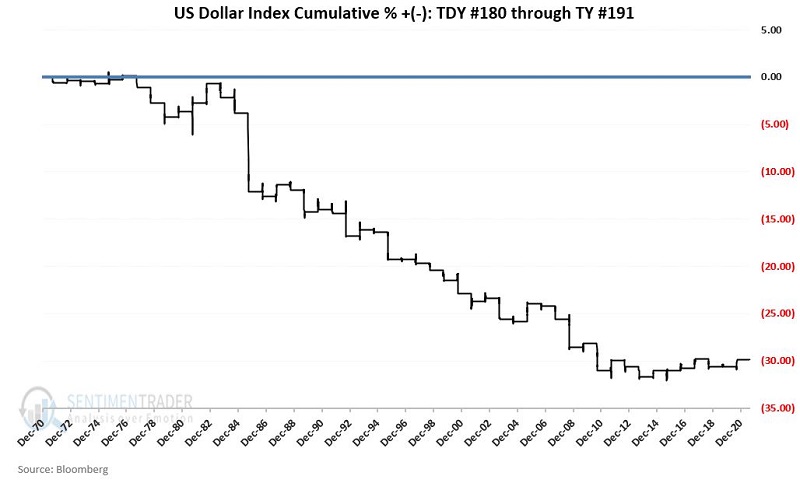
There is a clear trend of down and to the left, though the last decade has been flat as the dollar oscillated between gains and losses during these seasonal windows.
The U.S. dollar may be nearing a critical juncture during a poor seasonal and cyclical phase, as it trades around its 52-week average which will be key to watch. This is important because the price trend of the U.S. dollar has a wide influence in many areas of the financial markets.