
Time to Keep a Close Eye on the Tech Sector

Many prognosticators seem to want to be the first to declare that "Tech is Dead," based primarily on the size of their spectacular run in recent years and the excessive valuations for many of the leading stocks in the group.
And if one adopts the "what goes up, must come down" mindset - or merely revisits a chart of the 2000-2002 period for anything Nasdaq - doubt and fear can easily creep in.
Nevertheless, at the moment, a few generally reliable indicators are suggesting that the tech sector may have another run left in it. Let's take a closer look.
INDICATOR #1: XLK BREADTH (% > 10 Day Avg)
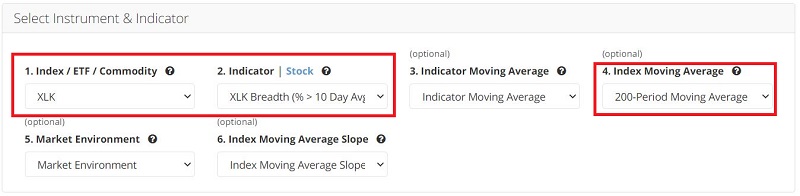
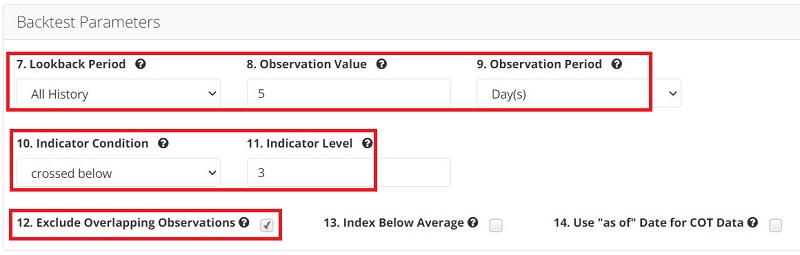
This test identifies those times when XLK Breadth (% > 10 Day Avg):
- Crosses below 3
- For the 1st time in 5 days
- While XLK is trading above its 200-day moving average
In the simplest terms possible, this test is looking for a pullback in an established uptrend for ticker XLK.
The input screens are below. You can run this test by clicking here.
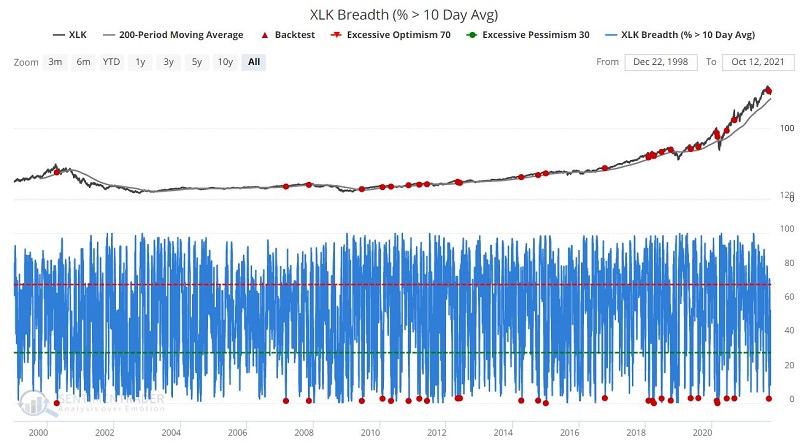
 The previous signals appear in the chart below.
 The summary of results appears in the table below.
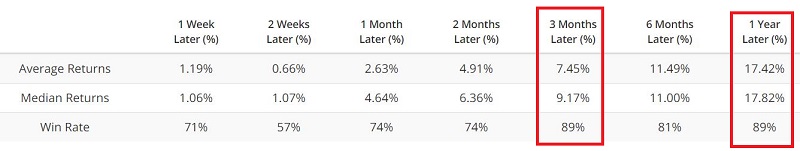 Returns have been solid and consistently favorable three months and 12 months out.
The most recent signal occurred on 9/20/2021.
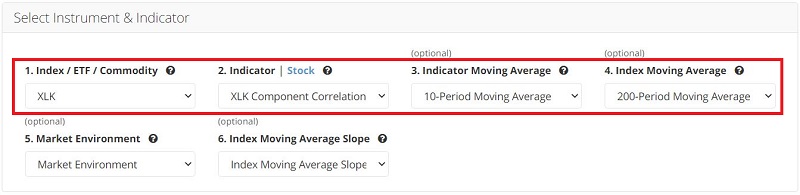
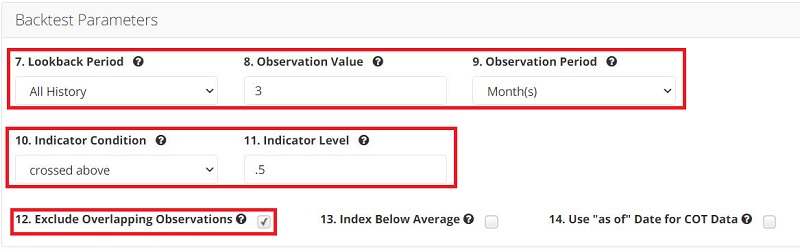
INDICATOR #2: XLK COMPONENT CORRELATION
This indicator measures to what degree the individual tickers held by XLK are moving in tandem. A high value indicates a high degree of correlation and vice versa.
This test identifies those times when:
- The 10-period average of XLK Component Correlation
- Crosses above 0.5
- For the 1st time in 3 months
- While XLK is trading above its 200-day moving average
In the simplest terms, this test is looking for a sign that tech stocks are beginning to move in the same direction en masse during an uptrend for ticker XLK.
The input screens are below. You can run this test by clicking here.
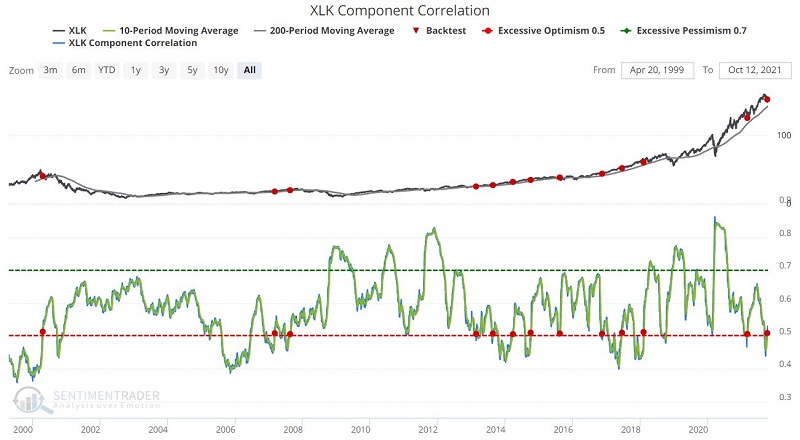
The previous signals appear in the chart below.
 The summary of results appears in the table below.
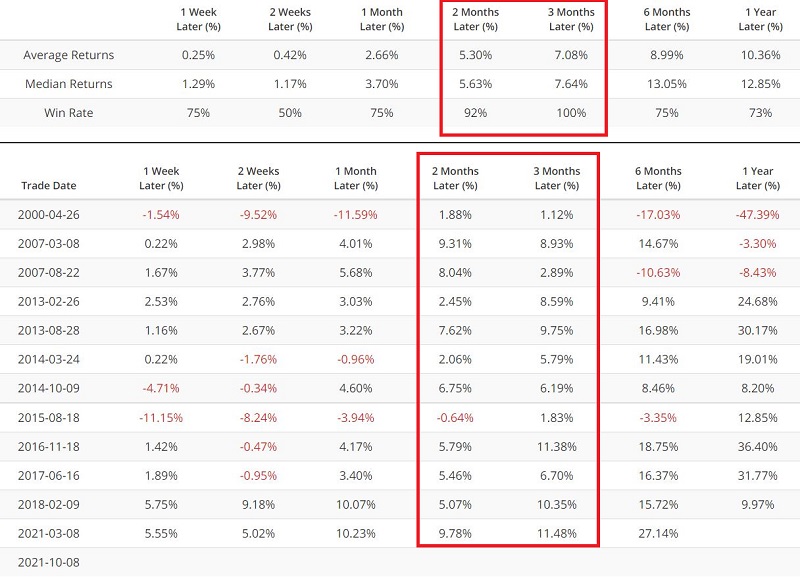
Returns have been solid and consistently favorable 2 months and 3 months after a signal.
The most recent signal occurred on 10/8/2021.
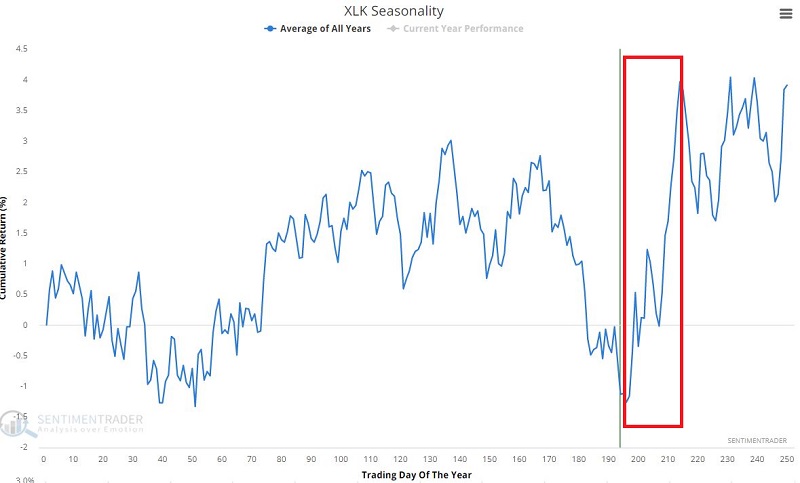
INDICATOR #3: XLK SEASONALITY
The chart below displays the Annual Seasonal Trend for ticker XLK. As you can see, it is about to enter a "seasonally favorable period" that extends from Trading Day of Year (TDY) #196 through TDM #214.
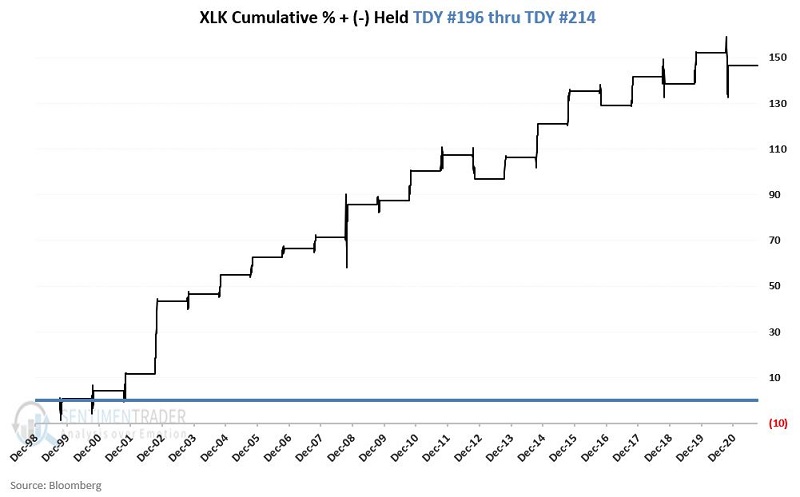
 The chart below displays the cumulative % +(-) for ticker XLK if held ONLY during this period every year starting in 1999.
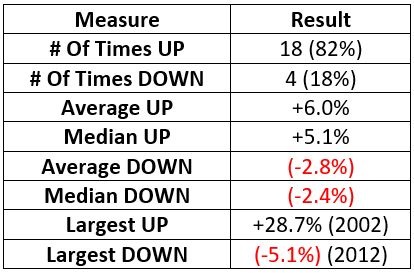
 The table below displays a summary of the results.
SUMMARY
The items detailed above suggest that the tech sector "should" - or more accurately, "could" - be setting up for a period of strength. Tech traders might do well to start looking for specific trading opportunities, whether trading ticker XLK itself, options on XLK (NOTE: just an opinion, QQQ options are much more liquid than options on XLK, and the correlation between XLK and QQQ is very high so options traders might focus on QQQ instead of XLK), or individual tech stocks.
Those who are not inclined to trade tech stocks might still want to pay close attention in the weeks and months ahead. Suppose the tech sector DOES NOT respond favorably during the expected "favorable" period. In that case, it could well be a sign of more significant trouble to come in the tech sector and the overall market.