
Time to Keep a Close Eye on Copper

Many commodities have rallied quite sharply in recent months (see this post from Dean). Given rising concerns over inflation and the vast underperformance of commodities relative to stocks in the past decade, it should not be surprising to see commodities stage a continued advance in the years ahead.
But nothing moves forever in a straight line.
COPPER AND MOMENTUM
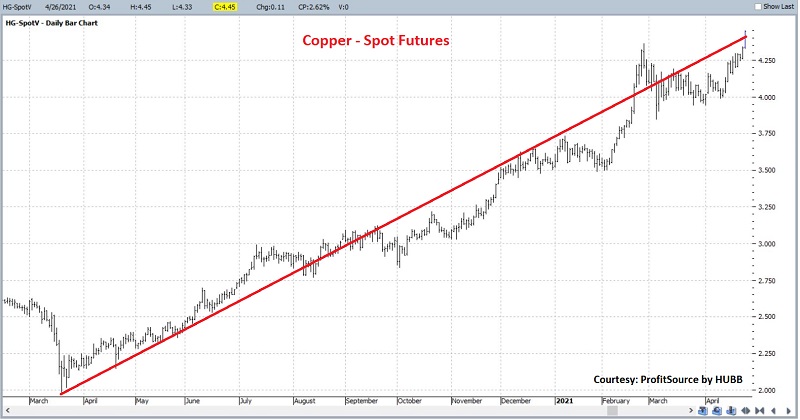
In the chart below, we can see that copper has experienced a terrific advance since the low in March 2020, having rallied over +125%.
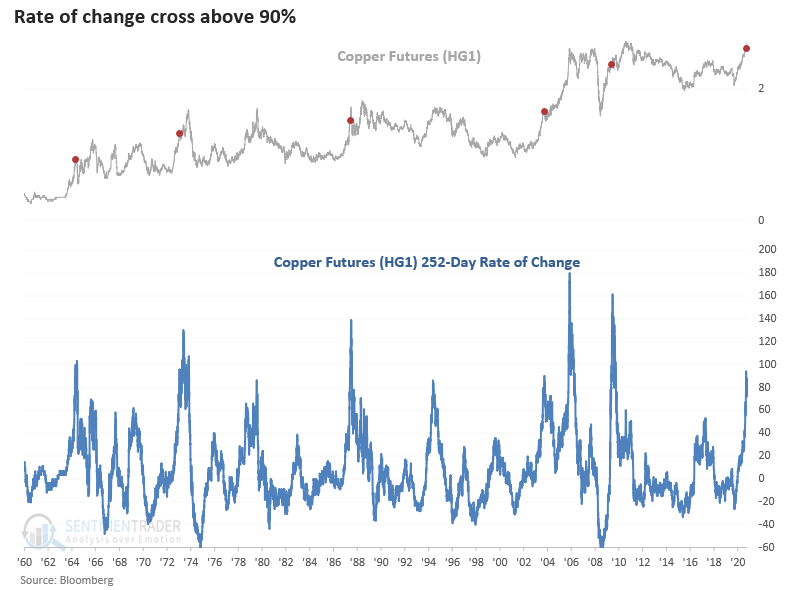
But a few warning signs are gathering for this important metal. In the chart below - borrowed from Dean - we see what has happened to the copper market after similar "thrusts" such as the one we recently saw. On some occasions, the "party" continued; other times, a sharp pullback followed.
COPPER AND SEASONALITY
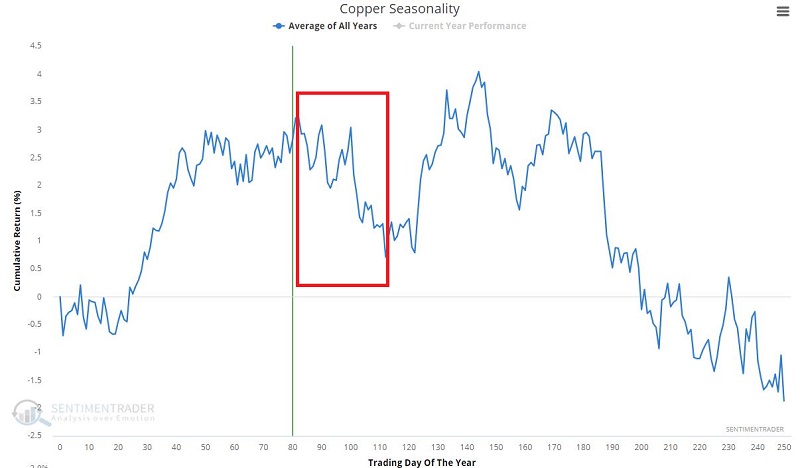
Another potential concern is the onset of a seasonally unfavorable period for copper starting forthwith on the close of trading on April 28th. In the chart below, we see the annual seasonal pattern for copper and note the period from the end of Trading Day of Year #82 through Trading Day of Year #112.
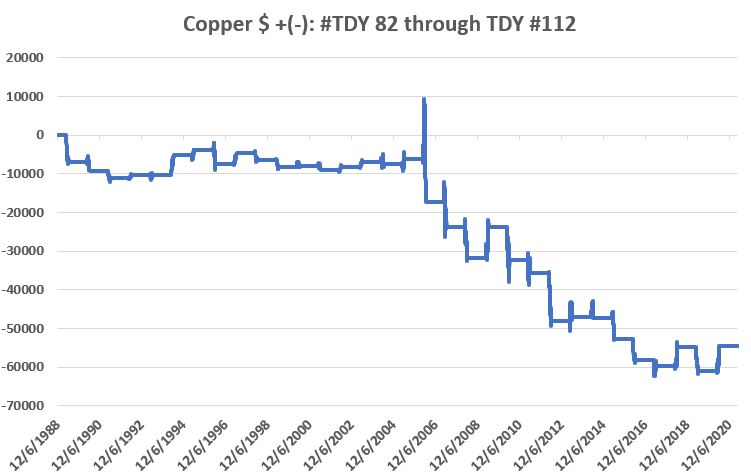
The chart below displays the cumulative hypothetical $ +(-) for a long 1-lot position in copper futures held ONLY during this period every year since 1988.
The chart below displays the $ +(-) for a long 1-lot position in copper held ONLY during this time period on a year-by-year basis. As you can see, it is by no means a "sure thing loss." Still, the persistent risk of large declines is fairly apparent.
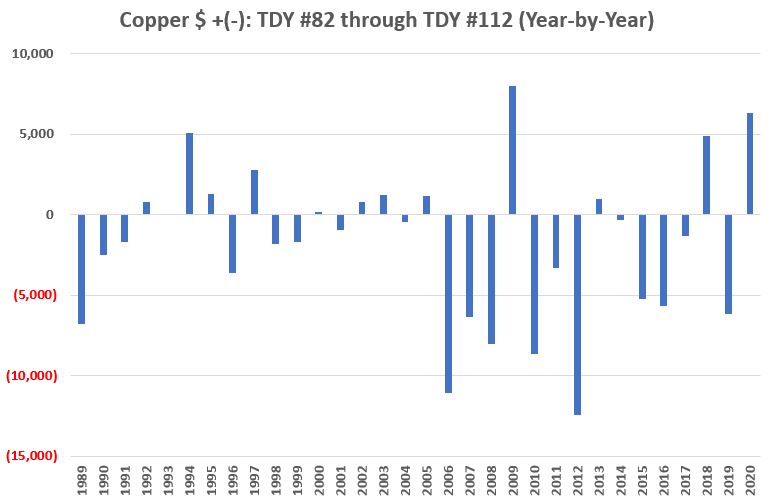
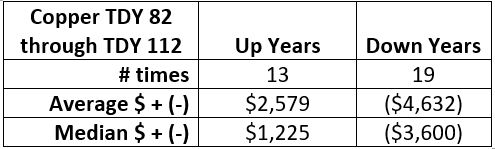
The table below puts some numbers to all of this. Note that the median loss is almost 3 times the median gain.
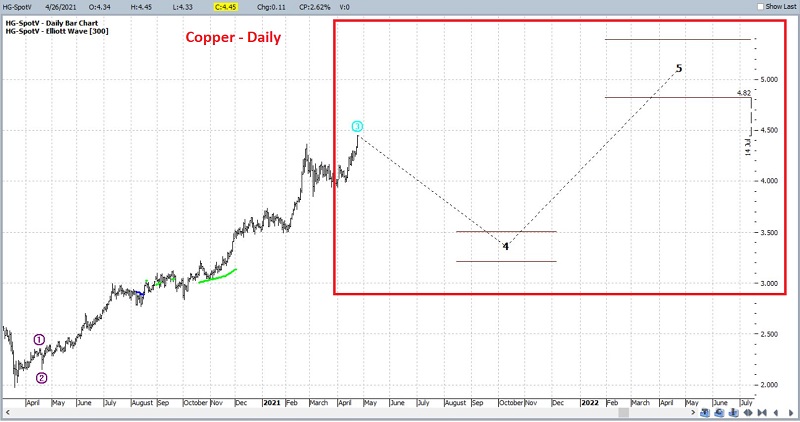
COPPER AND ELLIOTT WAVE
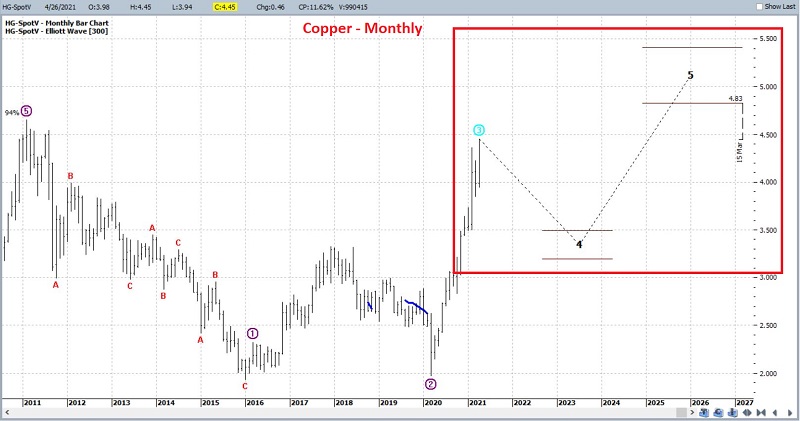
I am not a huge proponent of Elliott Wave Analysis (primarily because I am not very good at correctly counting the waves). But I do tend to pay closer attention when EW counts of different time frames line up. For this, I rely on the mechanical algorithm built into ProfitSource by HUBB (for the record, I have no financial interest in nor do I do business with HUBB. I only use their software), which - for better or worse - draws Elliott Wave counts as it interprets them.
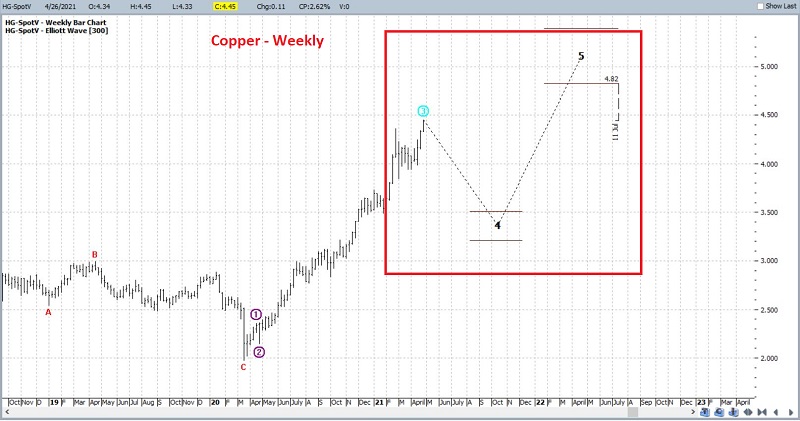
The interesting thing to note in the charts below is that the EW count on the daily, weekly, AND monthly charts suggests a Wave 4 pullback in the period just ahead.
SUMMARY
Does any of this mean that copper is doomed to suffer a pullback in the weeks ahead? Not at all. Sometimes a market will just run, and nothing will stand in its way. Copper may be in the midst of just that type of advance.
But if copper fails to follow through in the near term, a better buying opportunity may come around closer to the end of May.