Tightening financial conditions weigh on sentiment
Key points:
- An index of financial conditions is showing signs that a near-record stretch of easy conditions has ended
- That hasn't had a consistently negative impact on stocks
- Among other sectors, factors, and markets, the dollar showed the worst returns
Financial conditions may have ended a near-record period of easy
With interest rates jumping, credit spreads widening, and stock valuations getting more attention, financial conditions have tightened, weighing on sentiment. Numerous services have some version of a "financial conditions index," and most of them include similar inputs measured in similar ways.
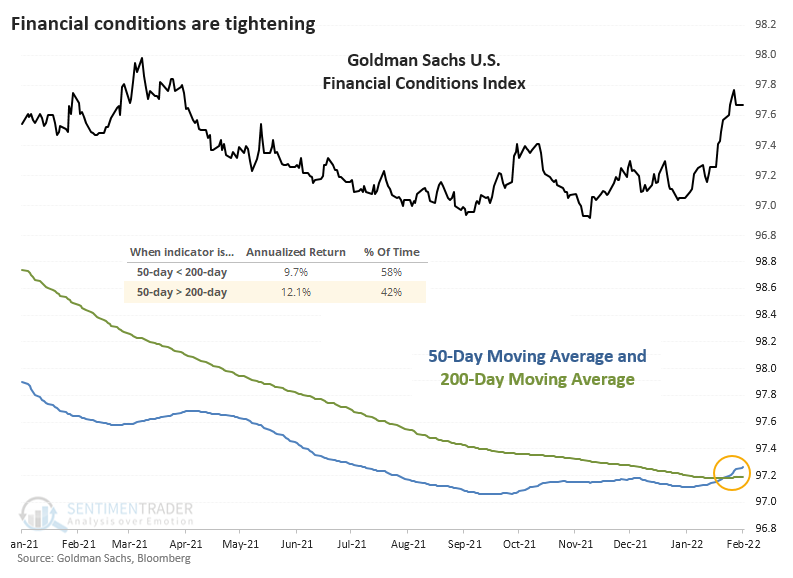
One of them, the Goldman Sachs U.S. Financial Conditions Index, has been rising all year. Per Goldman:
"Our FCI is defined as a weighted average of riskless interest rates, the exchange rate, equity valuations, and credit spreads, with weights that correspond to the direct impact of each variable on GDP."
The index's 50-day moving average has just crossed above its 200-day moving average, suggesting a potential long-term change in financial conditions. When financial conditions get tighter, meaning a rising value for this index, it's supposed to be bad for stocks and most other markets as it weighs on investor sentiment.

The recent cross of the 50-day average above the 200-day ends a near-record stretch of extremely easy financial conditions. It had been nearly 400 days since the shorter-term average was above the long-term one, the 3rd-longest streak in 40 years.
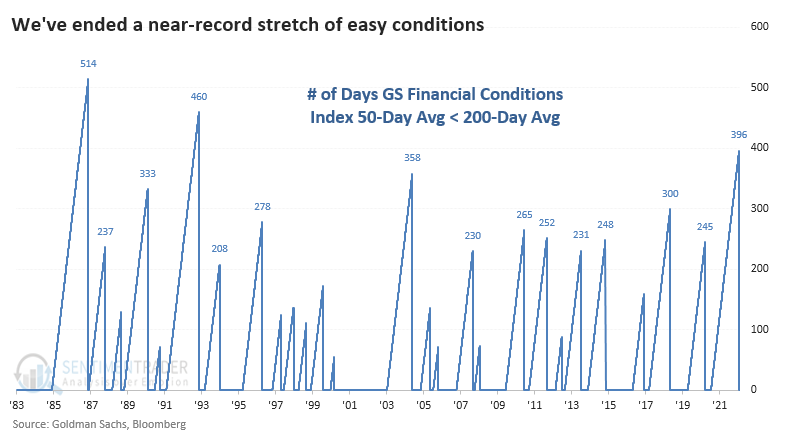
The ends of similar periods of easy conditions preceded the 1987 stock market crash and the 2008 financial crisis. That gives some fuel to bears who believe that tighter conditions are a prerequisite to a market crash.
But those were also two of the only exceptions to what was mostly a non-event for stocks. And as we can see from the first chart, the S&P 500's annualized return was better when the 50-day average of financial conditions was above its 200-day average. Go figure.
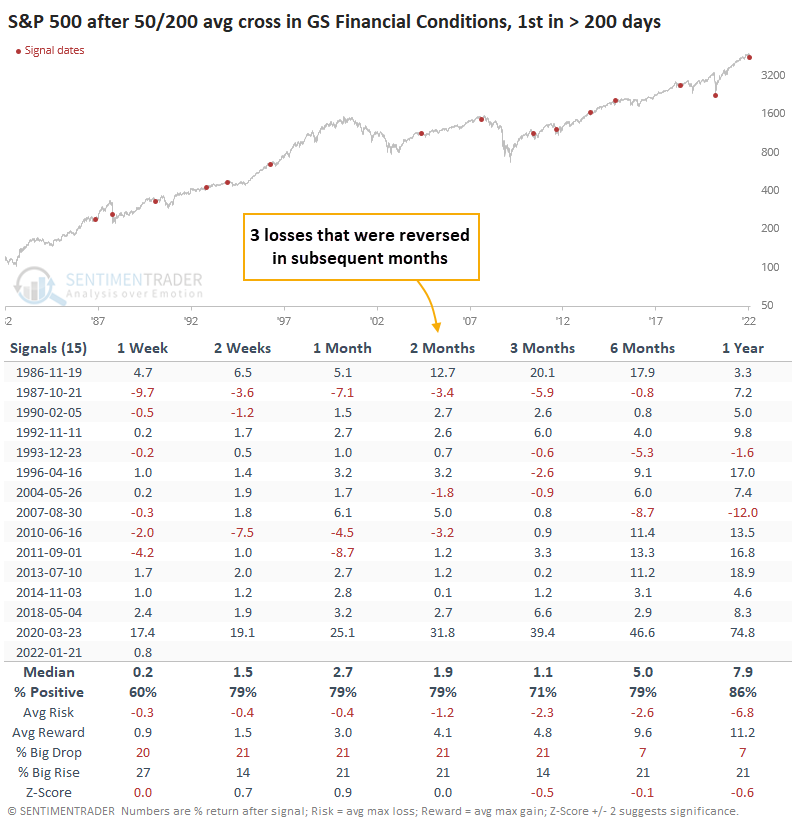
After the ends of other streaks of at least 200 days with easy conditions, the S&P 500 mostly rallied in the months ahead. Over the next 2 months, it showed a positive return after 12 out of 15 signals. The 3 losses were muted and reversed to gains in subsequent months.
Impact on other markets
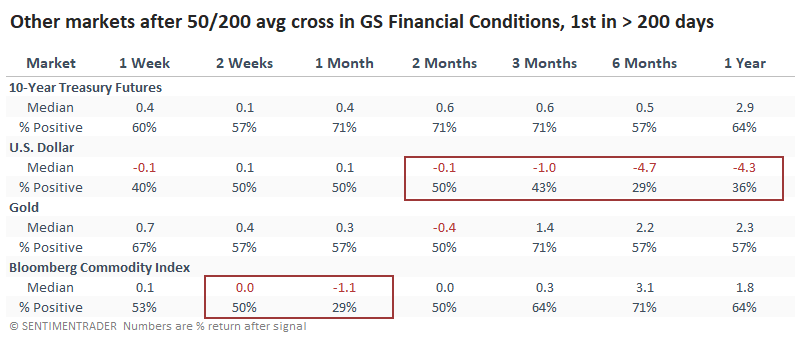
Other markets saw quite different prospects going forward. 10-year Treasury futures mostly rose over the next 1-3 months. This uses bond prices, which means that yields mostly declined (this is within a long-term downtrend for yields, so no big surprise there).
The Bloomberg Commodity Index struggled over the next month, then performed fine. The worst longer-term returns were in the U.S. dollar, which showed a positive return only 29% of the time over the next 6 months.
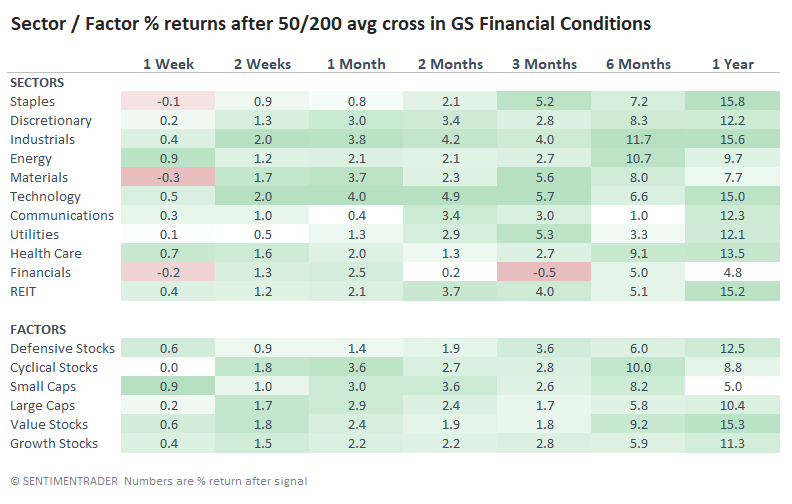
Among sectors, there was an interesting mix in performance. Some of the more defensive sectors did well, but so did Technology. The worst sector was Financials, the only sector or factor with a negative median return during the next 3 months.
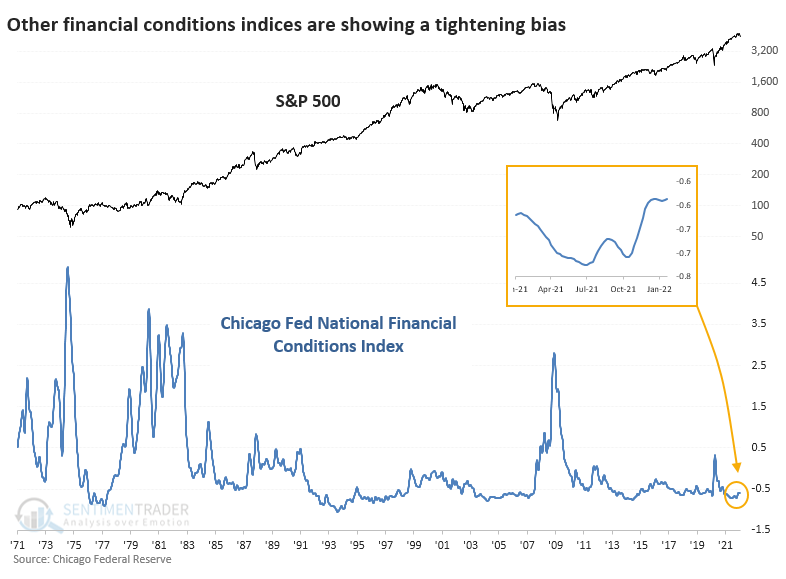
There are other sources of financial condition indexes, and one of the longest-tenured ones is published weekly by the Chicago Fed. That one bottomed last June and has been rising ever since.
The table below shows other times in the past 50 years when the index has gone 30 weeks since making a low and rose 0.10 index points or more.
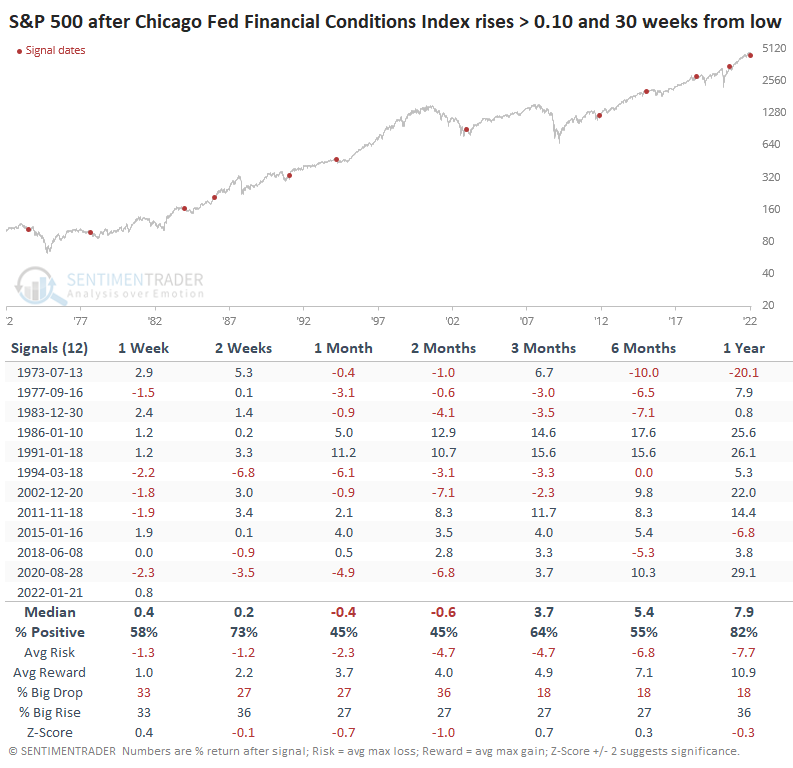
After these instances of tightening financial conditions, the S&P showed worse performance over the next 1-2 months, but still, there was only one significant loss from the 1973 bear market. After the others, most of the damage in stocks had already been done as investors anticipated the less accommodating conditions.
What the research tells us...
In recent weeks, investor sentiment has taken a beating, and tighter financial conditions aren't helping. It seems like a turn in conditions would be a good signal to sell stocks, but that has not been the case with enough consistency to use it as a signal, at least using a long-term trend-following approach. More than anything, it was negative for the U.S. dollar.

