Thursday Midday Color - First Pullback, Weak Sectors, Returning Investors

Here's what's piquing my interest so far on this whippy day.
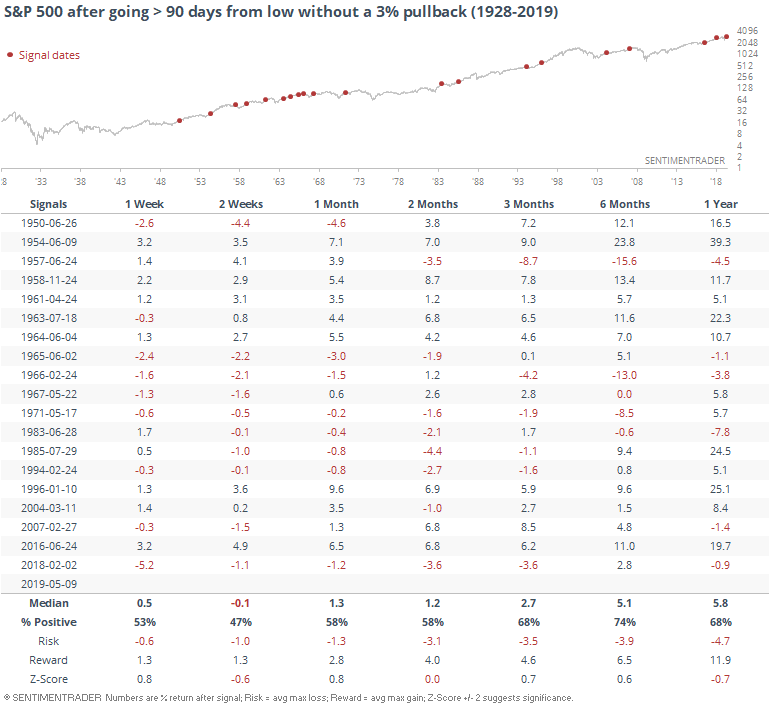
Finally, A 3%-er
The S&P 500 is on track to pull back by more than 3% from the highest point it rallied to since the December bottom. That's the first time it's pulled back by this "large" of an amount. That streak of more than 90 days without a 3% pullback is one of the longer ones since 1928.
Other times it suffered its first real test, there was a bit of shorter-term weakness, but it wasn't very consistent, or large.
Emerging Headache
Bloomberg notes that emerging markets have moved below their lower Bollinger Band for the first time in a while, showing a swift, severe decline.
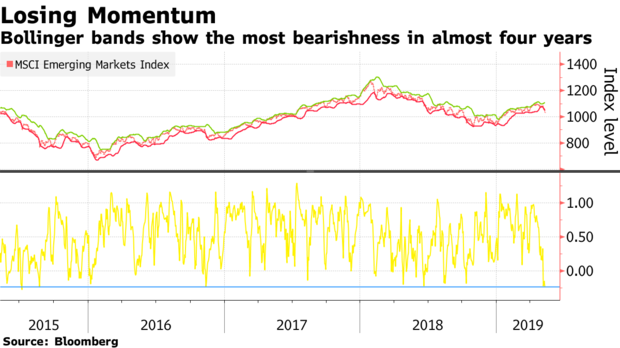
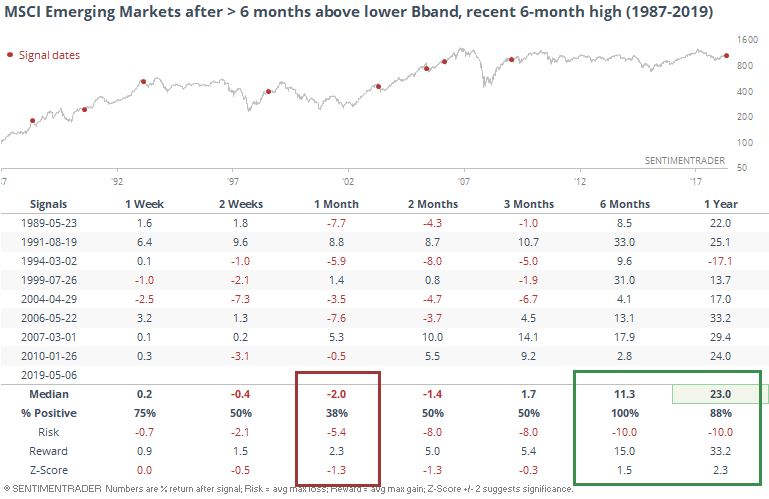
It was only a few weeks ago that the MSCI Emerging Markets Index was trading at a 6-month high. Now it's traded below its lower BBand for the first time in more than 6 months.
Other times investors behaved like this, it led to some further shorter-term weakness, but was higher 6 months later every time.
Flows
Over the past week, investors have fled two of the old guard of index ETFs, SPY and QQQ. For SPY, investors have redeemed an average of $1.8 billion per day, the most since December.
From the Backtest Engine, we can see that big outflows led to modestly positive returns, nothing too special.
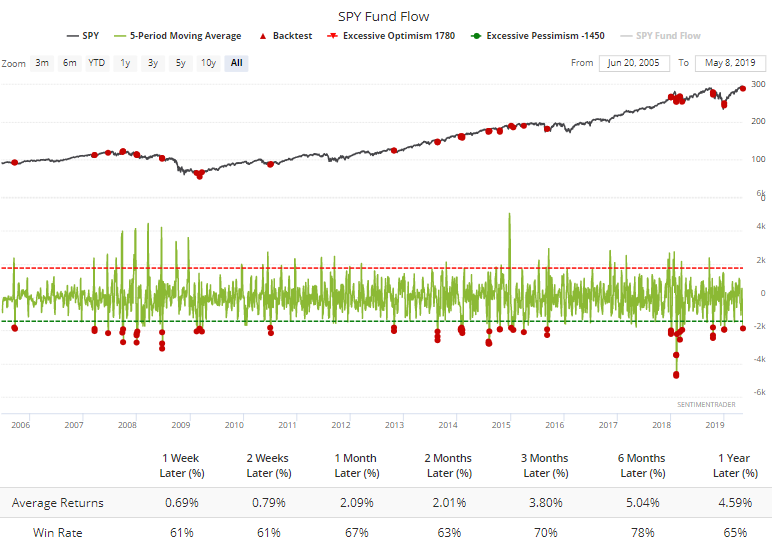
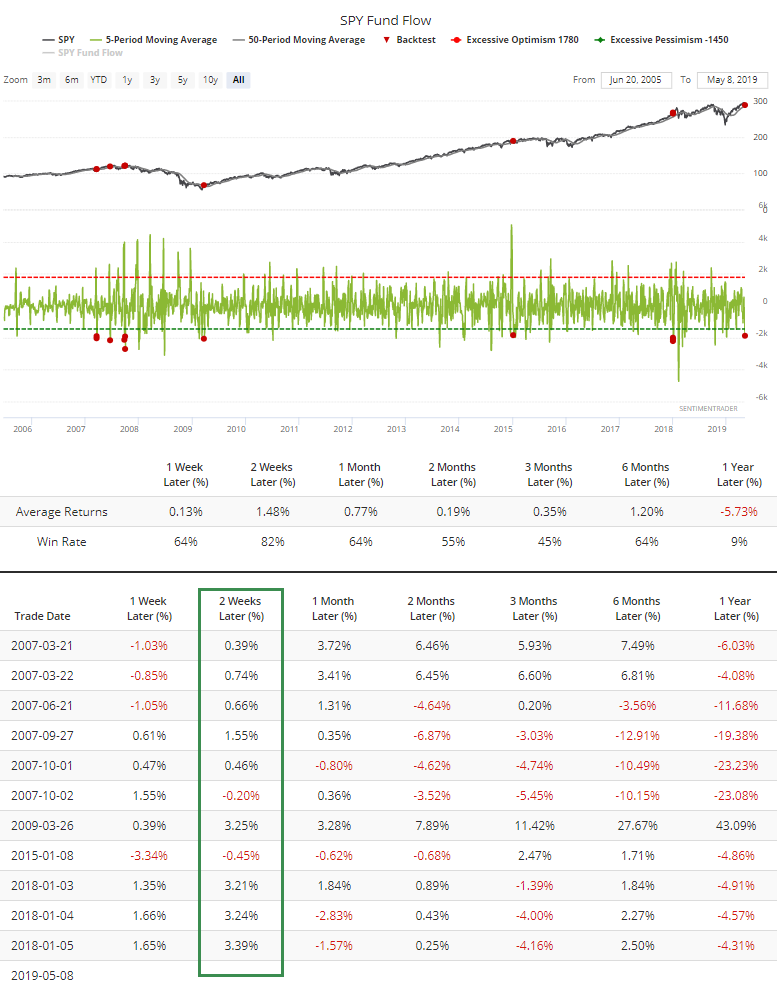
One of the differences this time is that the outflow is occurring in the midst of what had been a very positive trend, with the S&P still (barely) holding above its 50-day average. Other times SPY had such a large and persistent outflow when above its average, it tended to bounce over the next couple of weeks.
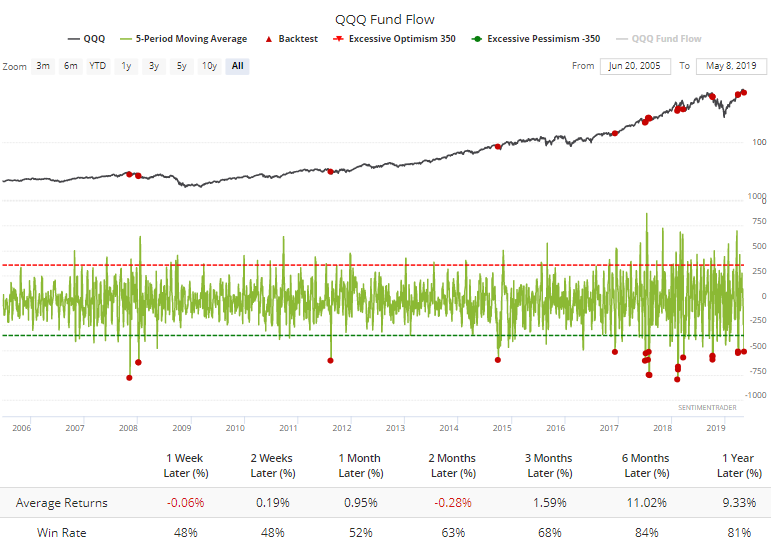
In the Nasdaq 100 fund (QQQ), investors have pulled an average of more than $500 million per day from the fund, a historically large amount. Fund flows can be iffy as a contrary indicator sometimes, and the QQQ flow is no exception.
Breadth Review
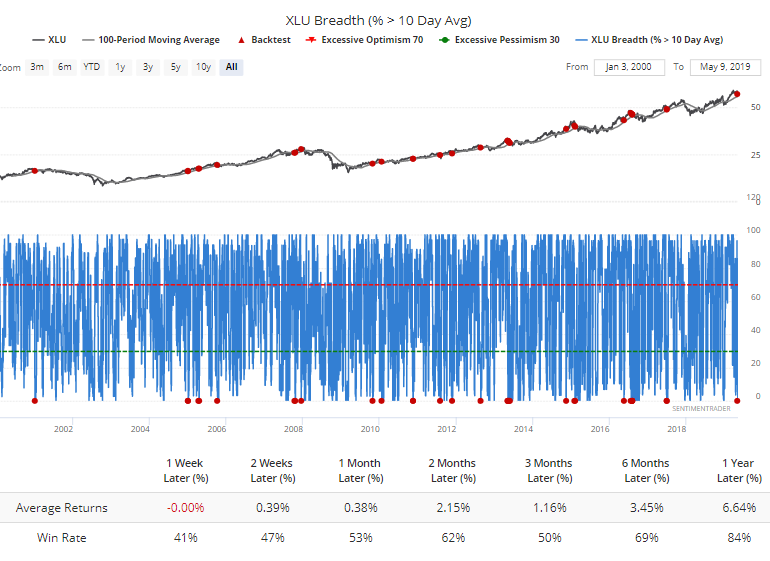
In late March, we saw that breadth in utilities was as good as it gets, and that has NOT been a good sign for that normally staid sector. Those stocks plateaued and are starting to sell off a bit, enough to push every one of them below their short-term 10-day moving averages.
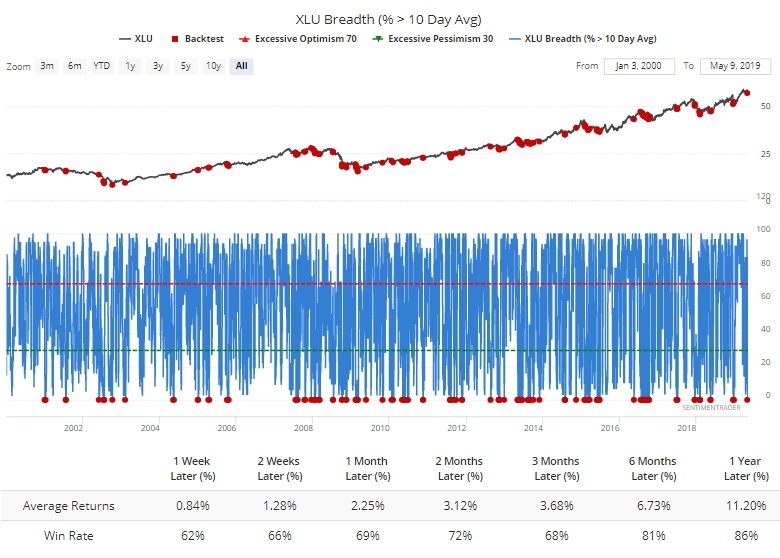
That's not very common when XLU is still above its 100-day average, and was less of a good sign. It suggests a selling impulse in a medium- to long-term uptrend.
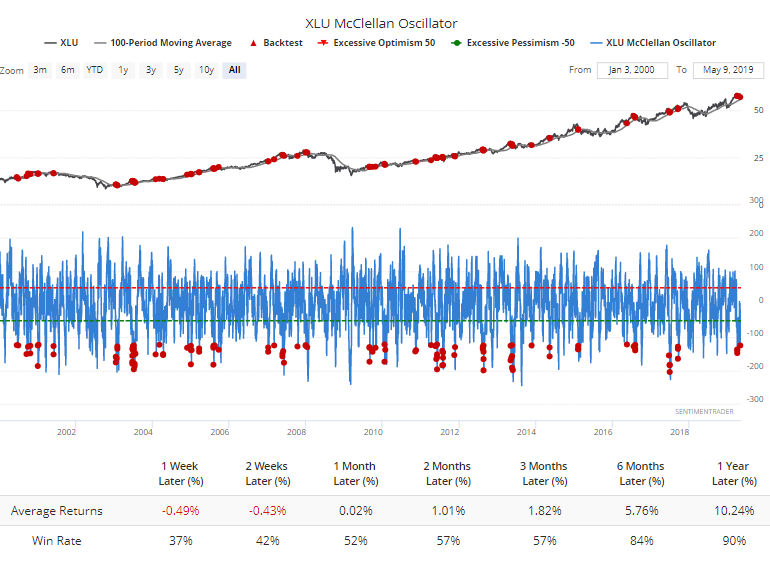
Same for when the McClellan Oscillator drops as low as it is now.
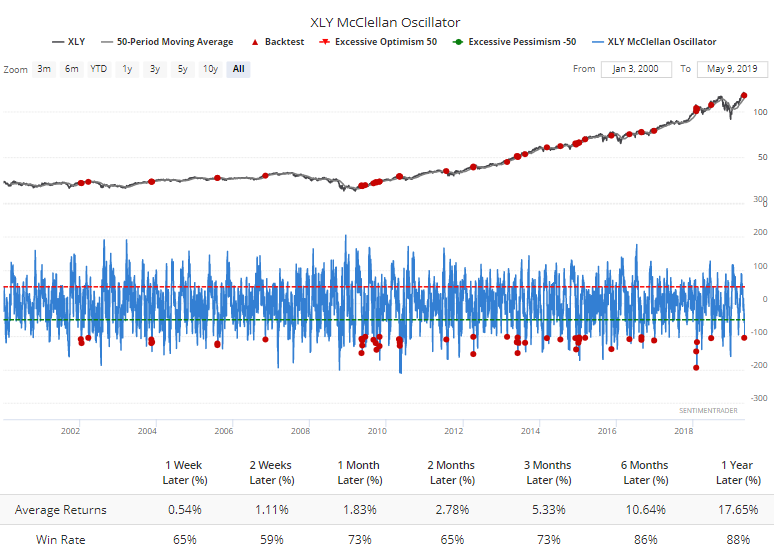
There has also been some selling momentum in discretionary stocks. The Oscillator dropped below -100 when XLY was still hanging above its 50-day average. Returns were pretty good, especially over the next month.
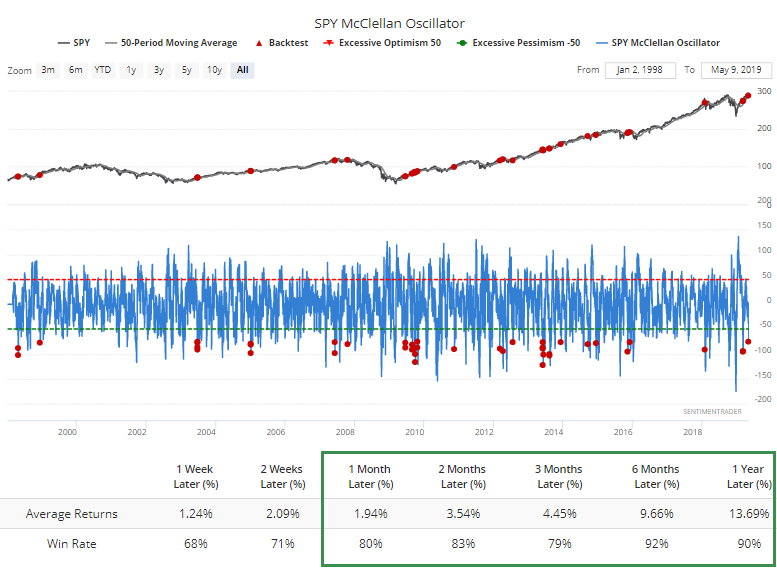
Even within the broad S&P 500 index, the selling has been heavy enough that the Oscillator fell to -75. That's a pretty rare event when it was sill trading above its 50-day average. And mostly a good sign.
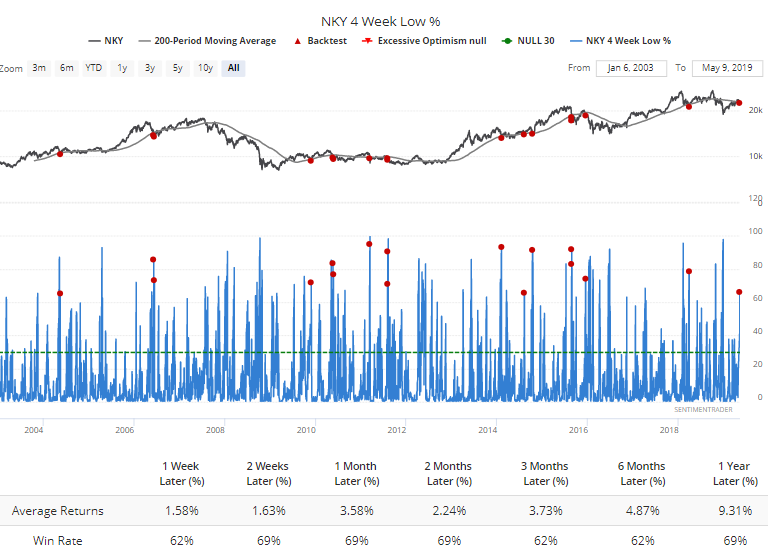
Overseas, more than 65% of stocks on the Nikkei fell to one-month lows. This is kind of a curious test, but if we look for times that happened when the index was trading below an upward-sloping 200-day average (these identify times when those stocks were potentially in the early stage of transitioning to a downtrend), there was a moderate tendency to bounce.
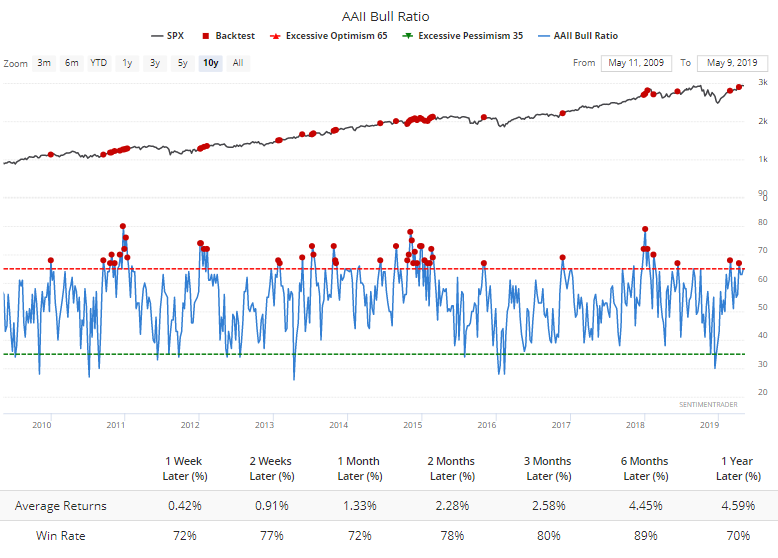
Individuals Are Coming Back
Mom-and-pop investors are picking up their optimism according to the latest AAII survey. The Bull Ratio was above 67%, enough to consider it extreme. But since the financial crisis (or even before, really), such a reading is still not high enough to be a reliable contrary indicator.