Thursday Midday Color

Here's what's piquing my interest so far today.
Slick
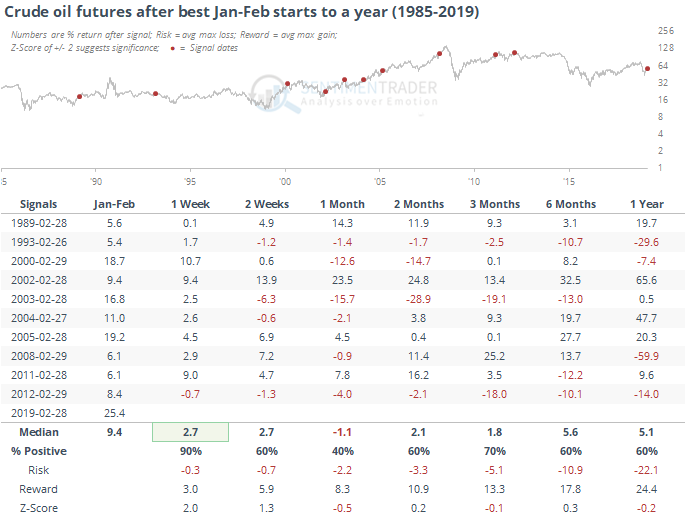
The WSJ notes that it's not only stocks enjoying a good start to the year. For oil, it's the best-ever, unless it takes a massive hit today. With a gain through yesterday of more than 25%, it's by far the best YTD return through February since 1985. Other times it rallied more than 5% to start the year, it continued to gain through the first week of March every time but once, then suffered mixed results.
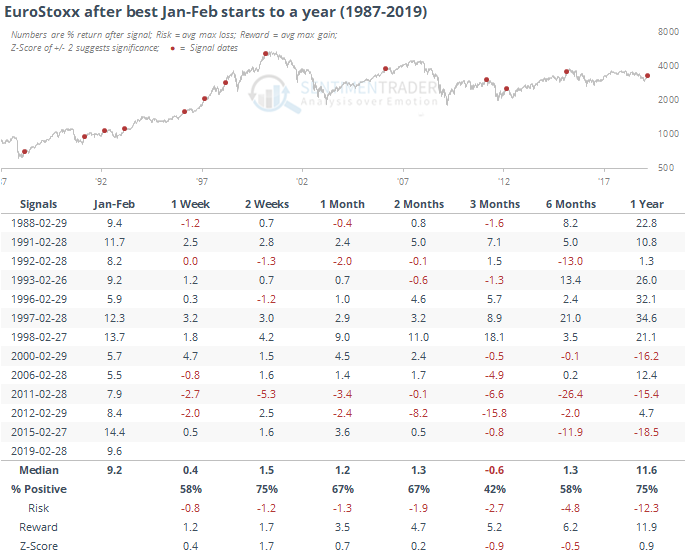
It's been good for overseas indexes, too. Like the EuroStoxx.
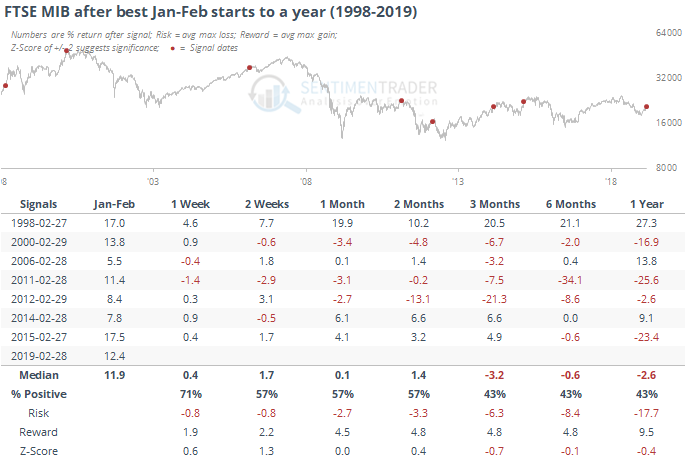
And Italian stocks.
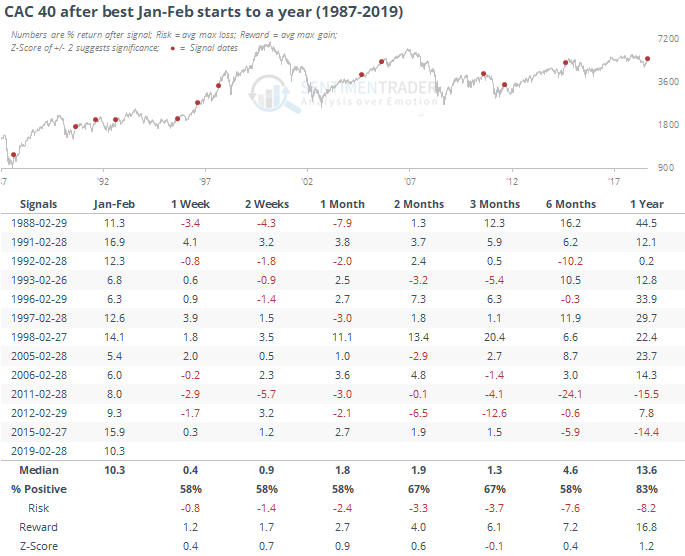
And French stocks.
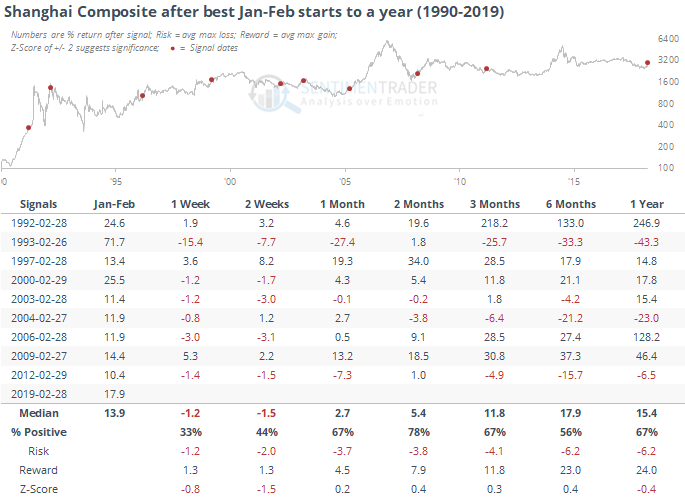
And Chinese stocks.
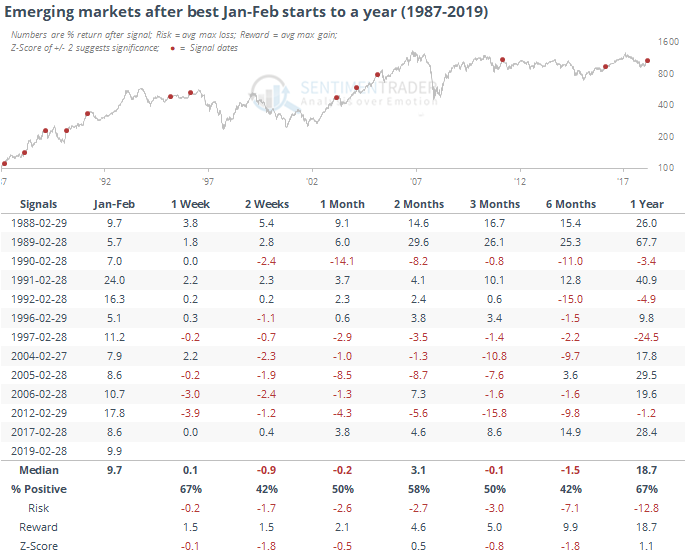
And Emerging Markets.
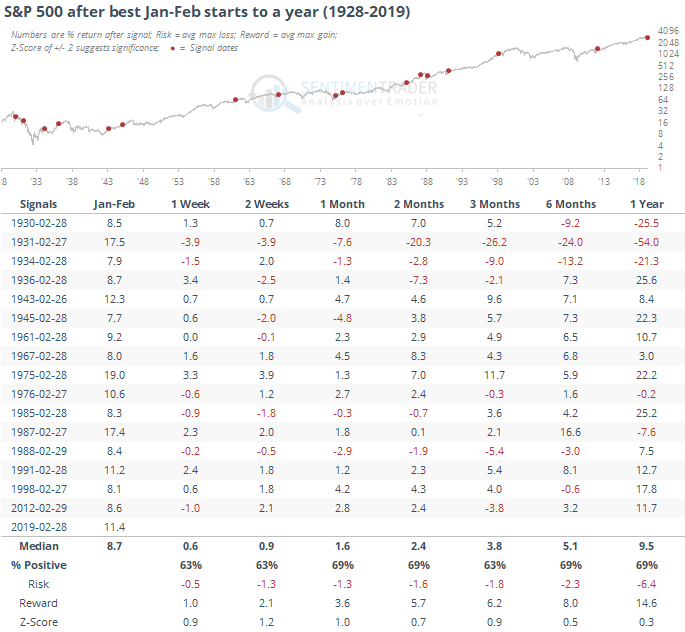
And, of course, the S&P 500.
Volatility Flow
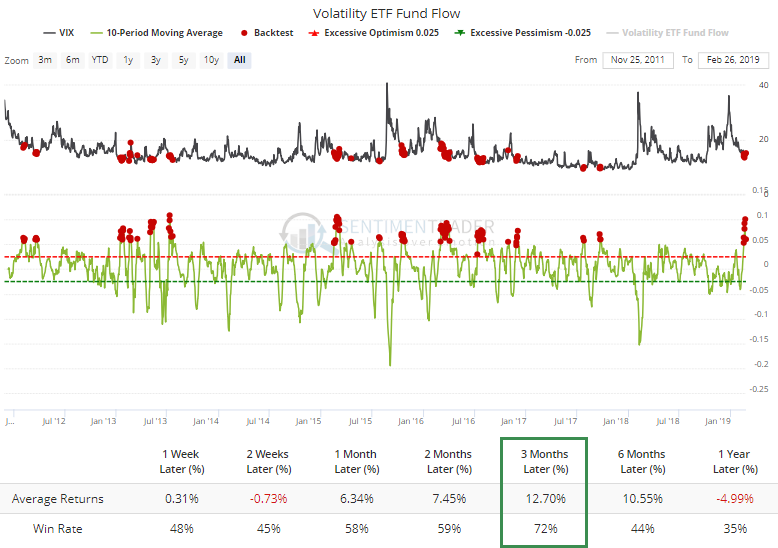
There was a big outflow from volatility ETFs on Wednesday. That typically happens after a spike in the VIX, so that's unusual. It could be related to the expiration of VXX and traders moving into/out of the new VXXB fund. Wednesday's flow was a change from recent weeks, when there was a big inflow. That has usually happened when the VIX dropped and was about to swing higher in the months ahead.
Few Bears
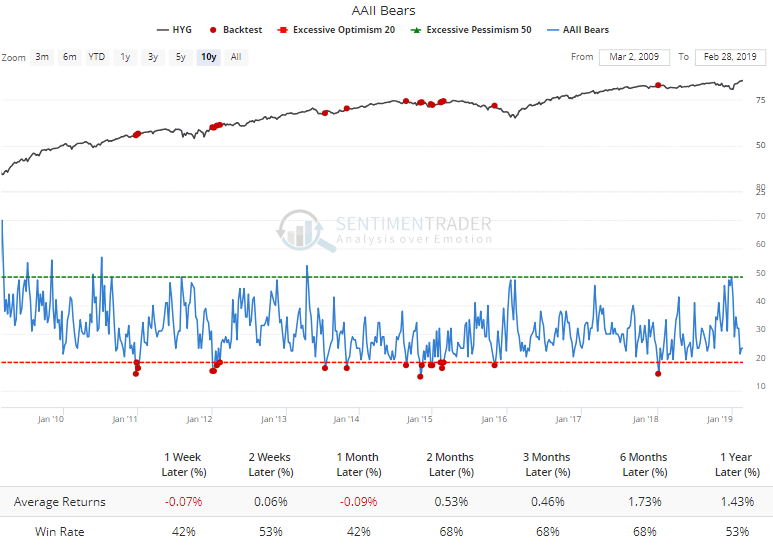
The latest AAII survey showed another drop in bears, which is no surprise. They're now down to one of the lowest levels since the financial crisis. Using the Backtest Engine and testing how markets performed after so few bears, one of the worst was junk bonds. HYG didn't do horribly after this kind of extreme, but it was pretty low.
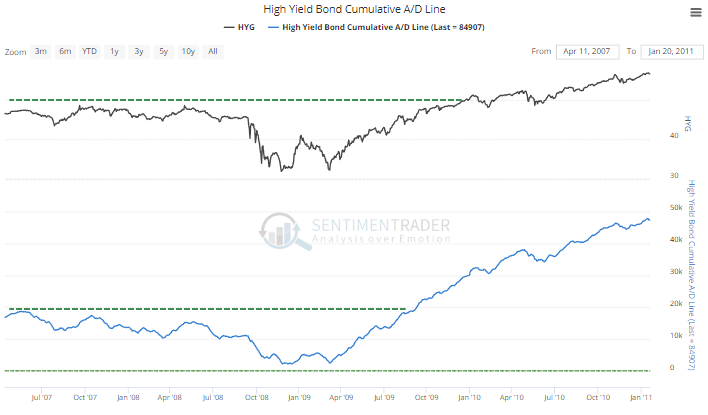
Another minor concern for high-yield bonds is the Cumulative Advance/Decline Line. Despite a new high in funds like HYG, the A/D Line has barely made it back to its fall 2018 high, and is well below its peak from late 2017. That's far different from its last recovery from a major selloff in 2015-16, when the A/D Line led price.
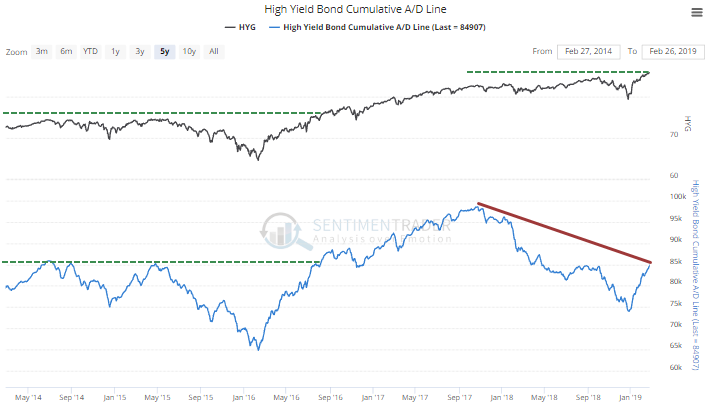
That was the case coming out of the financial crisis, too, when the A/D Line reached new highs months ahead of prices.