Data &
Technology
Research
Reports
Report Solutions
Reports Library
Actionable
Strategies
Free
Resources
Simple Backtest Calculator
Simple Seasonality Calculator
The Kelly Criterion Calculator
Sentiment Geo Map
Public Research Reports
Free Webinar
Pricing
Company
About
Meet Our Team
In the News
Testimonials
Client Success Stories
Contact
Log inLoginSign up
< BACK TO ALL REPORTS

Thursday Midday Color - Panic, Few Bulls, Asian Slide

Jason Goepfert
2019-05-23
null

Here's what's piquing my interest so far on this increasingly ugly-looking day.

More Gaps

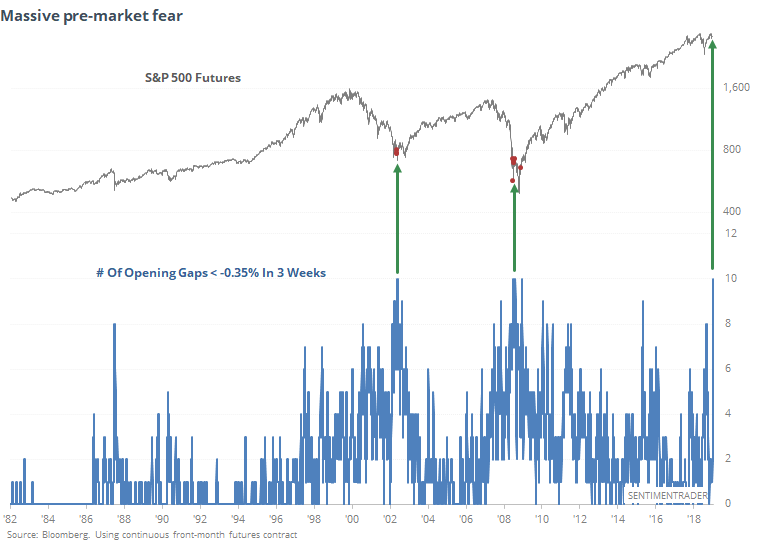
The anxiety surrounding trade worries is the reason most commonly given to traders' overnight anxiety. Whatever the reason, there is no question that they don't want to hang around for the opening of regular trading hours. Over the past three weeks, there have been 10 openings more than 0.35% below the prior day's close.

Since the 1982 inception of the S&P 500 futures market, there have been only two time periods with this much anxiety - the bottom of the 2002 bear market, and the depths of the financial crisis.

A sample size of two, compelling as it is, makes it hard to have a lot of confidence. In order to get more samples, we have to adjust or loosen the parameters. If we look instead for days like today (so far) that gapped down at least 0.75% at the open and then a further 0.75% into the close, while above the 200-day average, we get the following.

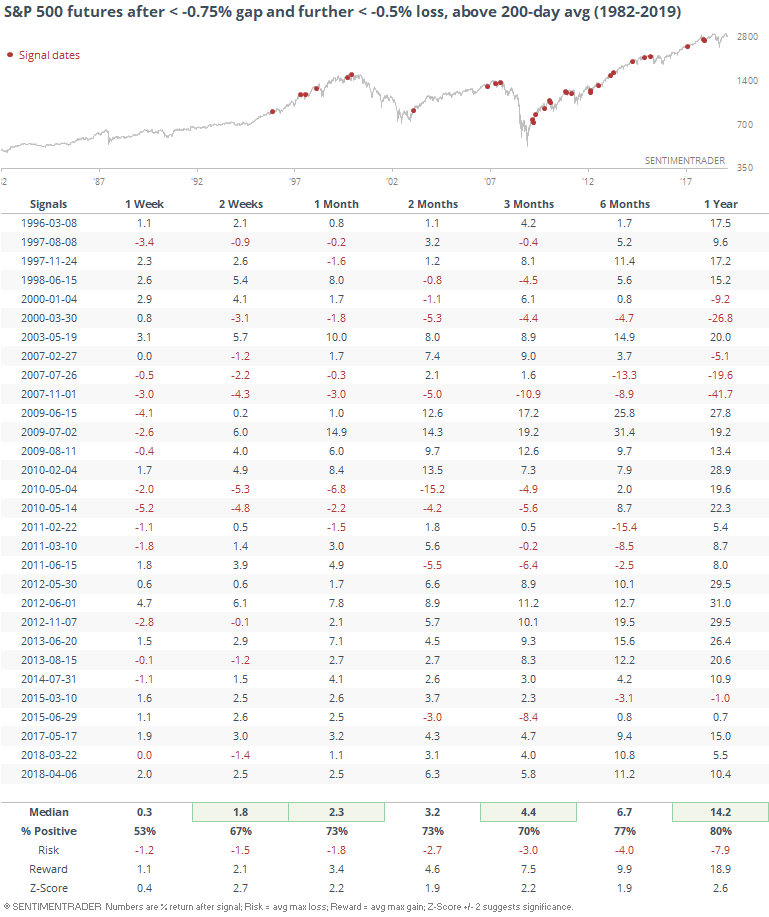
Again, mostly positive returns. It's not looking very healthy today, but historically this kind of panicky pressure has resolved higher, not lower.

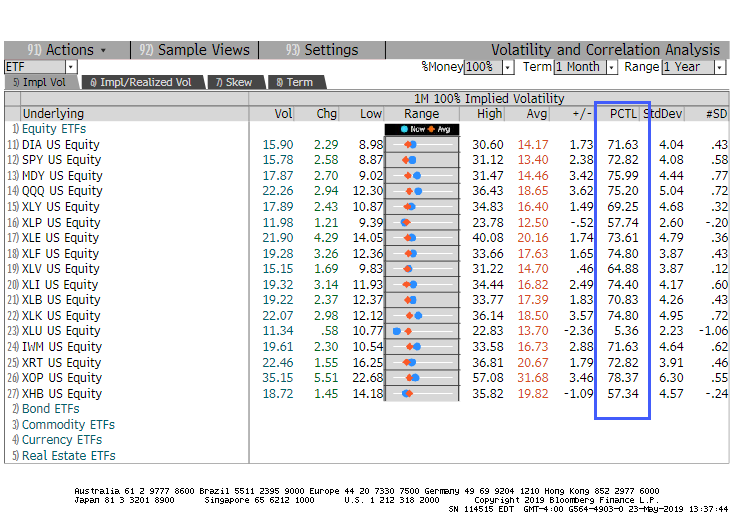
It's a little bit concerning on the surface that while price action is suggesting near-panic behavior, a lot of indicators are relatively tepid. Among the major equity ETFs, for example, options skew has barely budged and remains in the lower 75% of their ranges over the past year.

Leaving The Table

The anxiety shown by pre-market gaps are not the only evidence. We've seen in recent reports that there have been massive outflows from equity funds as well. And while less reliable, individual investors are becoming increasingly pessimistic.

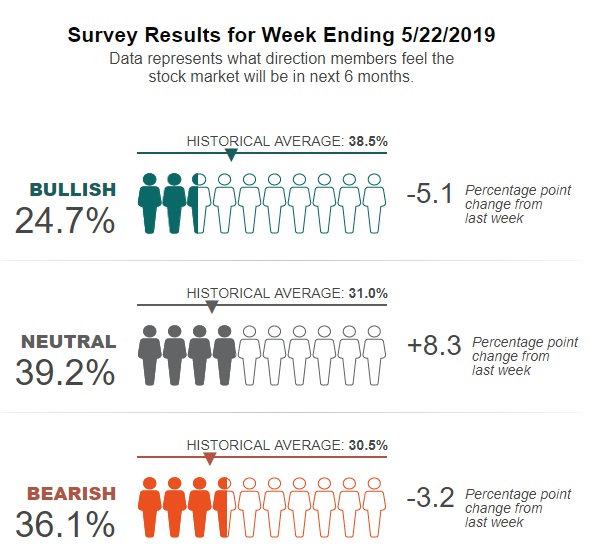
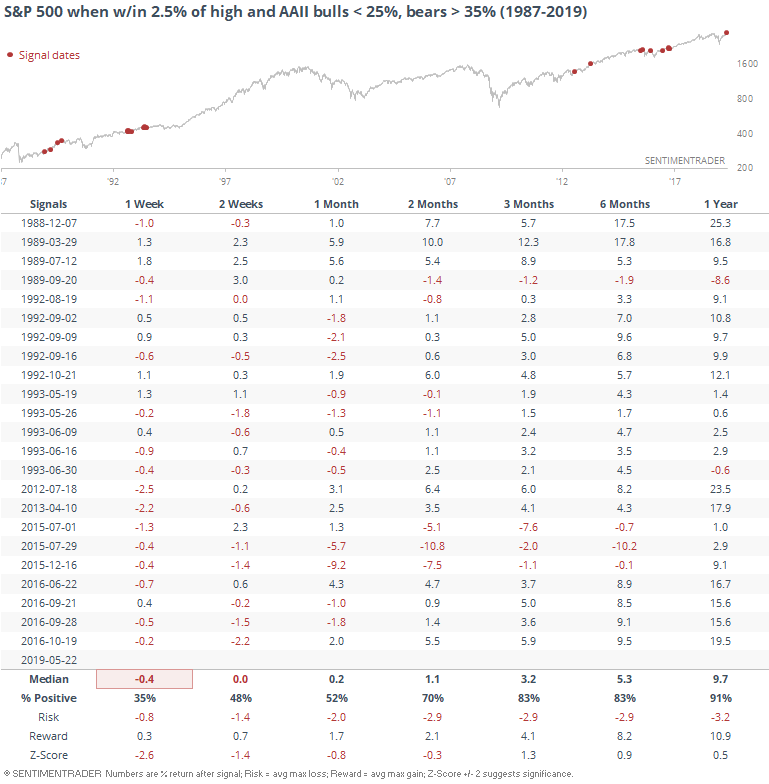
This is the first time in 2 1/2 years when stocks were this close to their 52-week high, yet fewer than 25% of investors were bullish while more than 35% of them were bearish.

Asian Slide

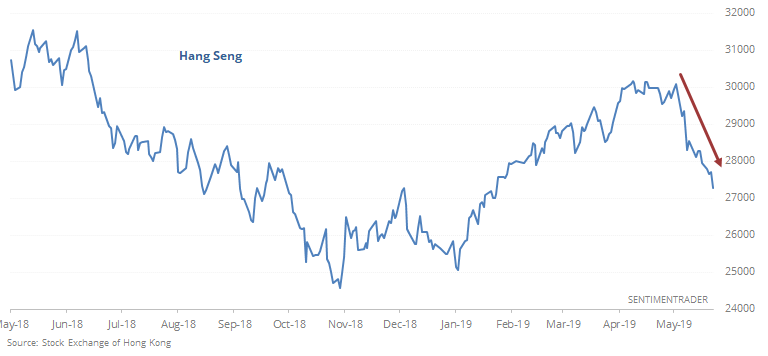
Of all the losses in recent weeks, among the worst have come in Asian-based indexes. The Hang Seng has had a particularly rough ride, almost straight down since hitting a 6-month high less than 30 days ago.

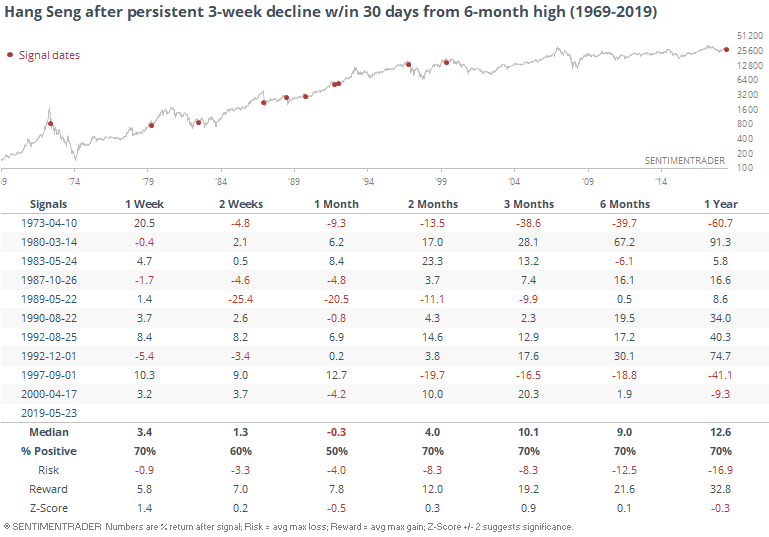
Historically, this kind of move has led to a few major losses (1973, 1989, 1997) but even more nearly immediate rebounds.

Breadth Review

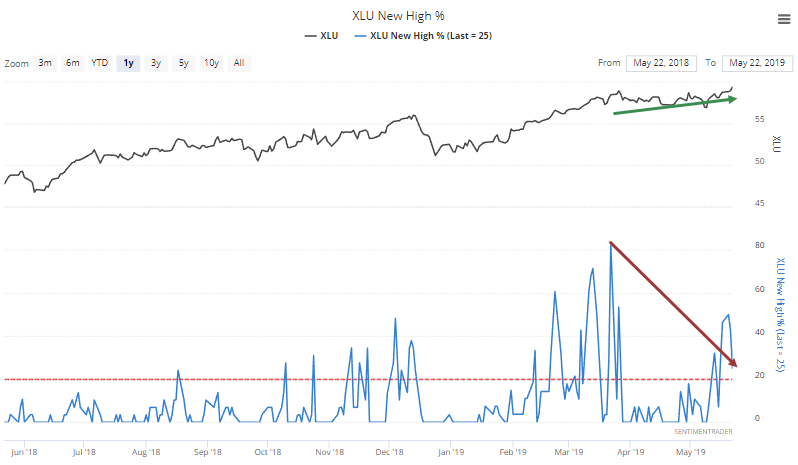
Even with the weakness in many indexes, especially overseas, there haven't been many new extremes of note. One curious development is that even though utilities jumped to a new high, not many of the stocks have gone along for the ride. Fewer than 25% of them hit a 52-week high on Wednesday. That's less than a third the number that hit a high in March.

This kind of divergence can be useful at times, but it's typically more consistent in the broader market than individual sectors. That seems to be the case here, too.

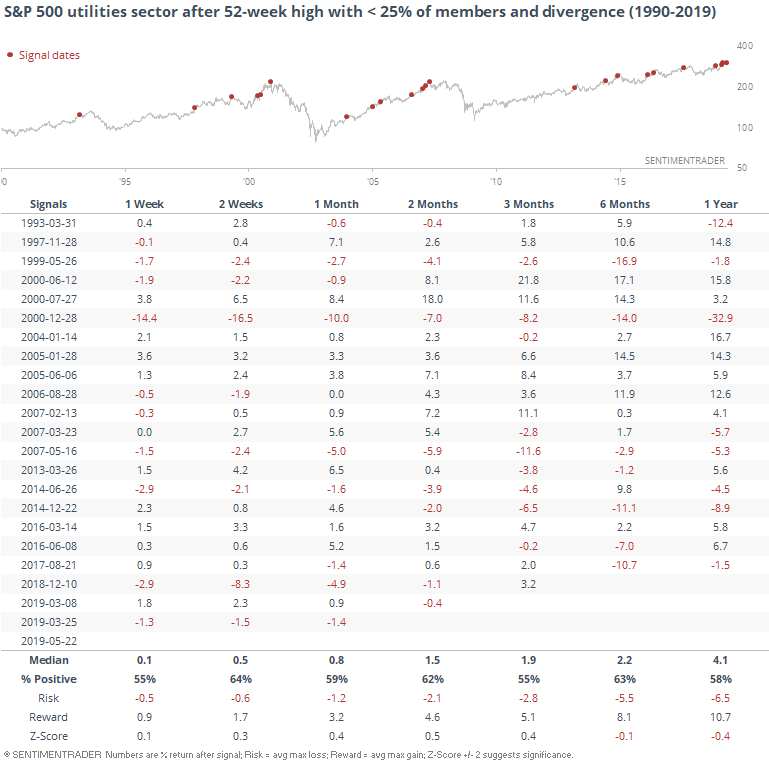
If we see a sustained push in this sector with a jump in breadth extremes, like we did in March, it would be a better caution signal for these stocks.

Sorry, you don't have access to this report

Upgrade your subscription plan to get access
Go to Dasboard
DATA &
TECHnologies
IndicatorEdge
‍
BackTestEdge
‍
Other Tools
‍
DataEdge API
RESEARCH
reports
Research Solution
‍
Reports Library
‍
actionable
Strategies
Trading Strategies
‍
Smart Stock Scanner
‍
FREE
RESOUrCES
Simple Backtest
Calculator
Simple Seasonality
Calculator
The Kelly Criterion
Calculator
Sentiment Geo Map
‍
Public Research Reports
‍
Free Webinar
COMPANY
‍
About
‍
Meet our Team
‍
In the News
‍
Testimonials
‍
Client Success Stories
Pricing
Bundle pricing
‍
Announcements
‍
FAQ
© 2024 Sundial Capital Research Inc. All rights reserved.
Setsail Marketing
TermsPrivacyAffiliate Program
Risk Disclosure: Futures and forex trading contains substantial risk and is not for every investor. An investor could potentially lose all or more than the initial investment. Risk capital is money that can be lost without jeopardizing ones’ financial security or life style. Only risk capital should be used for trading and only those with sufficient risk capital should consider trading. Past performance is not necessarily indicative of future results.

Hypothetical Performance Disclosure: Hypothetical performance results have many inherent limitations, some of which are described below. No representation is being made that any account will or is likely to achieve profits or losses similar to those shown; in fact, there are frequently sharp differences between hypothetical performance results and the actual results subsequently achieved by any particular trading program. One of the limitations of hypothetical performance results is that they are generally prepared with the benefit of hindsight. In addition, hypothetical trading does not involve financial risk, and no hypothetical trading record can completely account for the impact of financial risk of actual trading. for example, the ability to withstand losses or to adhere to a particular trading program in spite of trading losses are material points which can also adversely affect actual trading results. There are numerous other factors related to the markets in general or to the implementation of any specific trading program which cannot be fully accounted for in the preparation of hypothetical performance results and all which can adversely affect trading results.

Testimonial Disclosure: Testimonials appearing on this website may not be representative of other clients or customers and is not a guarantee of future performance or success.