
Thursday Color - Junk Flow, Stocks vs Bonds, Anxiety Alerts, Sector Breadth

Here's what's piquing my interest on a lackluster rally attempt day.
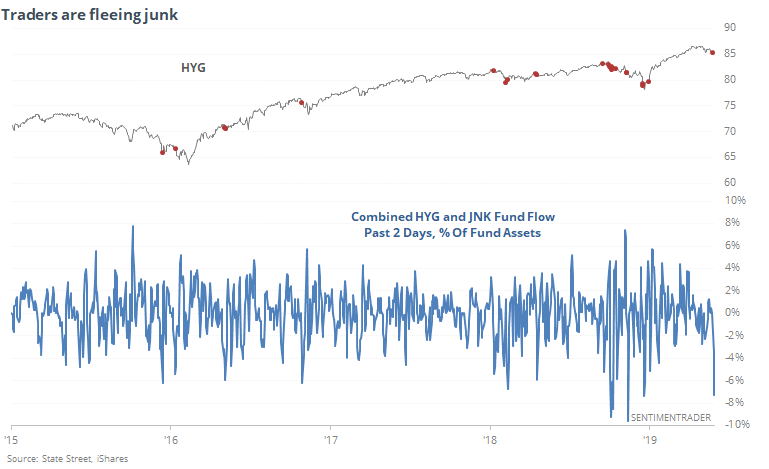
Fleeing Junk
Investors have pulled more than $1.7 billion from the two primary high-yield (junk) bond funds, HYG and JNK, over the past two sessions. That's tied for the 3rd-most outflow in their history of a little over a decade.
As a percentage of assets, it's not quite as extreme, but it still unusual to see them lose more than 5% of assets in such a short span.
Asset Comparison
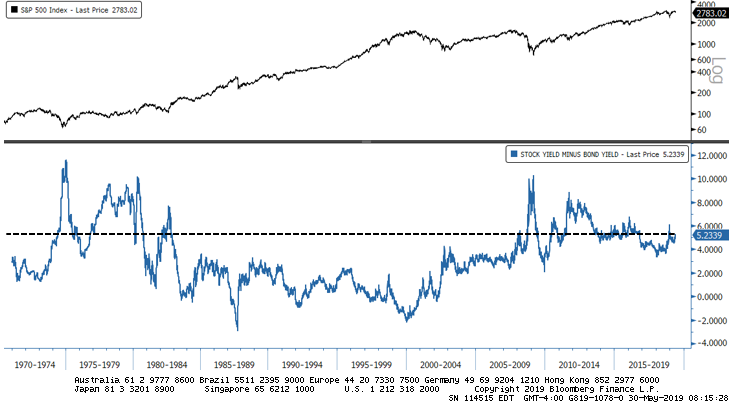
One of the most basic comparisons between assets is the yield an investor can earn on stocks (both earnings and dividends) compared to what can be earned on bonds.
As the WSJ notes, the scales have tipped toward stocks to the greatest extent so far this year.
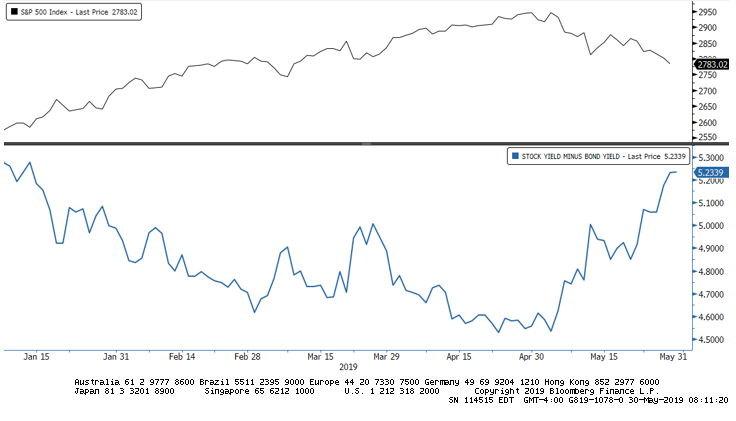
Zooming out, the recent increase in stocks' attractiveness places it among the highest readings of the past couple of years.
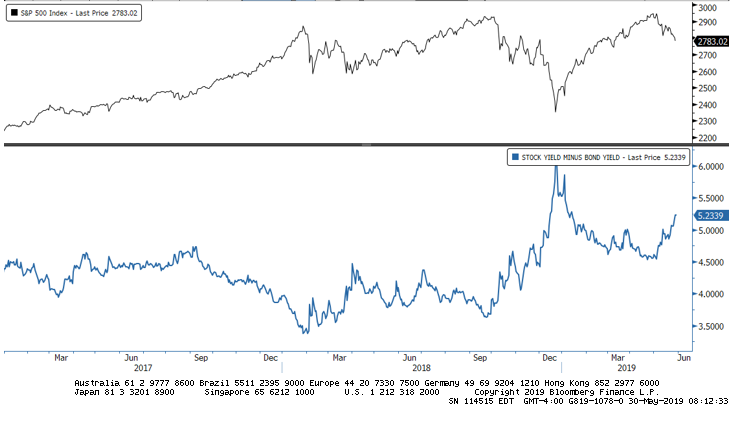
Over the past 5 years, it's only about average, though.
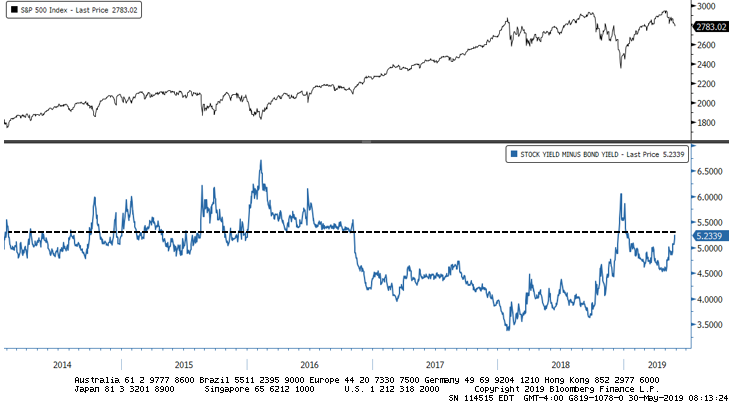
Zooming way out, we can see that it's above-average. Well ahead of anything seen during the 1980s through much of the 2000s but about half what it was at times of true pessimism. Still seems like a pretty compelling value for stocks relative to bonds.
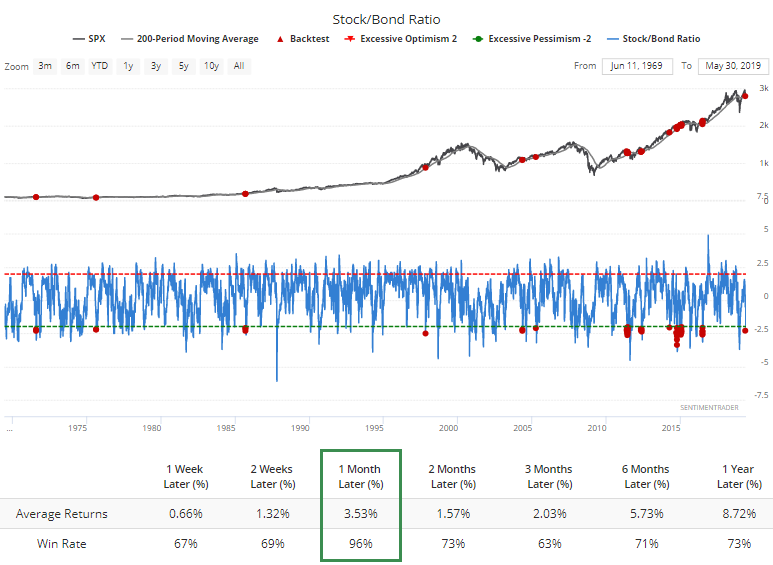
We can also see that via the Stock/Bond Ratio. It has plunged below -2 standard deviations, not something we often see when the S&P 500 is still managing to hold above its 200-day average.
Even Cheaper
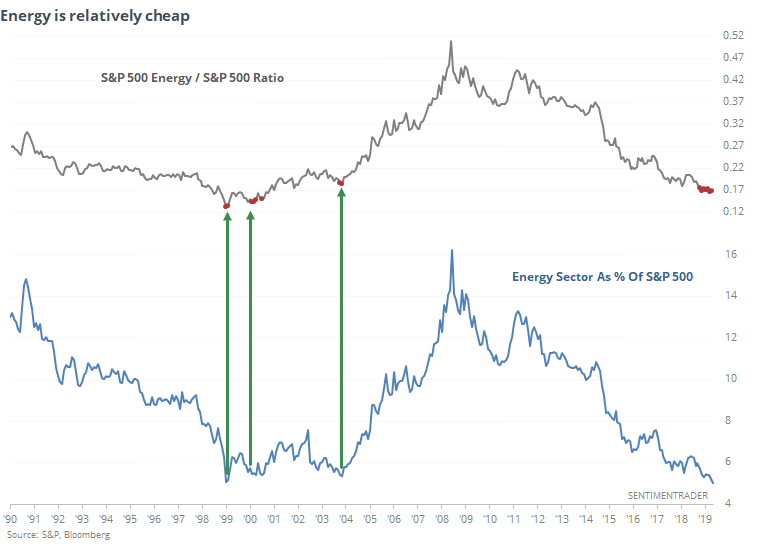
While stocks look decent as a value relative to bonds, within the S&P, few sectors have become as "cheap" as energy. When expressed as a percentage of the index, energy now accounts for barely 5% of the index, as Bloomberg notes.
Since 1990, only a few times have seen the sector at this level of unimportance. Each time, the sector bottomed in relative strength.
Options Anxiety
We saw yesterday that on the ISE exchange, traders have bought to open fewer than 75 calls for every 100 puts during the past month, nearing a record extreme.
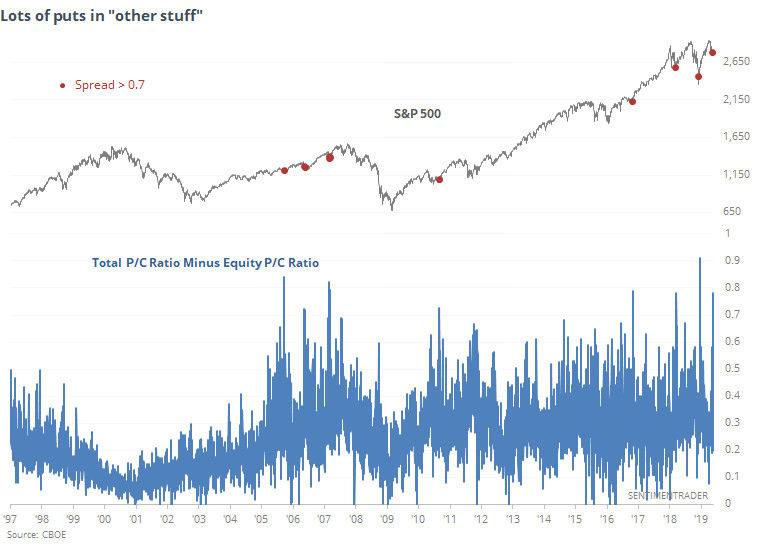
On the CBOE, there was also a lot of put activity, with the Total Put/Call Ratio showing 40% more activity in puts versus calls. Not something often seen during an uptrend.
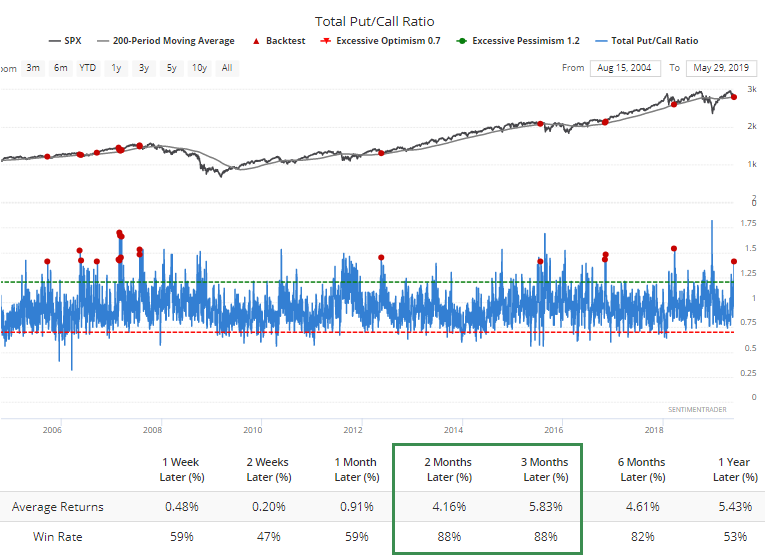
Even while the Total P/C Ratio was high, the ratio for Equities-Only was not. That means there was a lot of put trading in "other stuff" like indexes and ETFs. This was one of the widest spreads ever between the two ratios, and typically indicated a bottom in stocks.
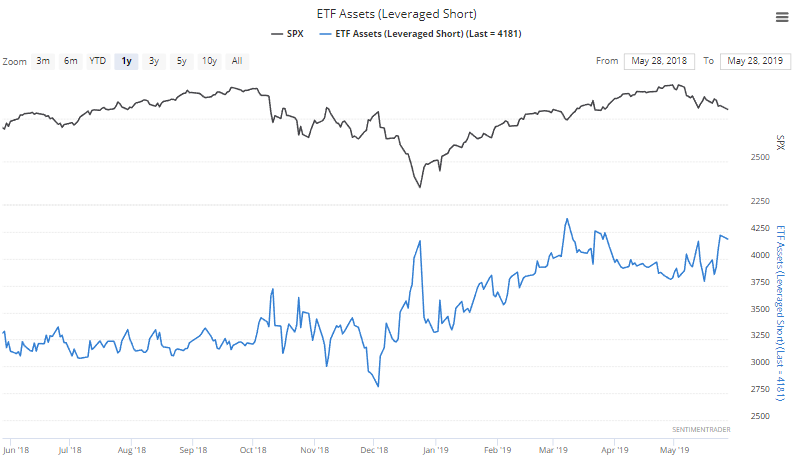
We can see more evidence of anxious behavior in the run toward leveraged funds that bet on a market decline. It's near the highest level of the year.
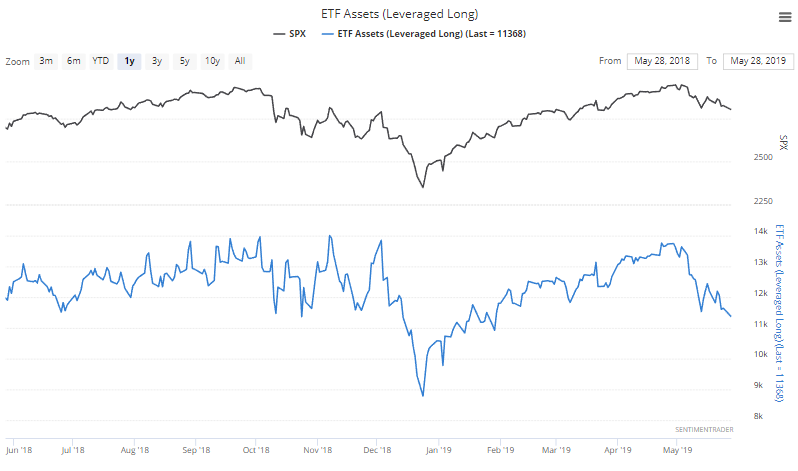
Meanwhile, traders are leaving the leveraged long funds, now at the lowest level since February.
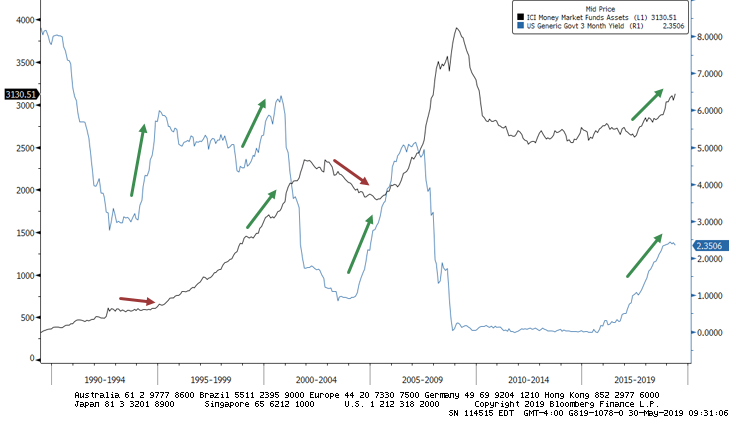
And as Reuters notes, assets in money market funds continue to soar. Investors now have more than $3.1 trillion hidden in the safety of what is essentially cash.
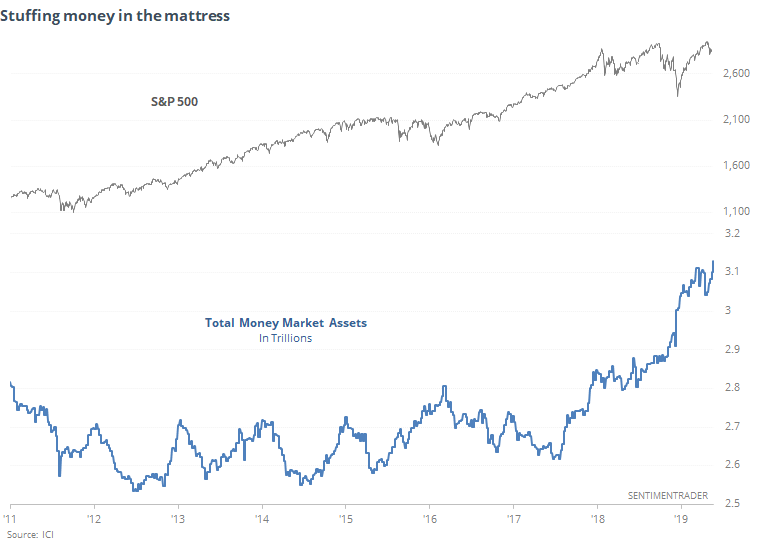
Part of that is due to investors getting a better return on their cash, but it's not the only reason. Interest rates alone don't necessarily drive the amount that investors put into money markets.
Breadth Review
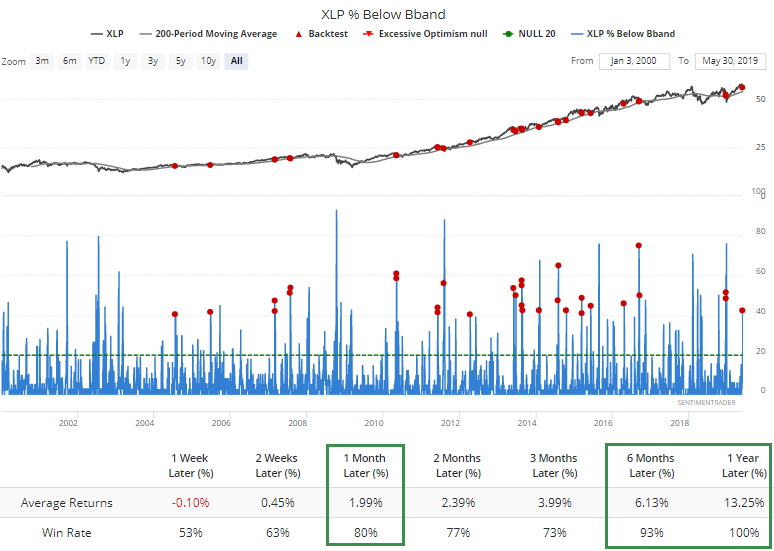
The losses yesterday furthered a few of the extremes we've already touched on. In staples, more than 40% of stocks have violated their lower volatility bands even while XLP holds above its 200-day average.
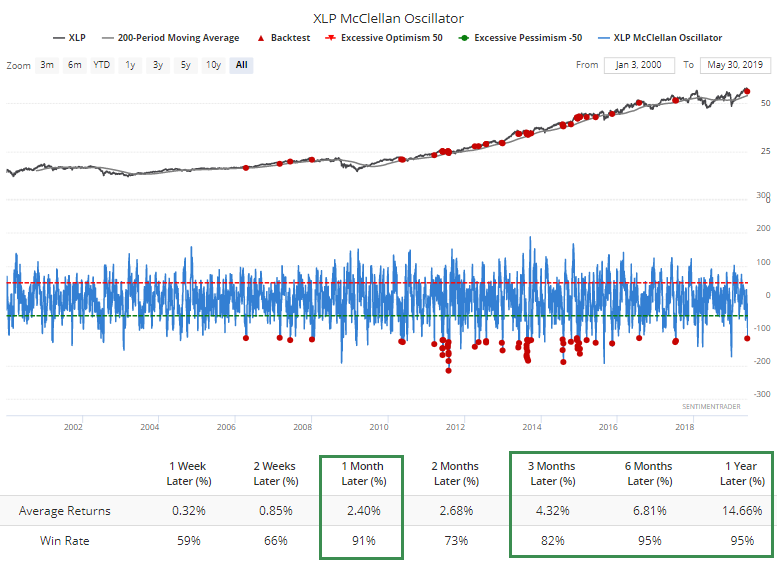
That has pushed the McClellan Oscillator below -115.
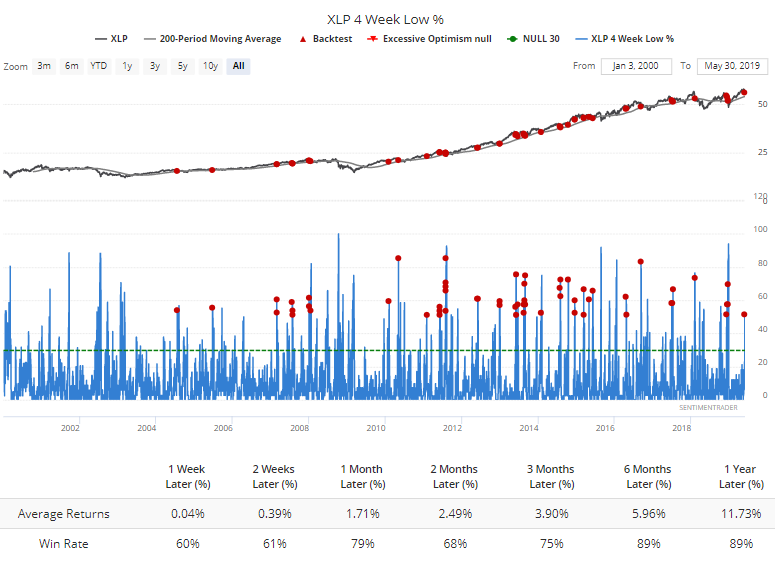
And more than half of them have fallen to at least a one-month low.
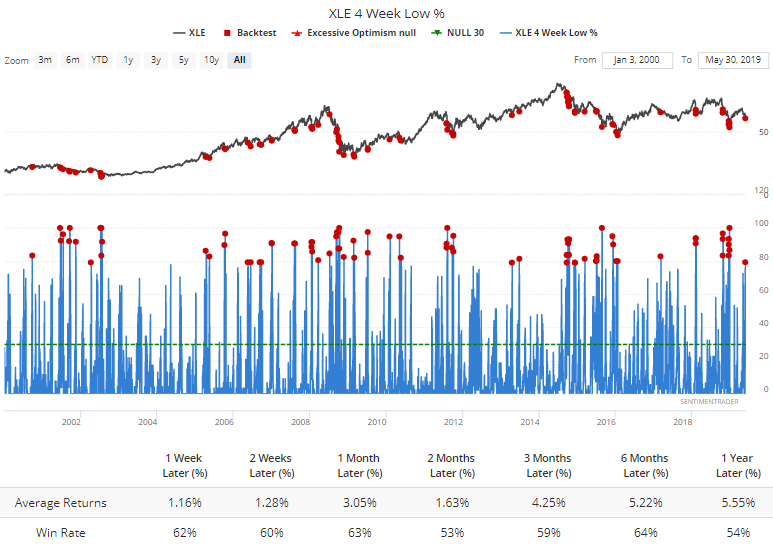
Swinging back to energy stocks, they're the most washed-out sector right now, but not to a level that has consistently preceded rebounds yet, mainly because the stocks are embedded in a downtrend and that typically takes heavier extremes.
Nearly 80% of them have sunk to one-month lows.
More than 65% of them have sunk to multi-month lows.
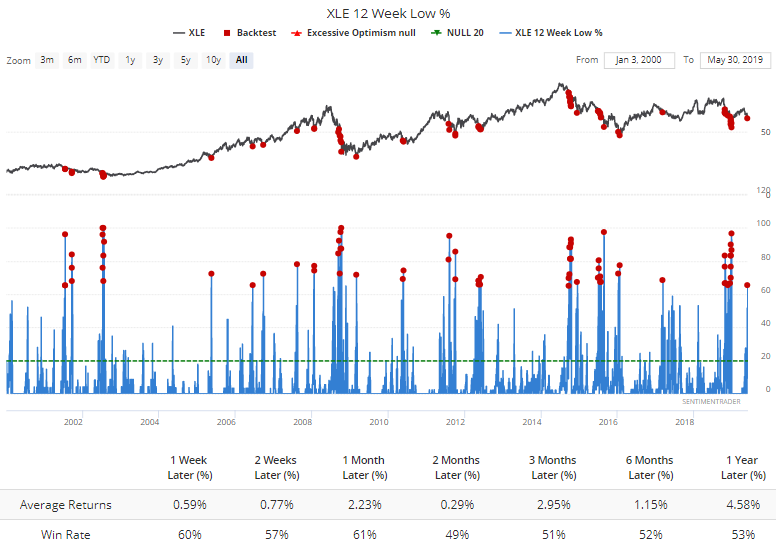
The readings are "getting there" but not quite to the puke-level thresholds that would define a better risk/reward setup.