Thursday Color - Turmoil, Double Losses, Recession Talk, Financials, Sectors

Here's what's piquing my interest so far during this tentative recovery attempt.
Fear Mongering
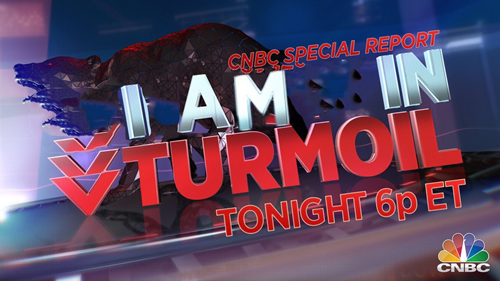
Perhaps there is no greater sign of the anxiety among investors than when the television channel most geared toward unsophisticated investors runs a special report highlighting the volatility.
Red colors, down arrows, plunging markets, alarm bells, growling bears. Throw it all on the screen to make sure people tune in.
The vast majority of the time, the fear-mongering has cost investors precious opportunities. It was especially prevalent during the height of the financial crisis, but also since the channel started running these specials in 2010, we can see the S&P's forward returns below.
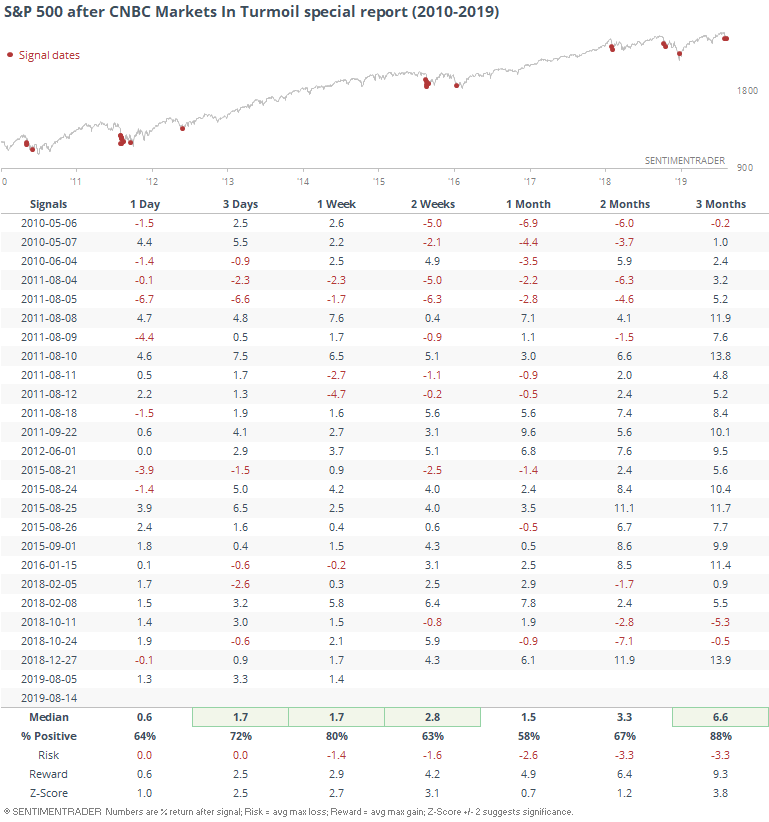
It's not like the specials automatically triggered a low. Often they started running them when volatility first started to generate attention, and in 2010 and 2011 stocks continued lower for several weeks before rebounding strongly.
Depending on one's time frame, an argument could be made that the specials kinda-sorta helped, as long as you panicked along with them at the right time and then stepped back in at the right time too. Unfortunately, I don't think they run "back back in now" special reports at those times.
Big Moves
It's easy to see why volatility is suddenly a popular topic, since we've seen a lot of it. Yesterday we looked at other times when the S&P 500 moved more than 1% intraday for 11 straight sessions, and two of those have been very large losses.
It's extremely rare to see such large declines in close proximity within only a few weeks of the S&P having been at an all-time high.
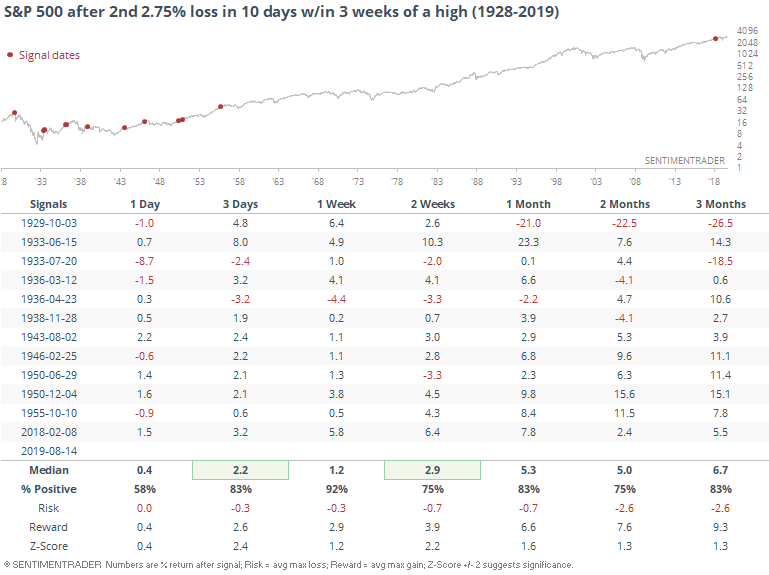
The only time the S&P was still within 7% of its high at the time in modern markets was the instance in December 1950. For what it's worth, the S&P turned higher immediately afterward.
It's also been rare to see such a cluster of big losses when the S&P still hadn't entered a correction yet, still holding to within 10% of its peak after the 2nd big down day.
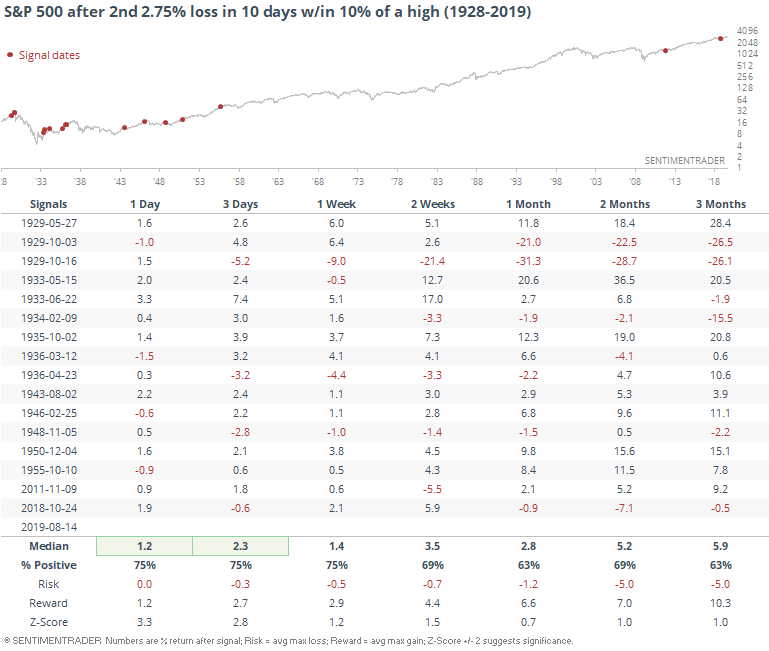
Also when it's still holding above its 200-day average.
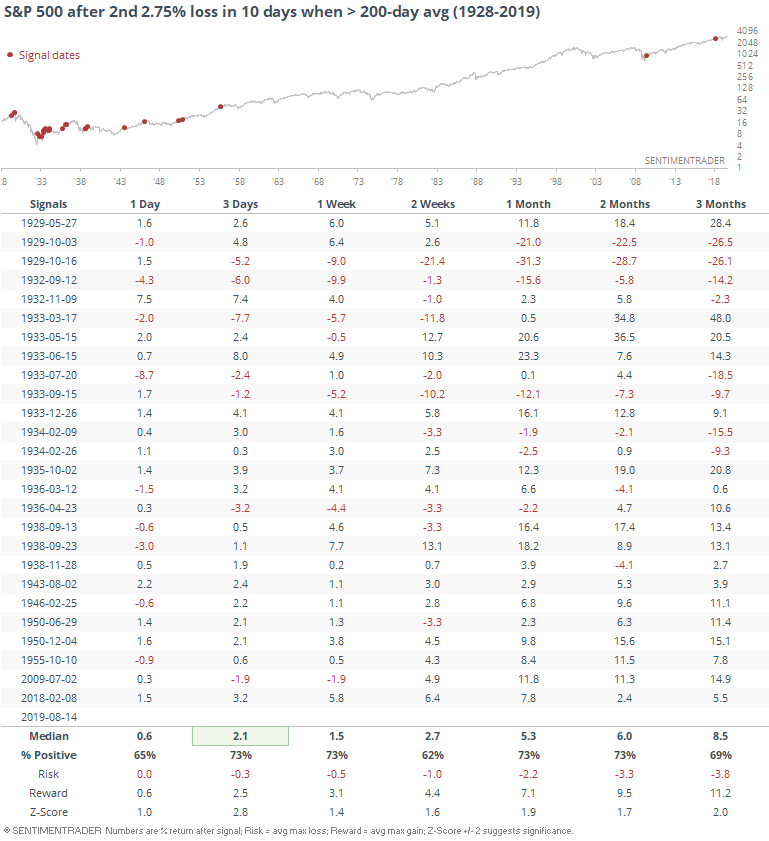
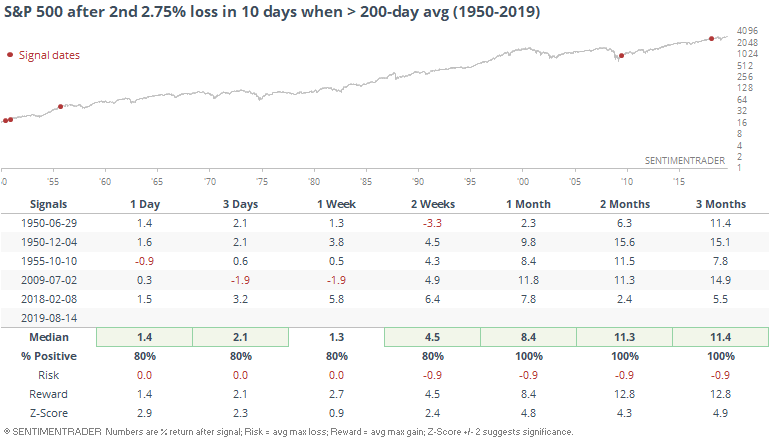
If we accept the idea that "modern markets" didn't exist until 1950ish, then we can truly see just how unusual this kind of behavior has been.
Bank Bust
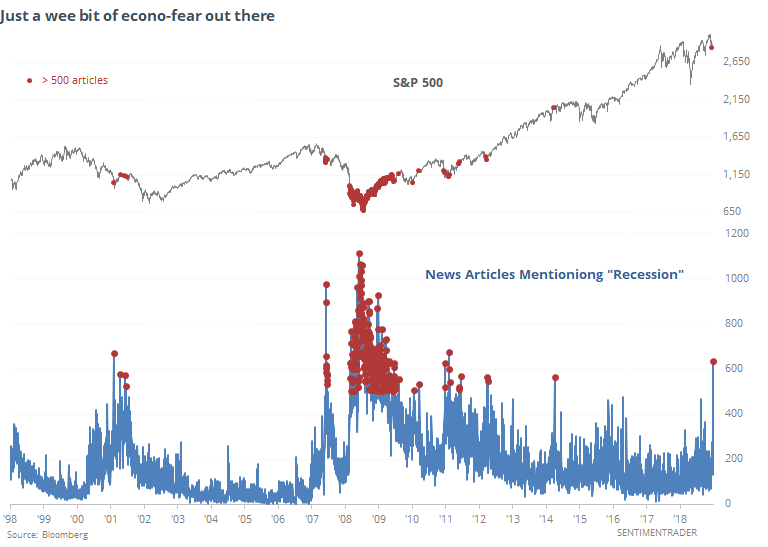
One of the primary drivers of Wednesday's decline was financials. It's hard to blame quick-fingered investors, when the media was absolutely inundated with "recession" talk.
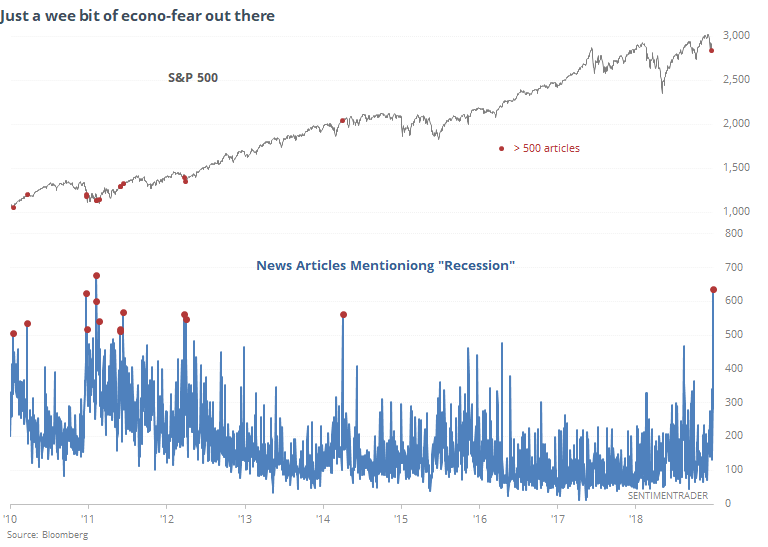
Even over the past 20 years, it's been rare to see this much of a focus on the topic.
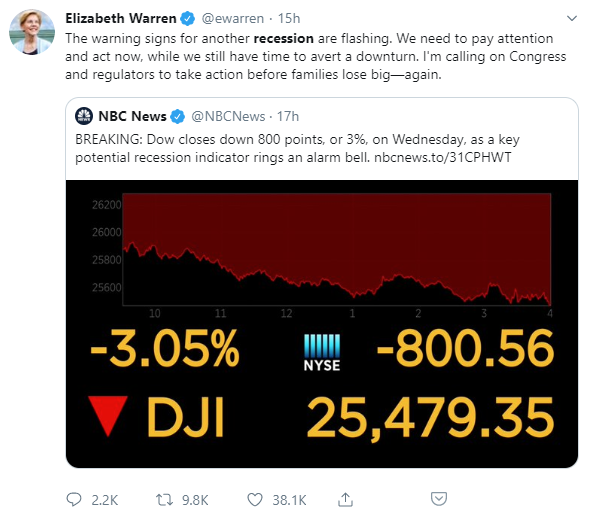
Of course, the opportunists can't miss an opening.
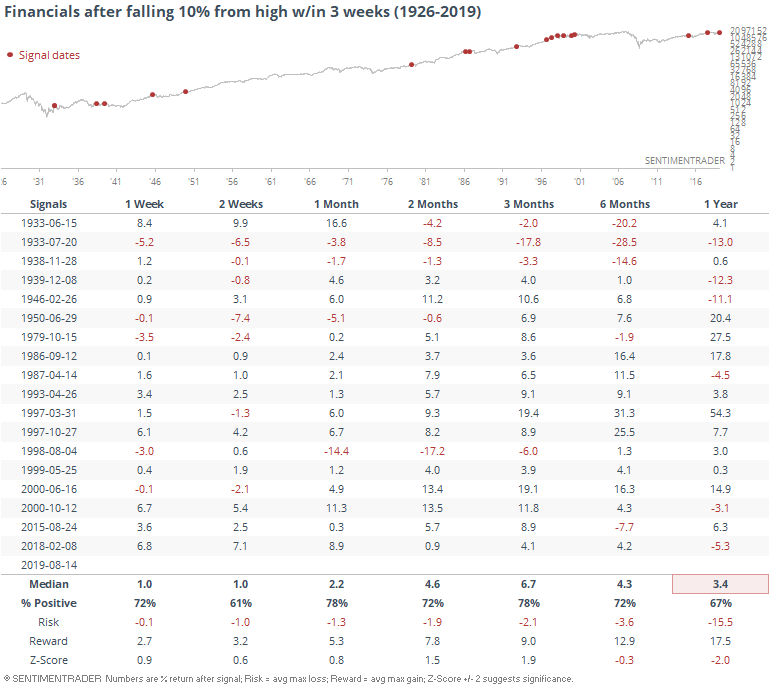
The drumbeat of negativity helped trigger a quick change in financials. The S&P 500 financial sector got to within spitting distance of a 52-week high less than 3 weeks ago, but yesterday pushed them back into correction territory, if we accept a 10% decline as the definition.
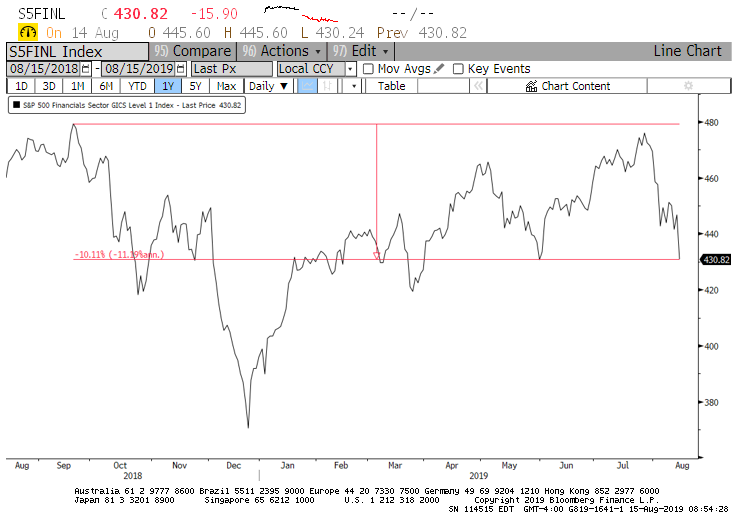
That's an awfully quick trip from almost-new-high to correction for the sector. Whenever that group of stocks falls so far, so fast, anyone who experienced 2008 immediately conjures a nightmare scenario of a repeat.
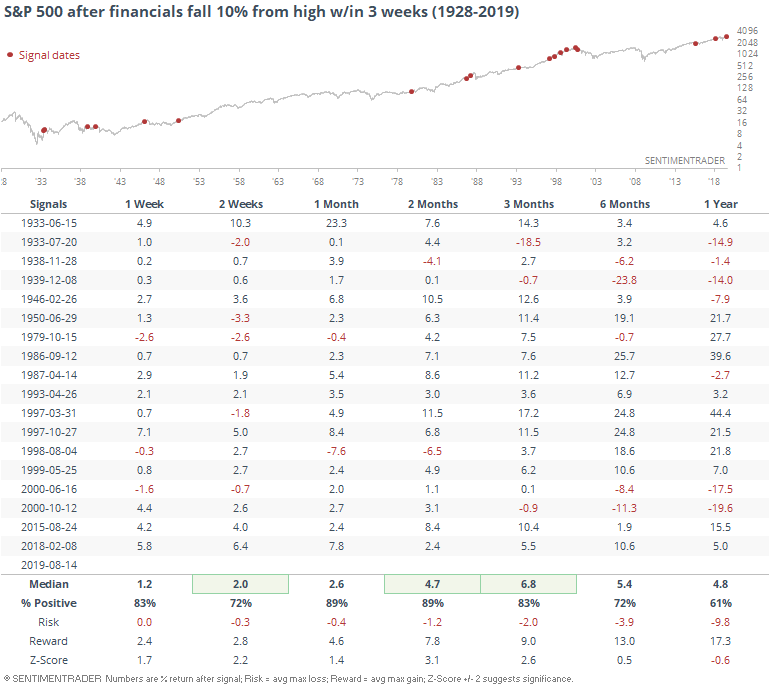
Historically, it has led to almost uninterrupted upside for the broader market, though. At least for the short- to medium-term.
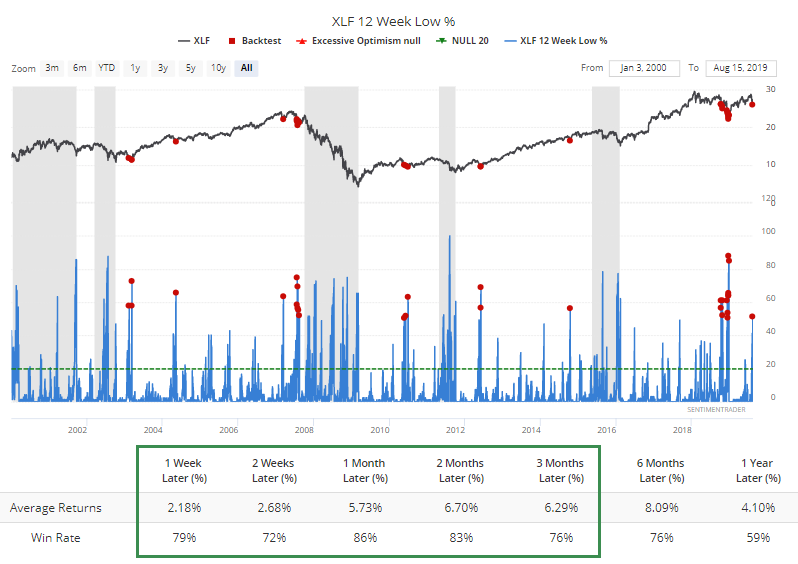
Financials themselves didn't hold up quite so well.
The losses pushed more than half of financials to new multi-month lows. That's severe, even including the financial crisis.
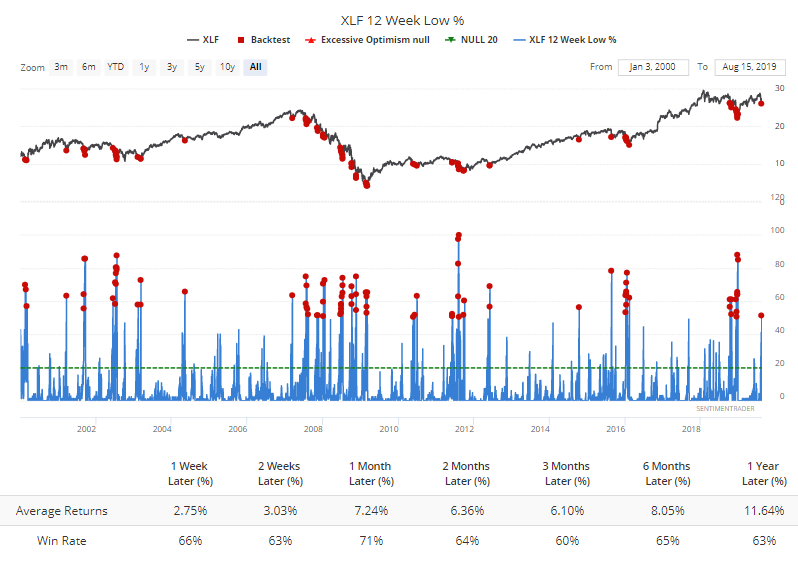
If we make the assumption that we're still in a bull market environment, then this kind of widespread selling in the sector has led to almost universally positive outcomes.
Strained Relationship
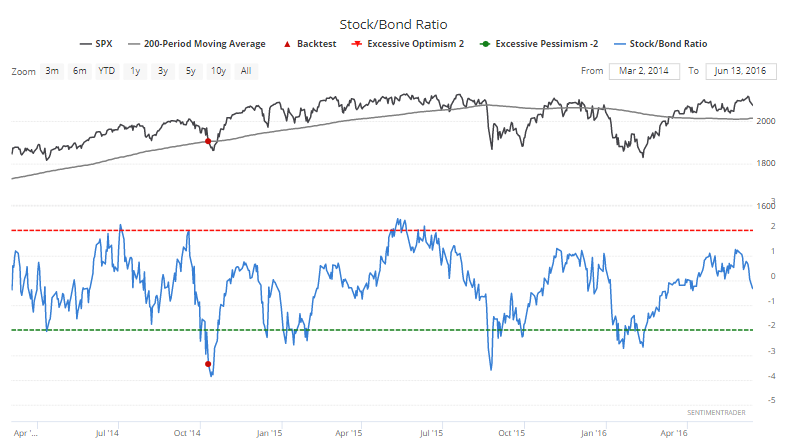
The outsized moves in both stocks and bonds pushed the Stock/Bond Ratio further into extreme territory, exceeding -3. The only times it got this stretched and stocks still showed losses over the next month were during the aftermath of two of the most traumatic events in the history of modern markets - the '87 crash and the height of the financial crisis in October '08.
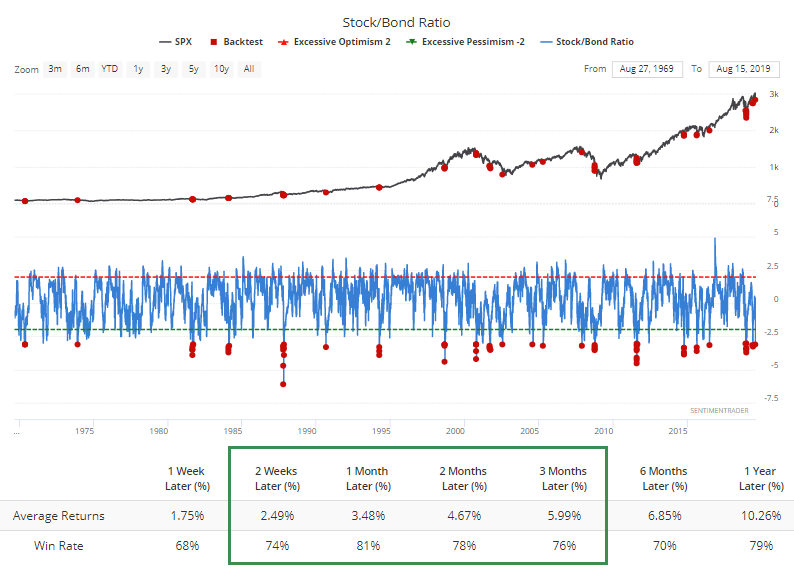
The only time in history it moved below -3 when the S&P was still holding above its 200-day average was October 10, 2014.
Emerging Market Trouble
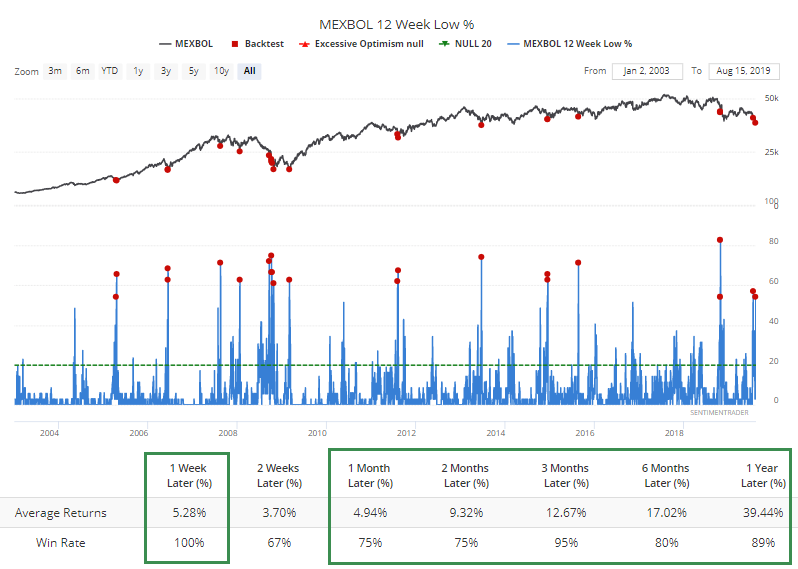
Some of the hardest-hit areas have been emerging markets. Among stocks on the Mexican Mexbol index, there was another surge in stocks sliding to multi-month lows. The index has typically rebounded afterward.
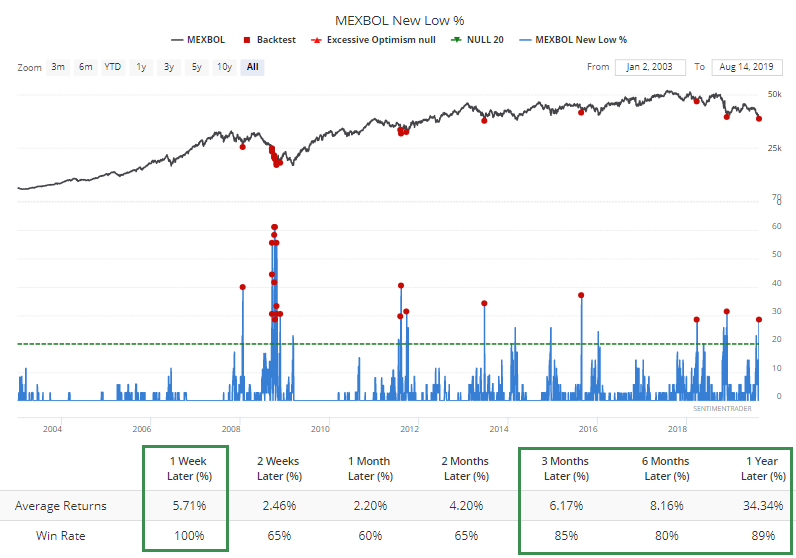
Same goes for when nearly 30% of them hit 52-week lows at the same time.
Usual Suspects
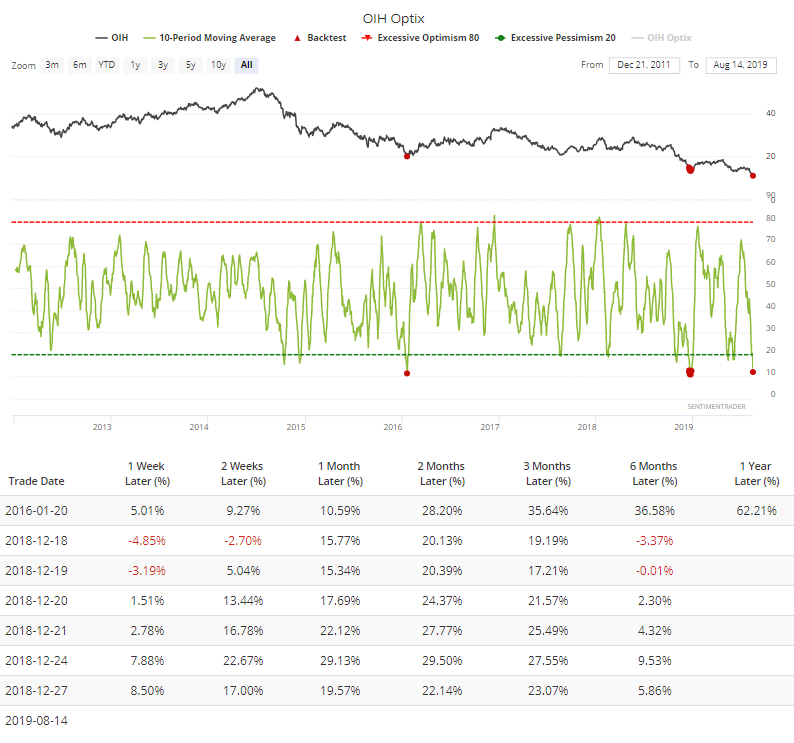
The Heatmap shows the usual suspects hitting extreme levels of sentiment yesterday, with bonds and gold in the upper-left. True extremes there. Energy-related funds have also been clustering in the bottom-right, showing extreme pessimism.
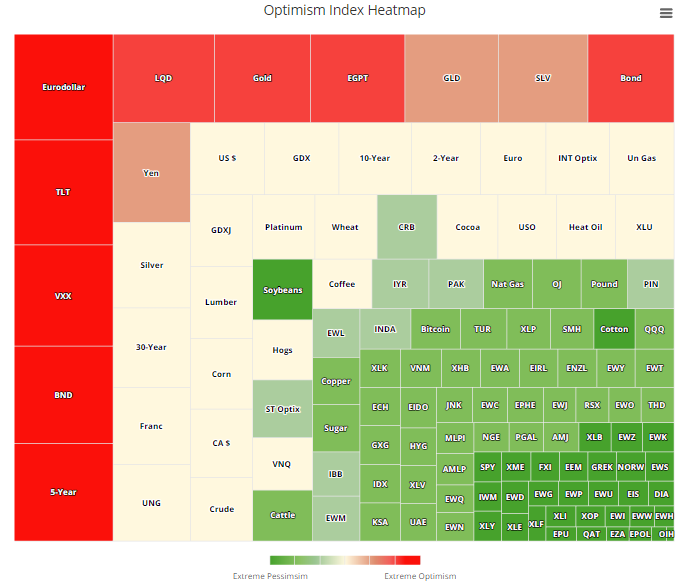
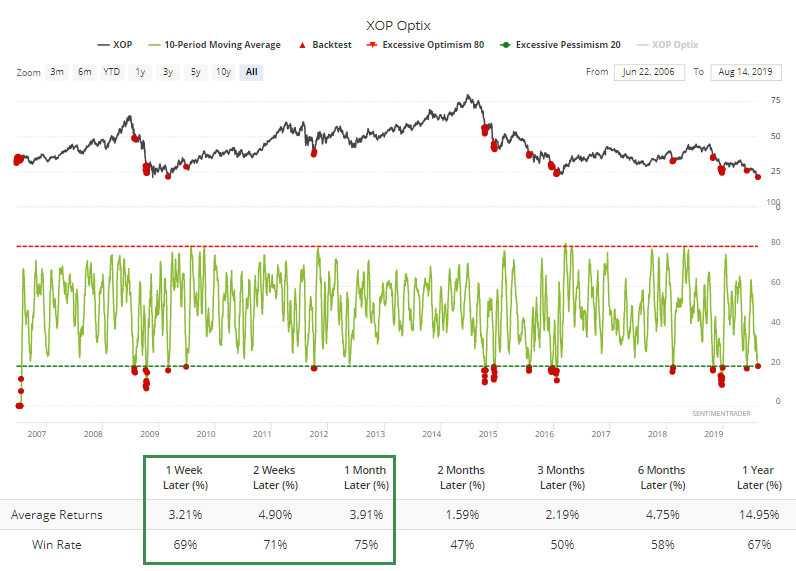
The oil services fund is showing a pretty drastic drop in optimism over the past 2 weeks. According to the Backtest Engine, it's only been this bad twice before.
It's gotten quite low for the explorers, too, but has been more extreme. Still a moderately strong tendency to rebound shorter-term.