
Thursday Color - Fading 'Mo, Energy Stock Drop, Titanic Signal, Cotton, Euro Junk

Here's what's piquing my interest on what's starting out to be a minor hangover from yesterday's pressure.
Breadth Review
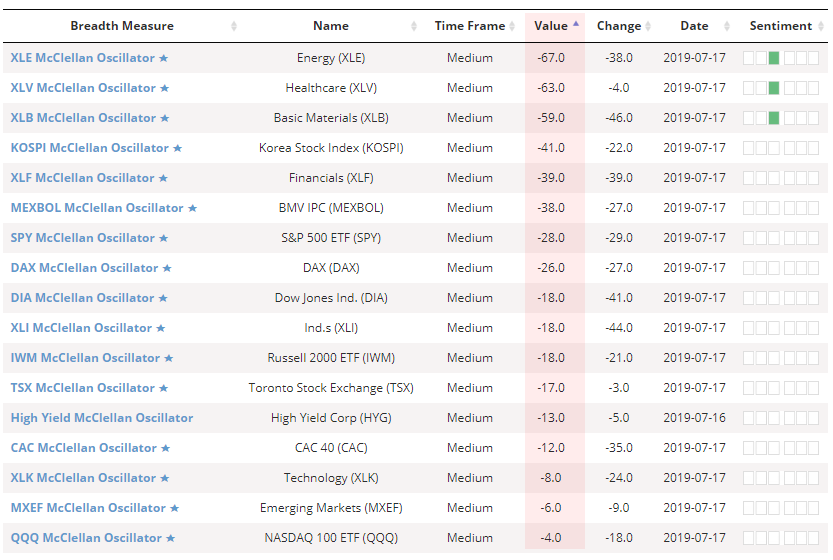
Across sectors and indexes, breadth underlying the recent rally has been ebbing, and most of the McClellan Oscillators we track are now below zero.
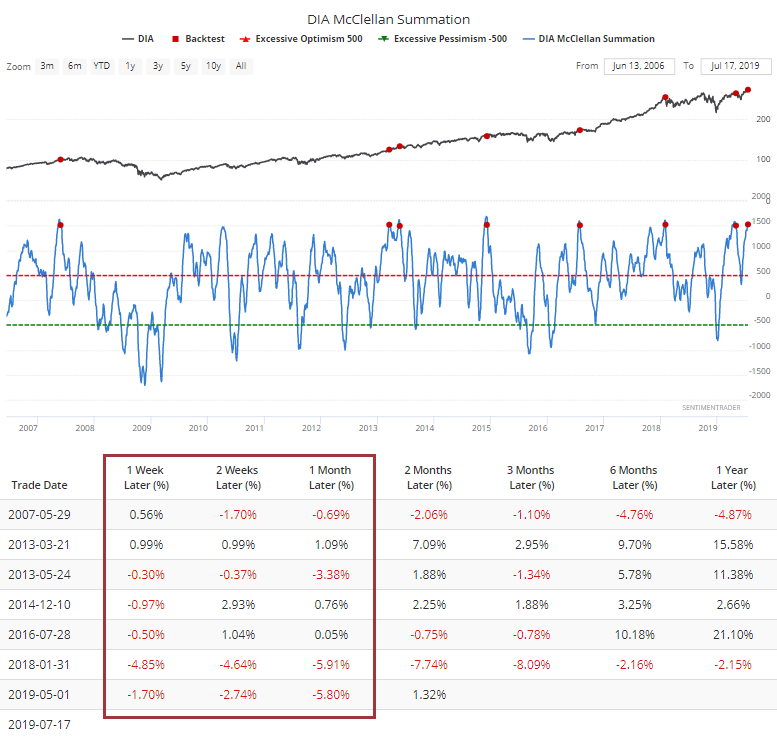
This means that the longer-term Summation Index should start to roll over, which they have. For the Dow Industrials, the index has dropped below 1525. Per the Backtest Engine, this loss of momentum has preceded some shorter-term fits. Only the signal in 2013 managed to escape unscathed.
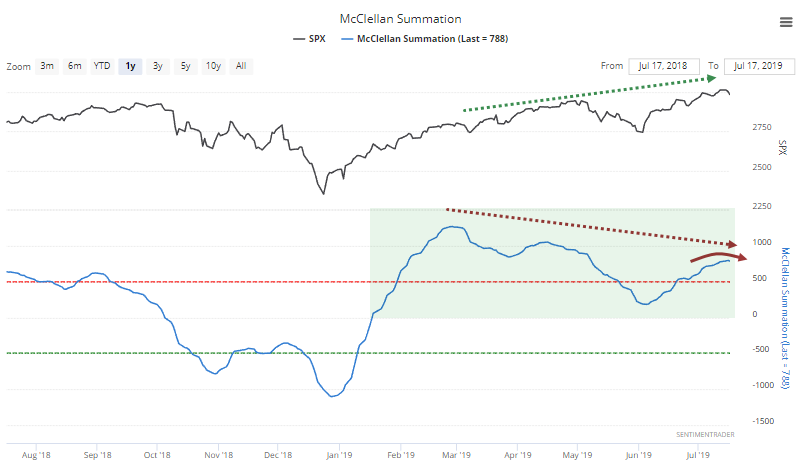
For the broader market, the McClellan Summation Index has been diverging from indexes like the S&P 500, making a lower high while the index made a higher high. Historically, that hasn't been a consistent problem. But it's also starting to roll over from a relatively high level, and it's been above the zero line since January.
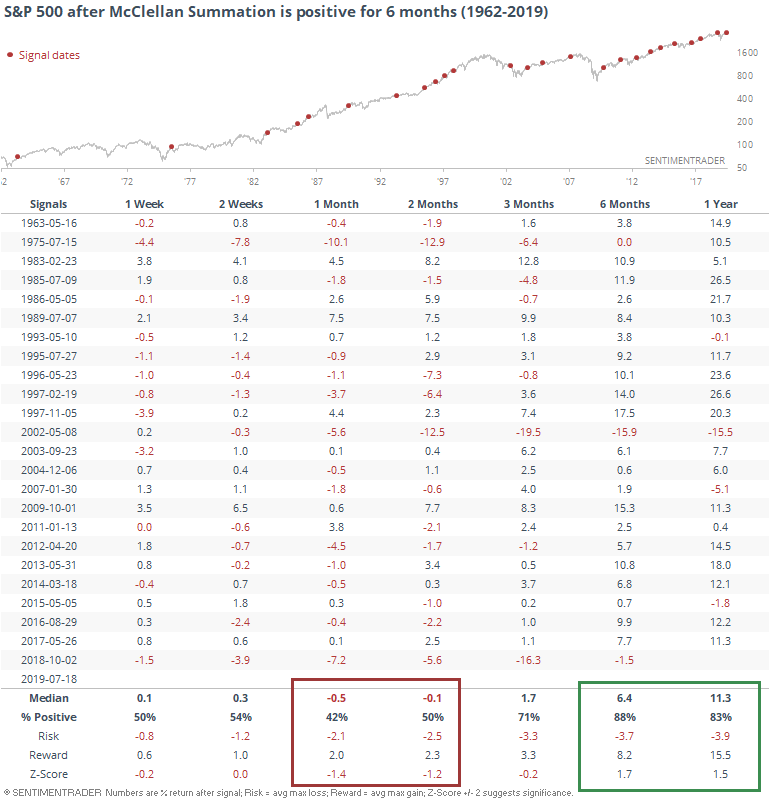
Lasting 6 months in positive territory is an impressive feat of persistence. That hasn't prevented declines over the next 1-2 months, in fact that was the norm, but like most displays of persistence, longer-term returns were above average.
Within sectors, the drop in oil and energy stocks was enough to push more than 30% of them below their lower Bollinger Bands. That's high, but has gotten much higher during times of outright panic. Forward returns were unremarkable.
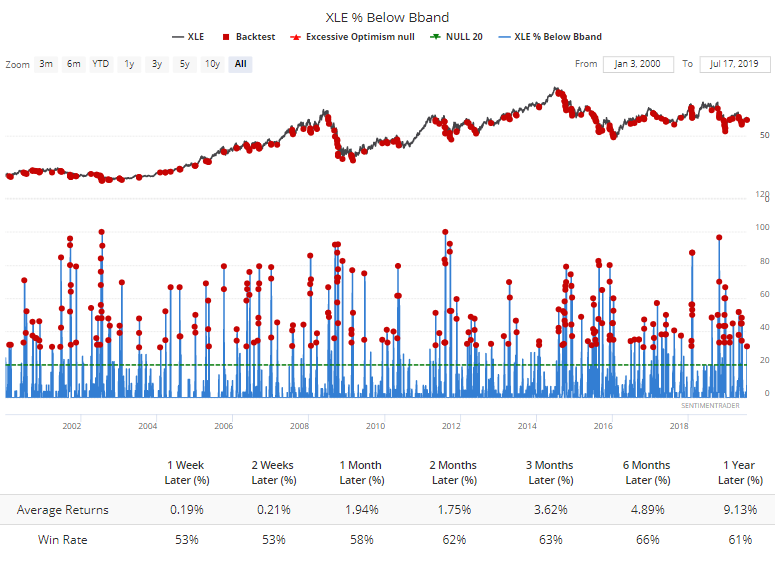
What's more interesting is how investors in the sector have behaved in recent years. When we see this kind of a plunge in energy stocks, buyers in XLE have either stepped in immediately, or...not. When they have, they tended to continue. When they didn't, they tended to keep staying away for a while.
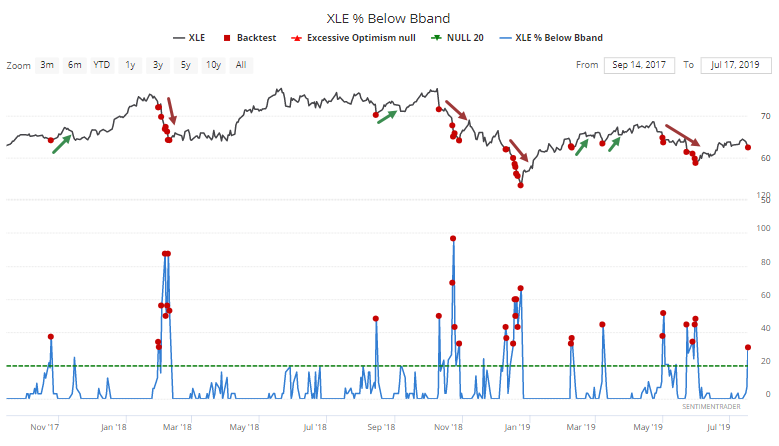
When they decided to stay away, it took an extreme of 50% or more of stocks dropping below their band before it found a bottom. This suggests that the next few days should be telling, with more selling in the sector likely leading to even more selling in the weeks ahead, or at least until we see a much bigger oversold extreme.
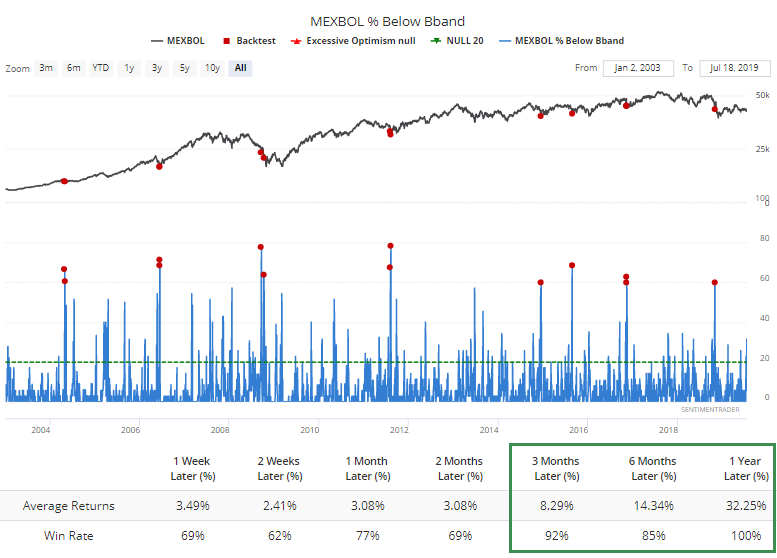
Outside the U.S., the only compelling development was a spike in the number of Mexican stocks also dropping below their lower volatility bands. It's extreme enough that it has preceded very positive medium- to long-term returns.
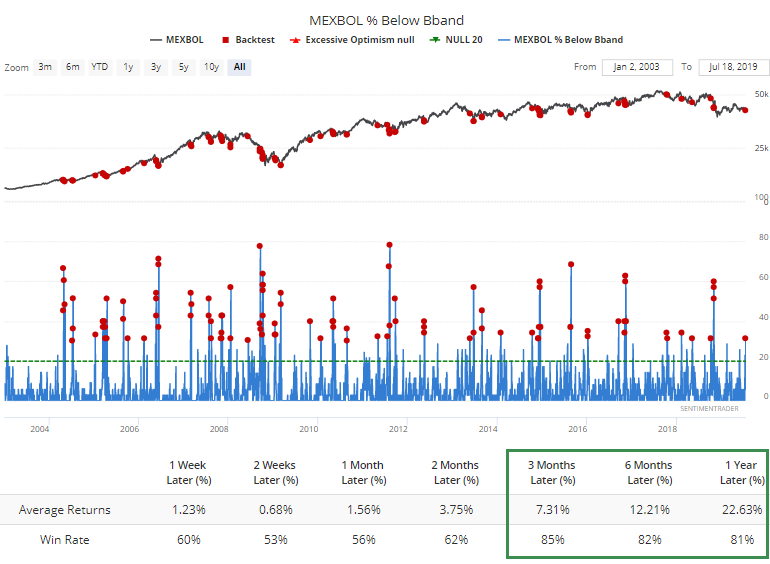
Even better would be if it spikes to 60% or more of all issues. That's the kind of extreme that has led to excellent long-term long setups.
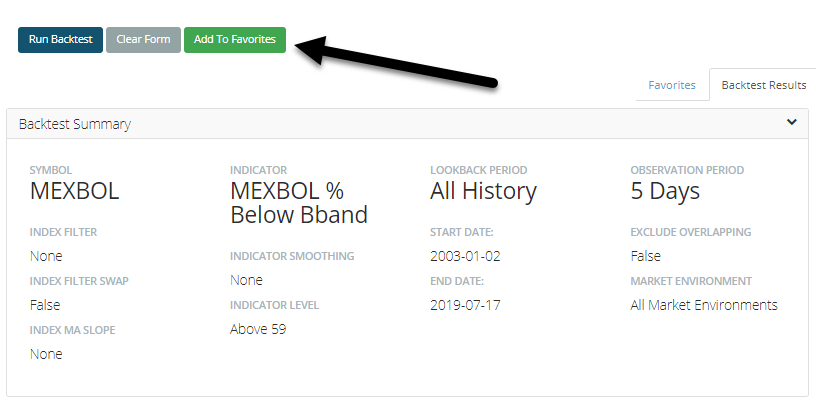
If you want to be alerted when that happens, you can run the backtest, then click Add To Favorites, then give it a name in the box that pops up.
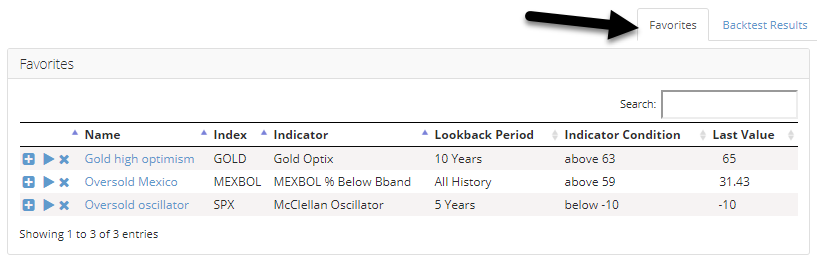
If you go to the Backtest Engine page and then click the Favorites tab, all of your saved backtests will show up, with the indicator condition and its latest value.
Even better, you can sign up for the Evening Digest.
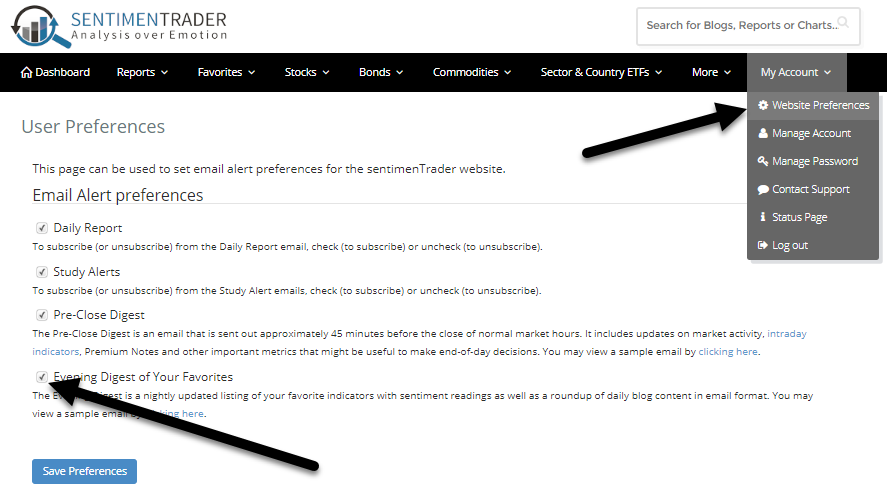
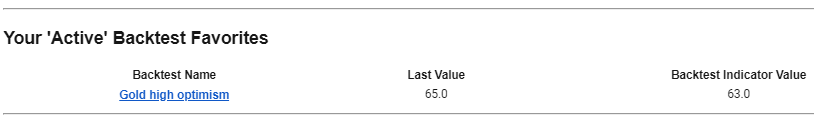
This will send you an email highlighting any content posted during the day, a summary of the current value of your Favorite charts, and now also an alert if any of your favorited backtests have triggered. Here's a snippet of mine from yesterday, which alerts me that a test I set up showing gold's Optimism Index above 63 is active.
Titanic Worry
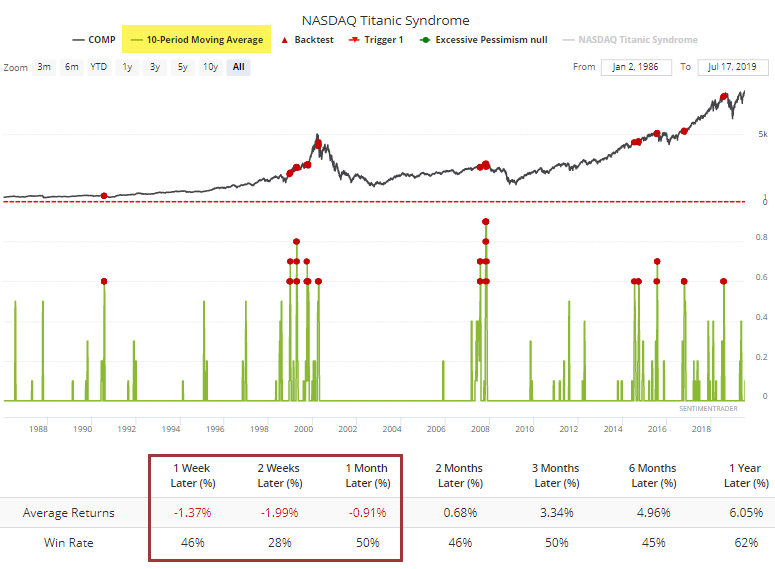
On the Nasdaq, the Composite index was just at a new high, but on Wednesday there were more stocks sinking to a 52-week low than a 52-week high. That triggered a Titanic Syndrome signal. Make fun of the name if you will, but it does highlight a little bit of trouble underlying the market.
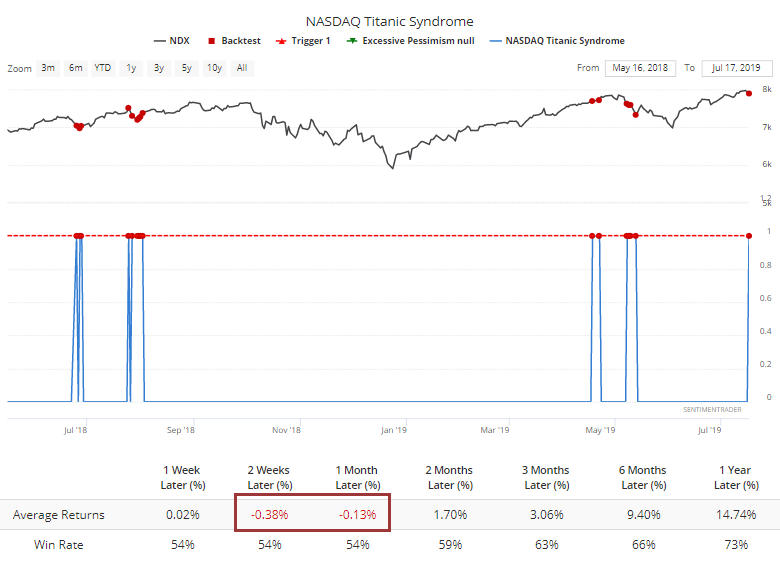
If we start to see more of these, it will be an even worse sign. If there is more than 1 signal every couple of days, it has preceded some very weak shorter-term returns for the Composite.
The Fabric Of Our Lives
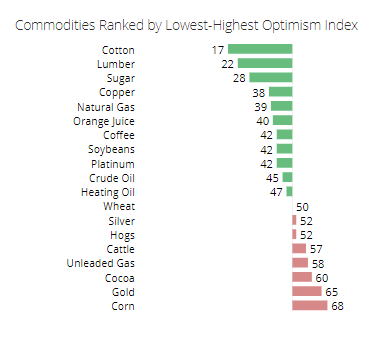
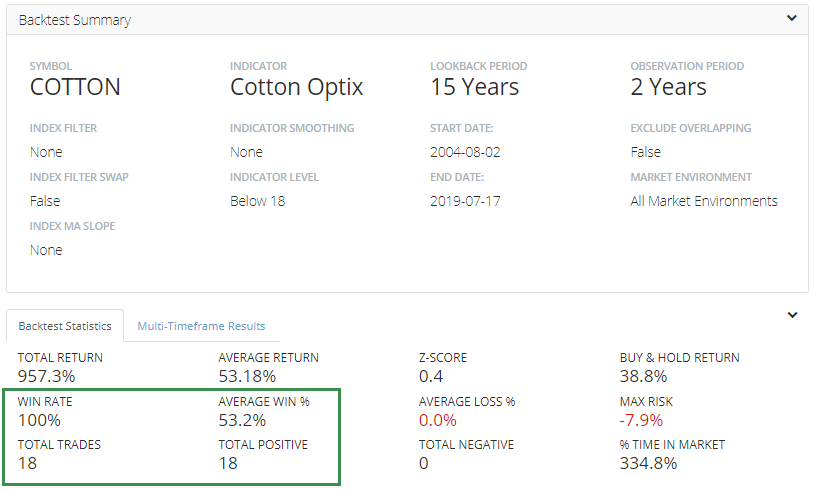
Among commodities, cotton has now moved into the position of most-hated with an Optimism Index below 18.
A reading this low has led to positive returns, but not very consistently.
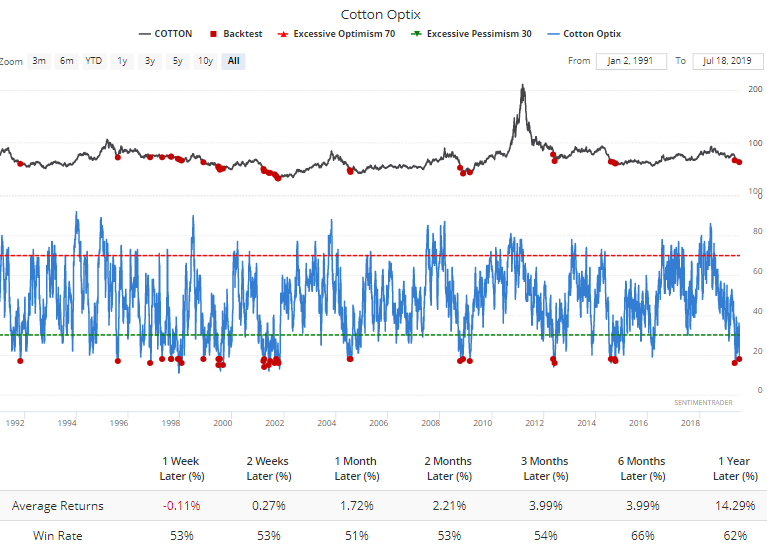
It's been better on a long time frame over the past 15 years.
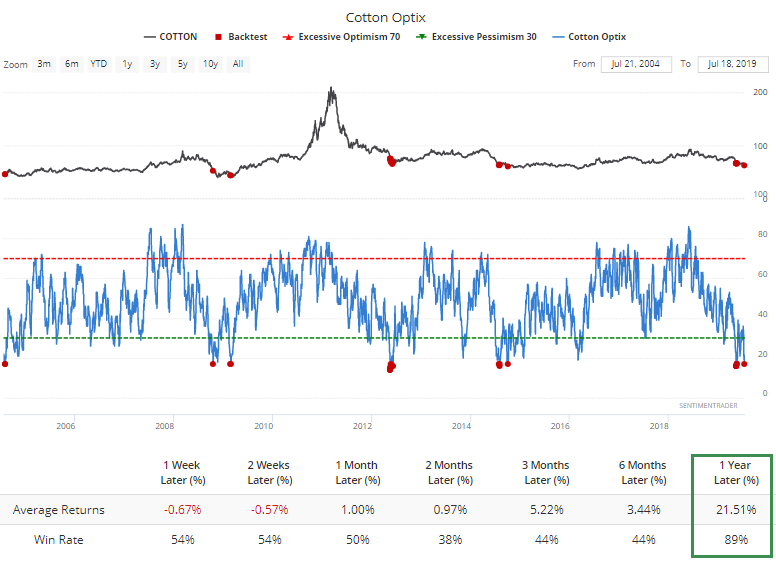
For those with a long enough time frame, over the next 2 years, cotton returned an average of more than 50% and was 18 for 18.
European Junk
Bloomberg notes that traders have piling into junk bonds, especially overseas. The IHYG fund has enjoyed a huge inflow in recent weeks.
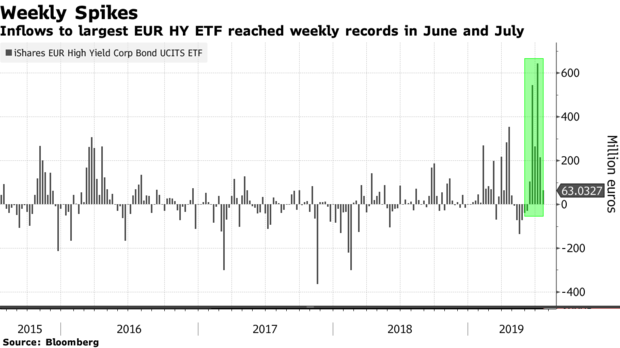
As a percentage of its assets, it has added about 25% to its base over the past month. That's among the largest in its history. Fund flows can be tricky things, though, and it hasn't necessarily been a contrary indicator.
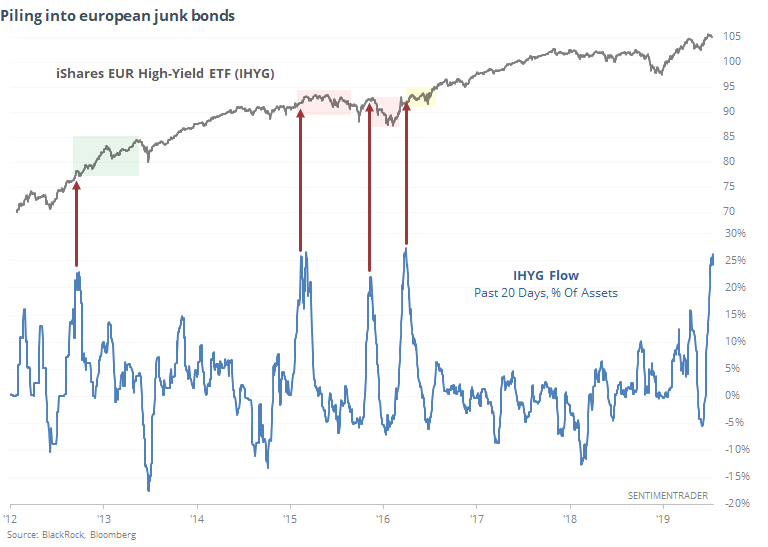
Typically when we see piling-in behavior like this, it depends where in the cycle we are. When it happens and a fund is coming out of a protracted decline, it is consistently a positive sign of risk appetite coming back into the market. When it happens after a prolonged rally, it is a more consistent sign of excessive optimism that tends to get worn off in the weeks and months ahead. We're arguably more in the latter camp than former.