
Thursday Color - Dovish Fed, Sector Extremes, Round #, Value Line Lag, Twitter Bulls

Here's what's piquing my interest on what so far is looking like a very narrow-range day.
When Doves Fly
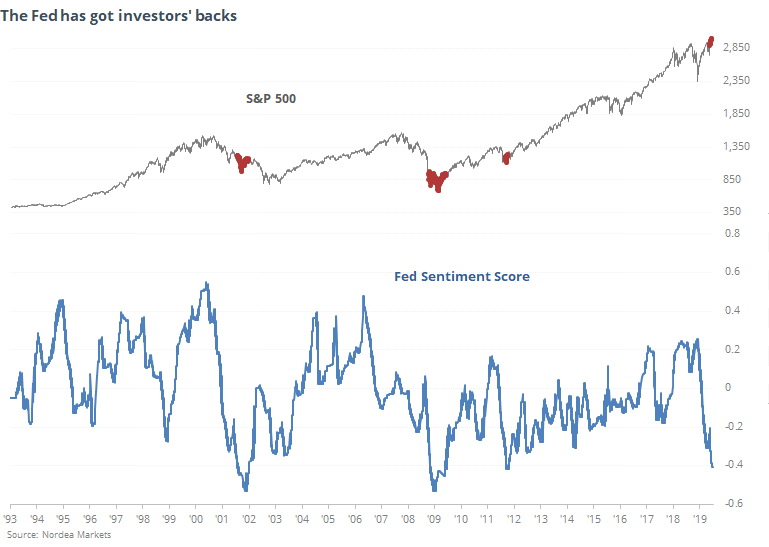
According to a note from Nordea Markets, the Fed has become the most dovish since 2009. This is based on the language the Fed uses in statements to the public, with a "dovish" bent meaning they are leaning more toward lower rates and easier monetary conditions.
We can see below that extremely dovish Fed talk helped spur massive rallies in 2009 and 2012, but wasn't enough to stop the bursting of the bubble during the 2001-02 bear market.
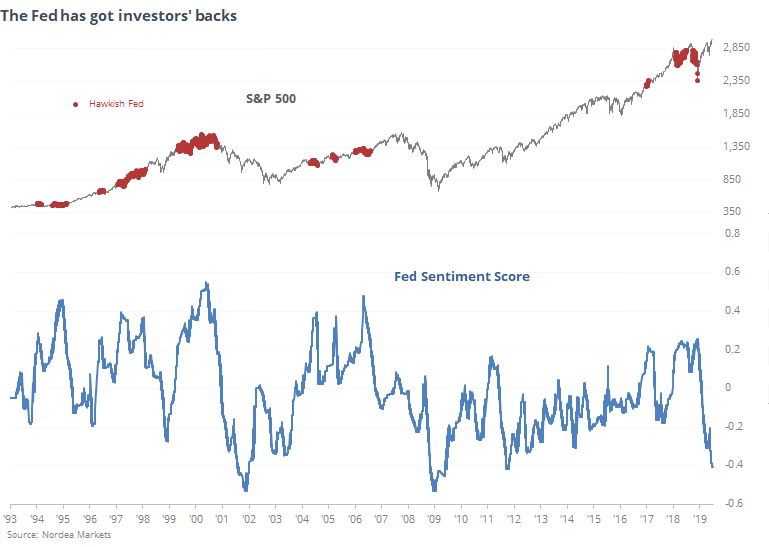
When the Fed was hawkish, it was not necessarily a good reason for investors to sell, but returns were less consistent.
The S&P 500's annualized return when Nordea's sentiment score was -0.3 or below was +13.9%. When it was +0.3 or above, those returns fell to only +1.3%.
"Don't fight the Fed" has been a market mantra for decades, and right now it looks like bears who are doing the fighting.
Sector Breadth
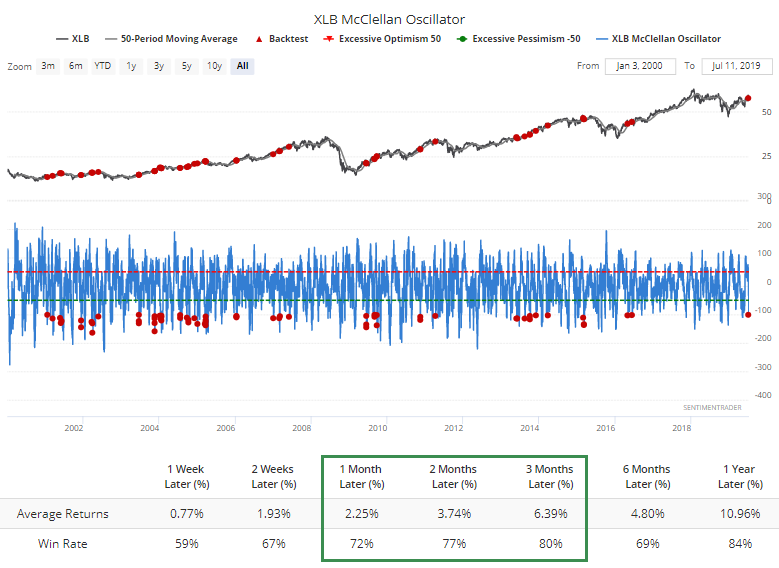
The selling in basic materials stocks has bucked the general trend, and it's been enough to push the McClellan Oscillator below -100, even though XLB is still trading above its 50-day average. The fund has done well over the medium-term after this kind of setup.
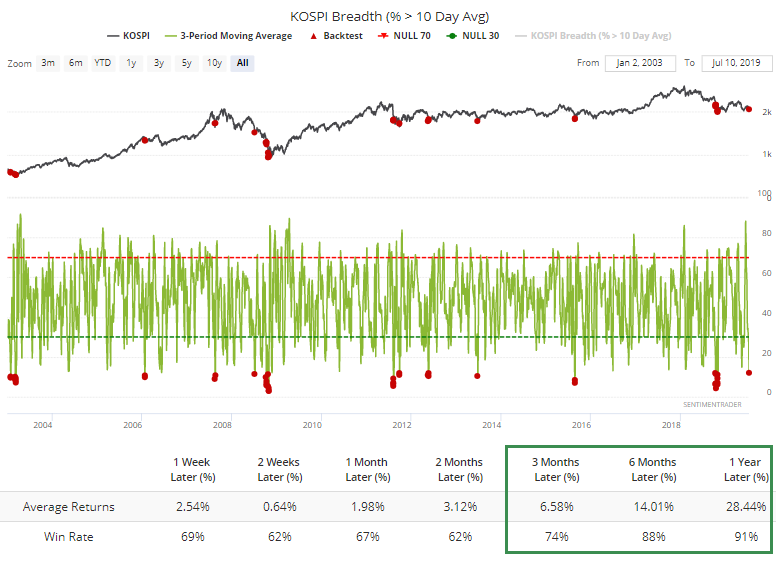
The only other sector or index showing hints of excessive selling pressure is Korea's Kospi index. An average of only 12% of stocks in that index have managed to hold over their 10-day averages over the past few sessions. It's not *quite* to washout levels, but getting there quickly.
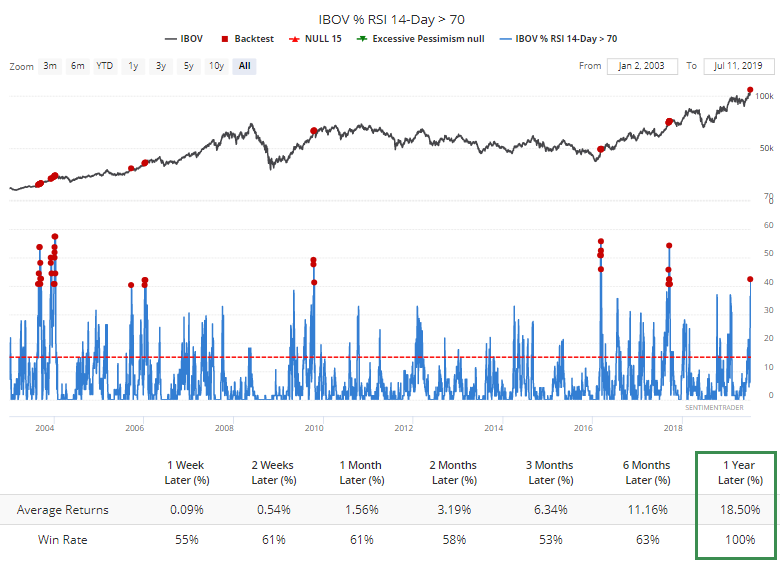
At the other end of the spectrum is Brazil's Ibovespa, where more than 40% of stocks are now overbought. We're seeing readings right now in that index that often indicate a short- to medium-term level of exhaustion, but that has been a good long-term sign of huge momentum.
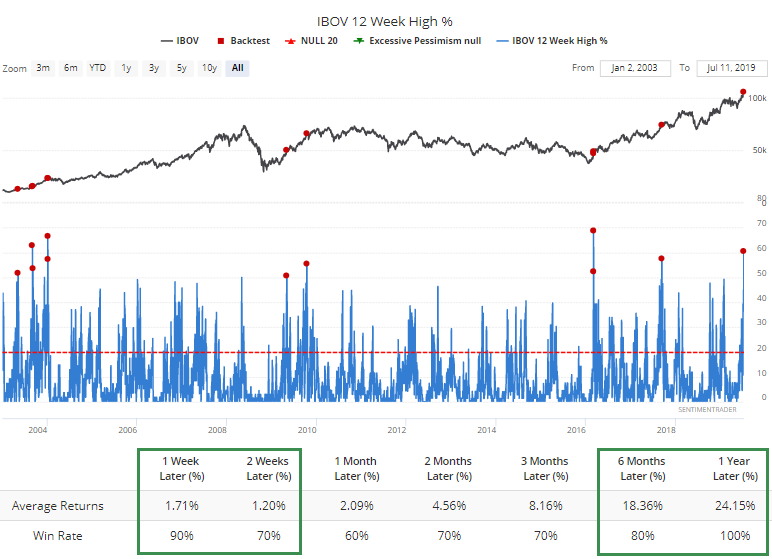
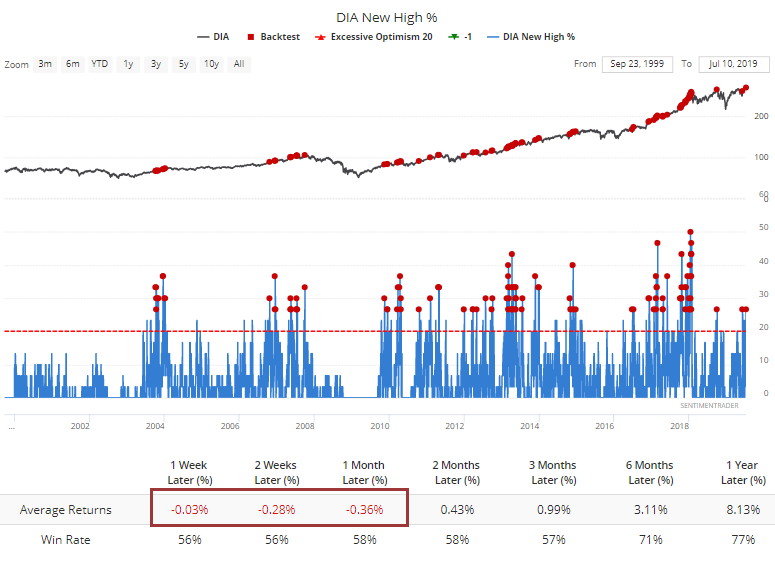
More than 60% of the stocks just hit a multi-month high. That's been a better sign coming out of a protracted downtrend than it has been after a multi-year rally, so some slight caution here.
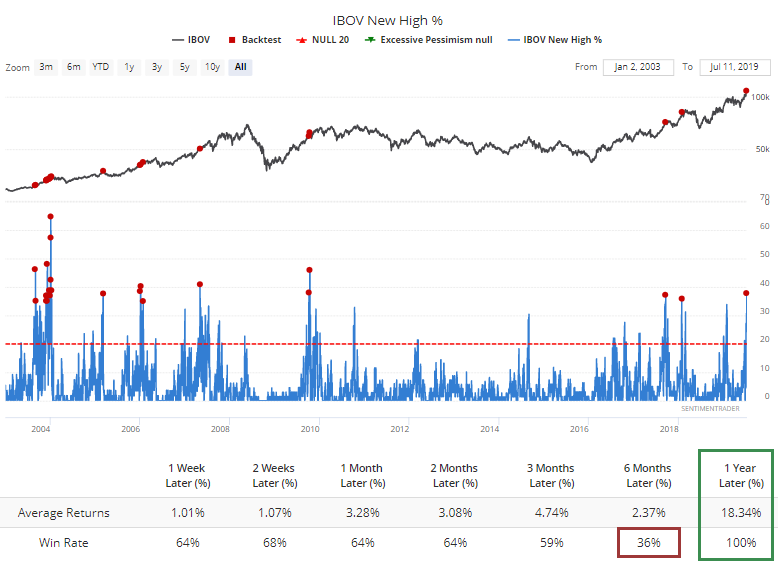
Of those hitting multi-month highs, nearly 40% are at least at a 52-week high as well. Not that over the next 6 months, the win rate was only 36%, but the 12-month returns were still excellent.
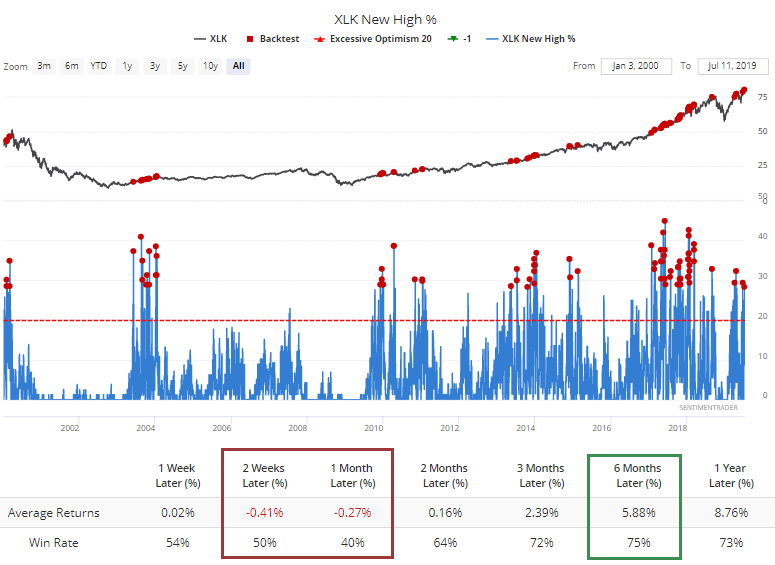
In the U.S. the tech sector also saw a jump in the number of stocks hitting fresh 52-week highs, with nearly a third of them breaking out. That has led to some shorter-term pullbacks in the past.
There was also a jump in 52-week highs among Dow Industrial stocks. The Dow still tended to rise after such high readings, but its average return was negative up to a month later.
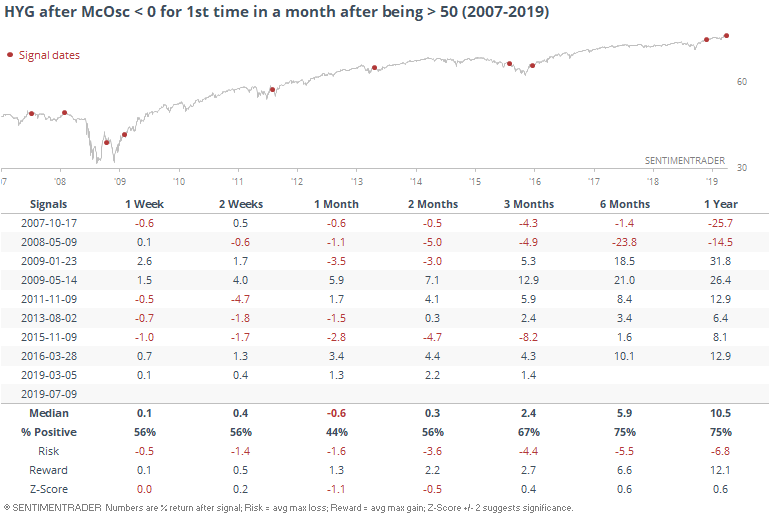
In high-yield bonds, the McClellan Oscillator has moved below zero for the first time in a month, after having been shown extreme momentum by popping above 50.
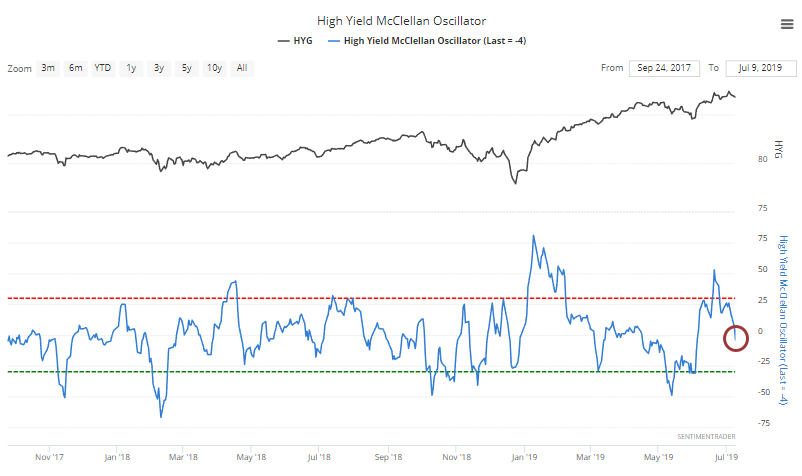
This has preceded relatively weak returns over the next month, but not beyond that.
Long Trip
The WSJ notes that it has taken the S&P 500 more than 200 sessions to close above its next round number. It still hasn't closed above 3,000, but when it does, it will have been a long time since it first closed above 2,900.
There is some academic research about the attractiveness of round numbers for investors, which is nothing more than a psychological anchor. Whatever the reason, trying to find an edge around these in the major indexes is mostly an exercise in frustration. Still, it's a popular topic.
If we look at the times when the S&P closed the gap between two round numbers in the quickest time, they all occurred in the past 22 years. It gets easier, of course, to go from 2,500 to 2,600 than it did from 500 to 600 in percentage terms, so that is a major factor.
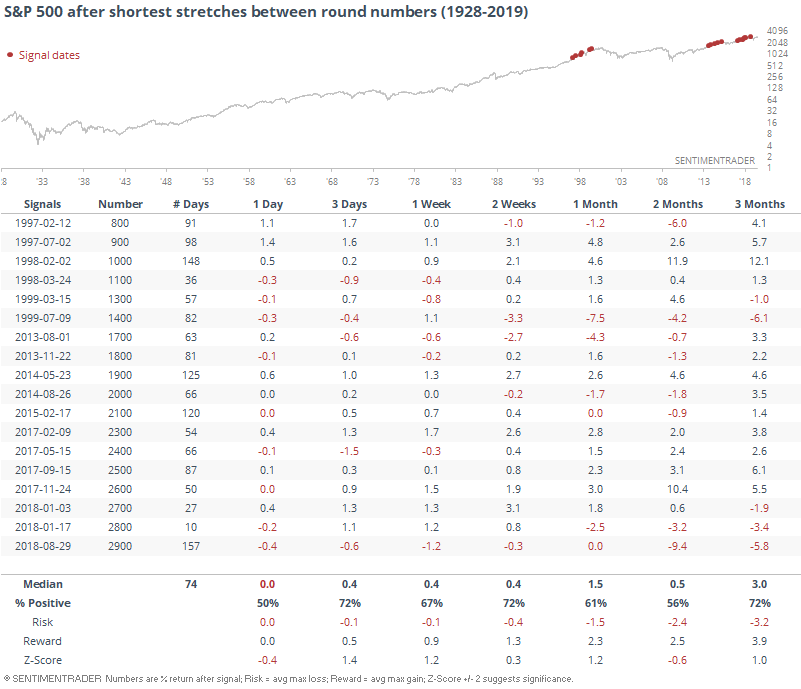
On average, it took the S&P only 74 days to go from one round number to the next, and its performance going forward was okay, not great.
If we look now at the longest stretches between round numbers, for which our current streak will qualify, it took a median of 519 days.
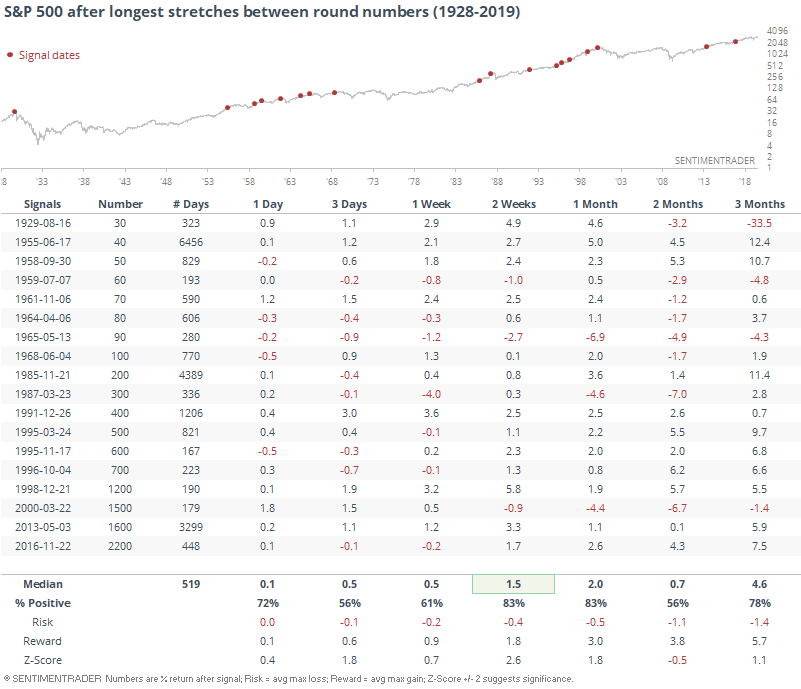
After hurdling these numbers, the S&P did a lot better going forward, especially over the next two weeks. This is voodoo kind of stuff, but maybe (maybe!) there's a little bit to the idea that since it has taken so long to close above 3,000, investors might be a little bit enthused about buying.
Not Keeping Up
Over the past couple of weeks, we've looked at some lagging sectors and indexes, especially smaller-cap stocks. Some of these are hitting absolute or relative lows while indexes like the S&P 500 keep hitting new highs. It's been enough of a worry in the past to be a yellow flag now.
Someone asked to look at a broader, equal-weighted view such as for the Value Line Geometric index, which is an equal-weighted index of 1700 stocks. It closely tracks the Russell 2000 index of small-cap stocks, so not surprise that it's badly lagging the S&P now.
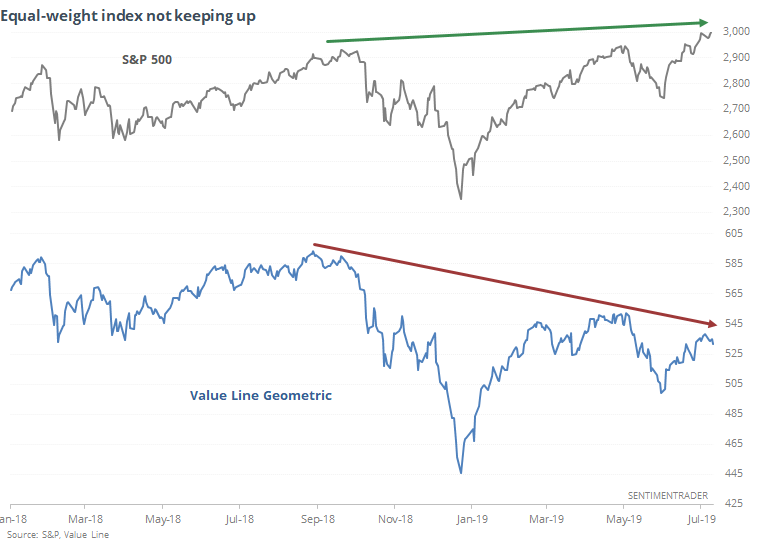
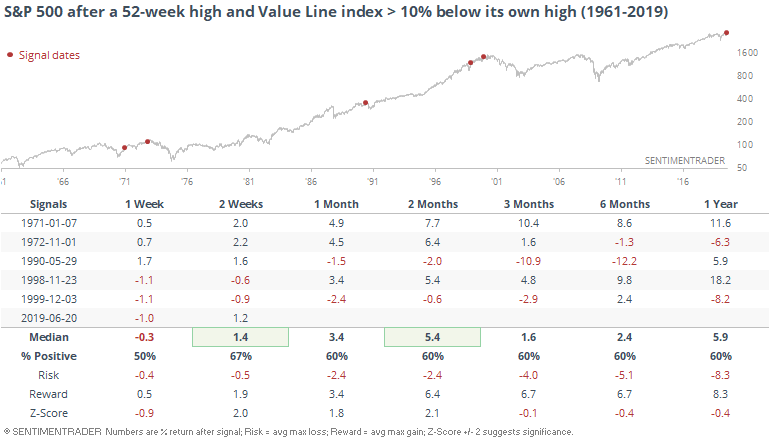
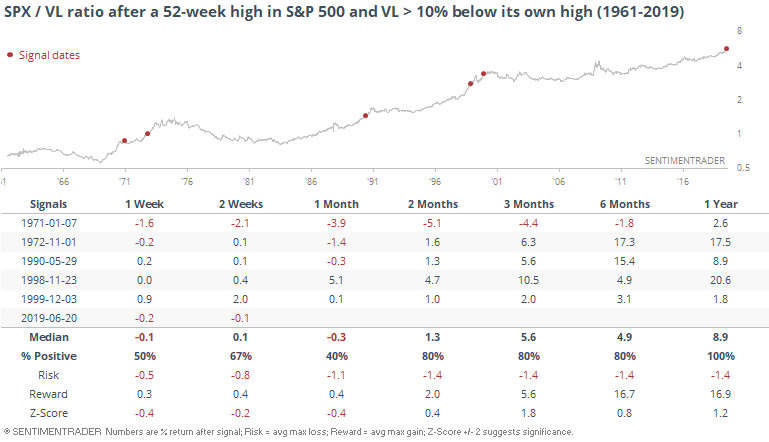
There have only been 5 times since 1961 when the S&P hit a new high yet the Value Line index was more than 10% below its own high. Returns for the S&P going forward were good shorter-term, less so longer-term, but it was very mixed. It did ultimately lead to major declines 3 of those 5 times, though.
For the Value Line index, this was not a good sign.
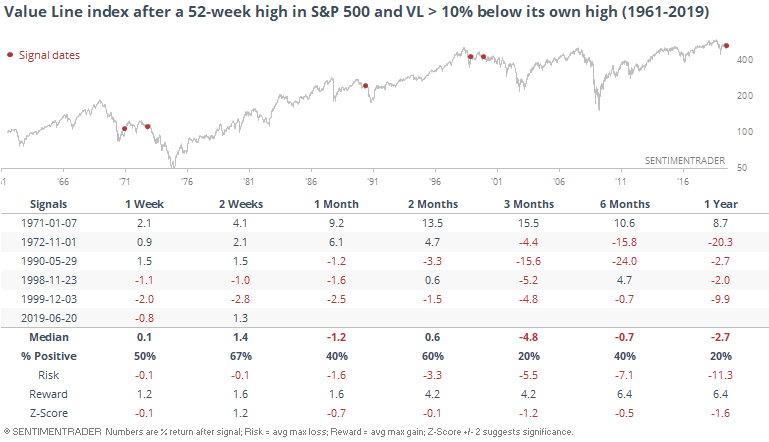
This means that the S&P 500 tended to continue outperforming the Value Line index, which we can more clearly see when looking at the forward performance in the ratio between the two.
Twitter Bulls
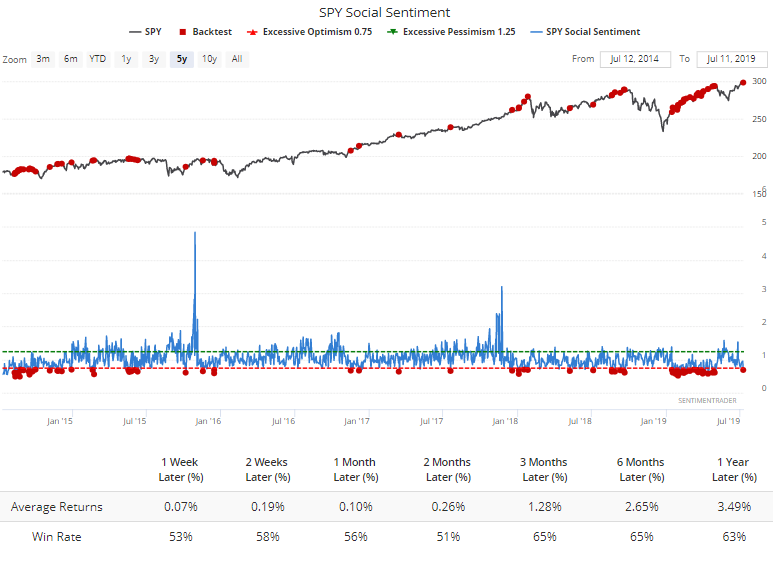
Among those tweeting about the S&P 500 fund, SPY, sentiment has turned decidedly positive. The Social Sentiment score has dropped below 0.7. This is constructed like a put/call ratio, so high readings mean there are more bearish (negative) messages than bullish (positive) ones.
Over the past 5 years, a reading this low has led to "meh" returns.
What's most interesting about this is how stark the differences in returns are versus when Twitter folks are bearish.
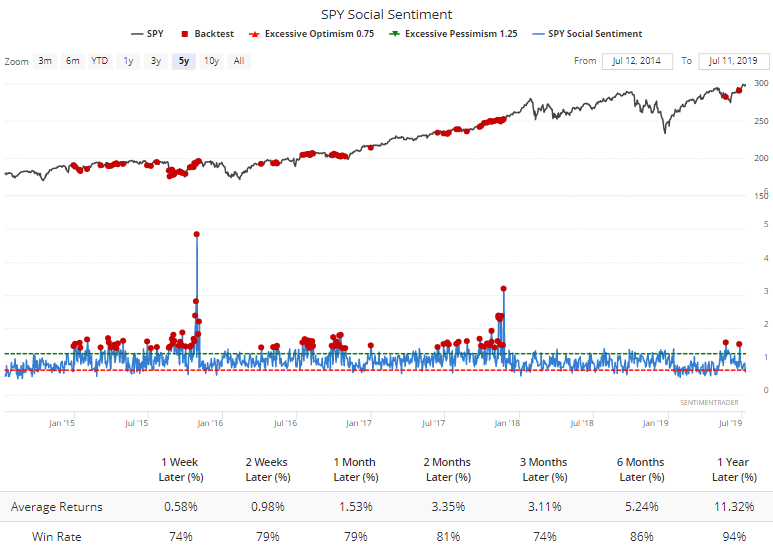
That's large spread between the two. It's not enough to suggest a sell signal now, but at least it suggests higher risk for shorter-term traders, versus those times when Twitter messages are more negative.