Thursday Color - Bond Moves, Yield Curve, Jobs, REITs & Utes, New Highs, Mexico

Here's what's piquing my interest so far today.
Stretched
The massive move in bonds continues to get a lot of attention, and for good reason. We saw the other day that it's relatively unusual to see a new high in bonds (low in yields) with an explosion in volatility, and that has been a good sign for stocks.
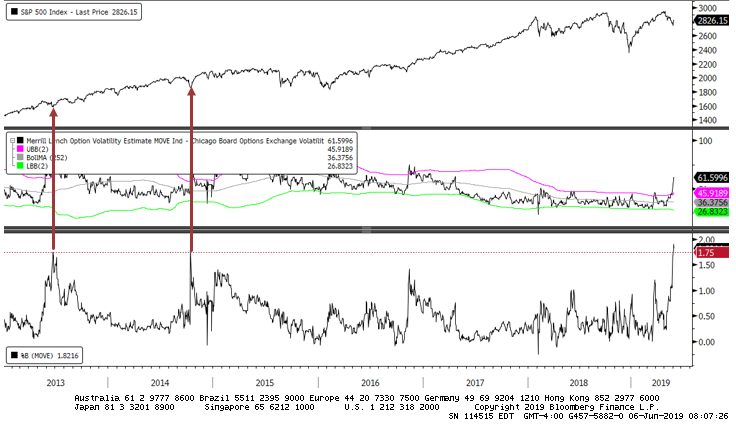
With the volatility in bonds and recovery in stocks, the difference in expected volatility between the two markets continues to expand. Traders are pricing in ever-increasing levels of bond volatility while lowering their expectations of stock volatility.
The spread between the MOVE index (expected bond vol) and the VIX (expected stock vol) is now the highest in five years. It has seen a "shocking" rise, moving more than 1.75 standard deviations outside of its typical range over the past year.
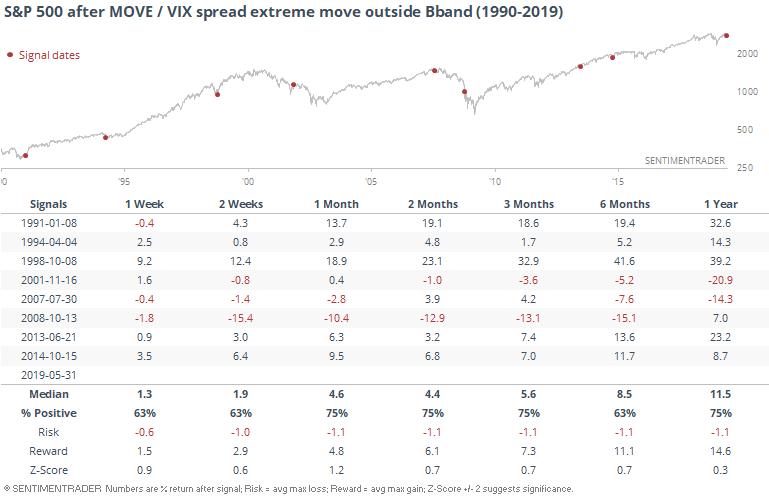
When that happened in 2013 and 2014, stocks bottomed. Historically, it had a good record but failed during the financial crisis and during 2001. Assuming we're not in a melt-down financial panic, this has been bullish for stocks.
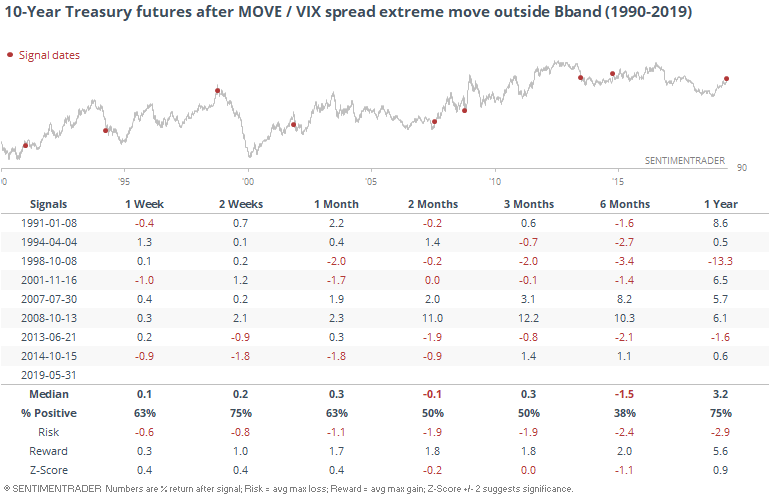
It was significantly less positive for 10-year T-note futures.
Curve Turning Up
Part of the volatility surrounding bonds is scaring investors watching the yield curve. First, investors were unnerved because parts of the curve were inverted. Now they're concerned because it's steepening. If this is the turn in the cycle, it may bode ill for risky assets. The WSJ notes that the 2/10 curve just hit its highest level in months.
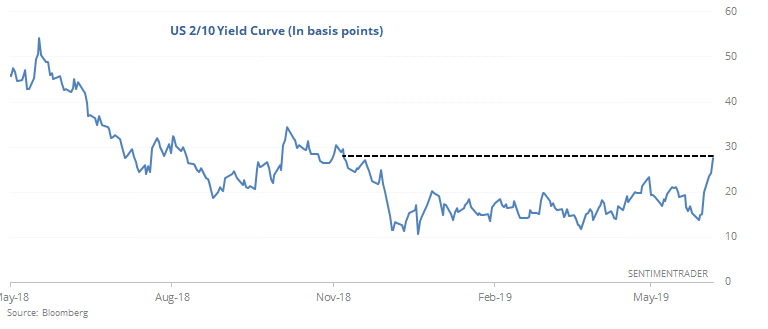
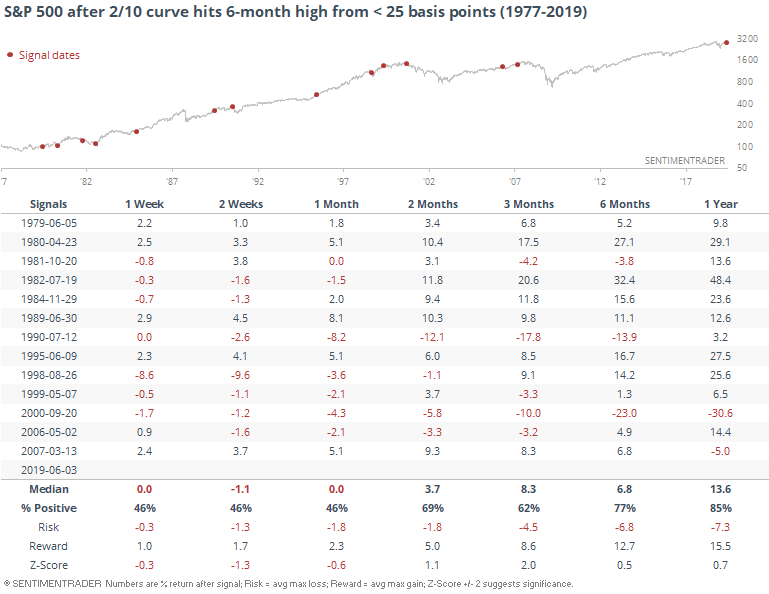
Other times it jumped to a 6-month high from below 25 basis points, it tended to keep going.
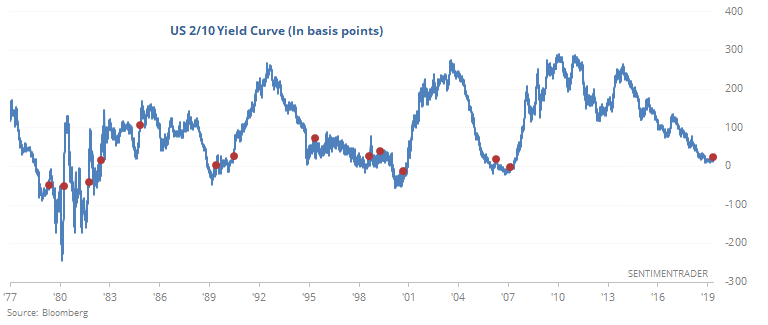
That was not necessarily a sell signal for stocks, though.
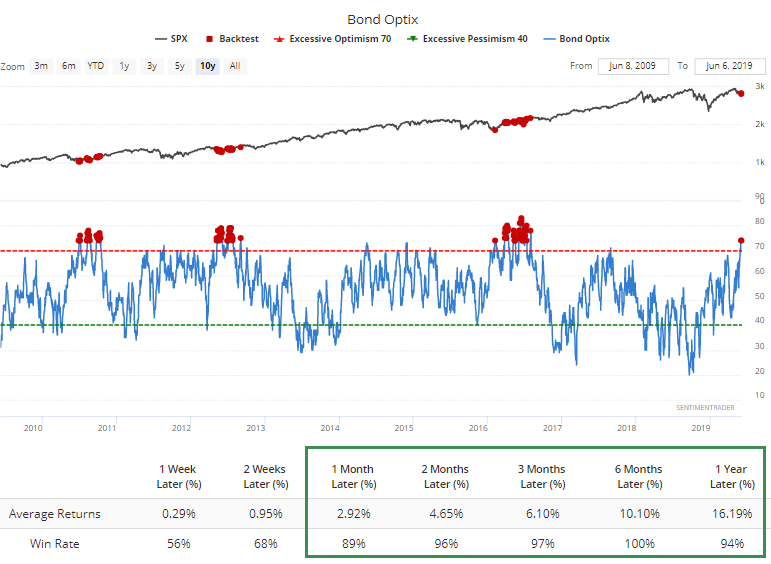
As we saw other times in the past week, the move in bonds has triggered extreme optimism and it's continuing to climb even while bonds settle back somewhat. It's notable how extremely high bond sentiment has come during times of anxiety toward stocks since the financial crisis.
The Backtest Engine shows how the S&P has fared when the Optimism Index on bonds is as high as it is now.
Bad Data
Part of the reason for the big moves in bonds has been evidence of weakening economic data. The ADP payroll report came out and showed the largest monthly decline in more than 5 years.
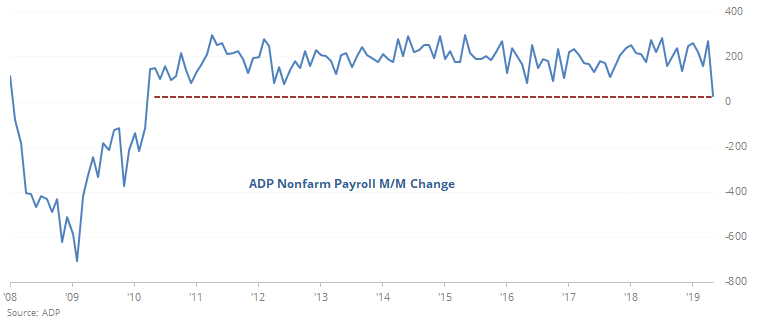
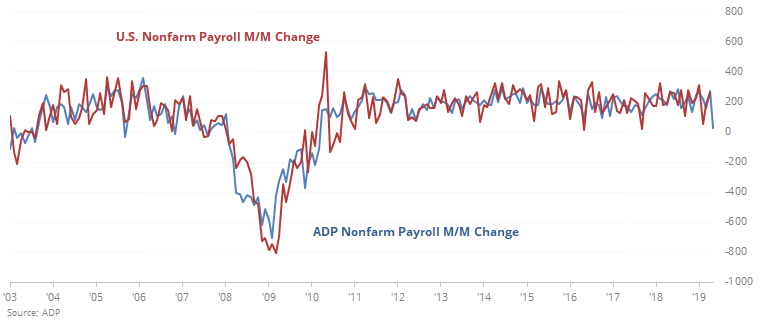
It has had a decent correlation with the much more important and widely-following Nonfarm Payroll report due out tomorrow.
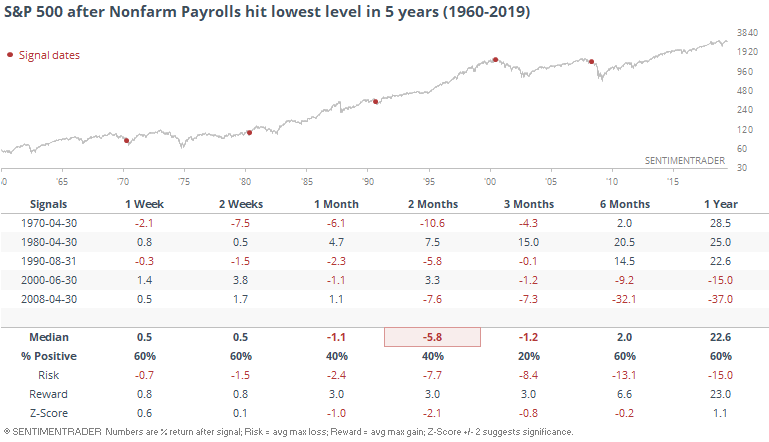
Assuming the correction holds and the Nonfarm report plunges to a 5-year low, it's not a great sign for stocks, as it triggered right before the last two protracted bear markets. But before that, the three signals were not all that dire.
Rate-Sensitive
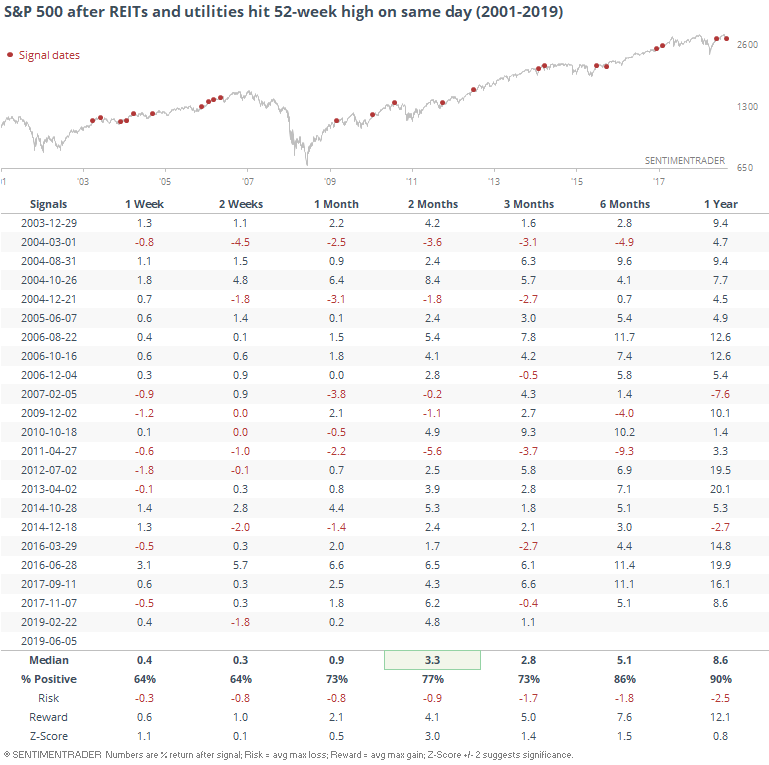
Thanks to the big drop in competitive bond yields, rate-sensitive sectors like REITs and utilities have enjoyed a nice little run. Both have jumped to 52-week highs.
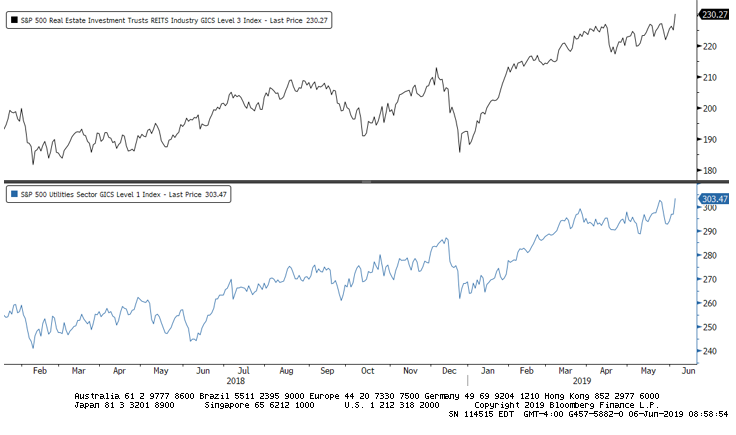
Since the inception of the S&P 500 REITs index in 2001, whenever both sectors hit a new high together, it has been taken as a warning sign for stocks. Not sure why, empirically.
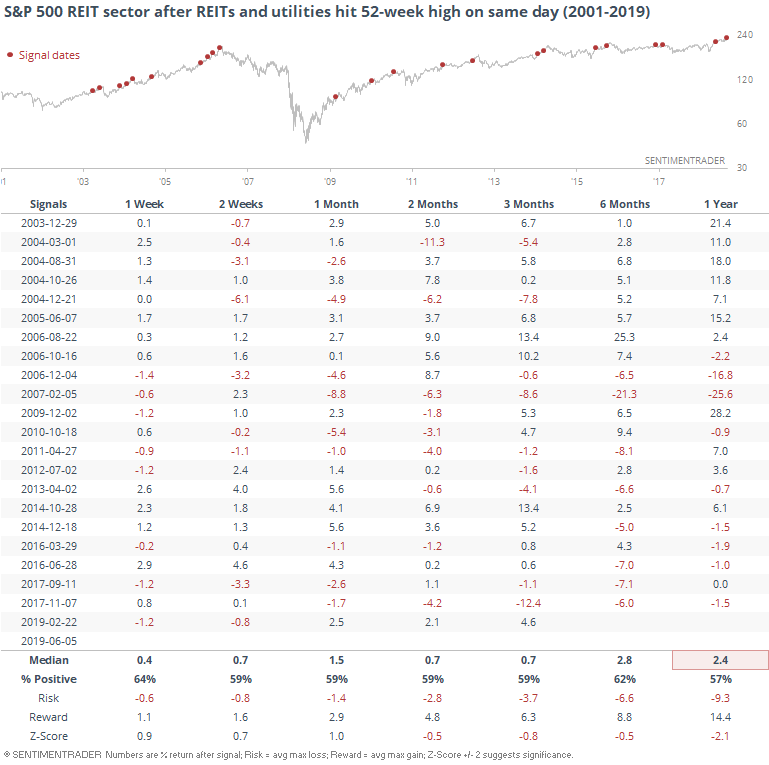
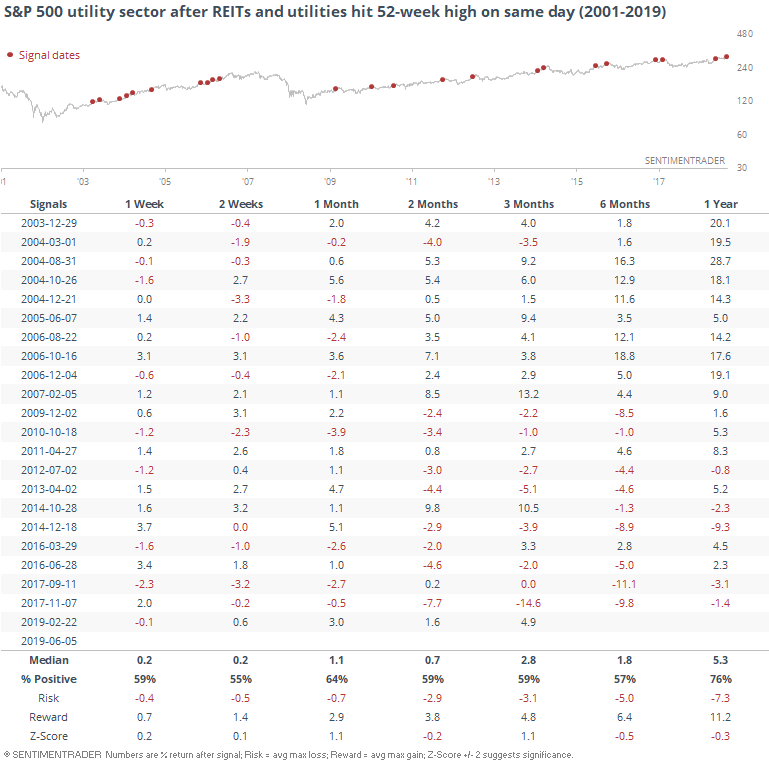
It's been a worse sign for those sectors specifically.
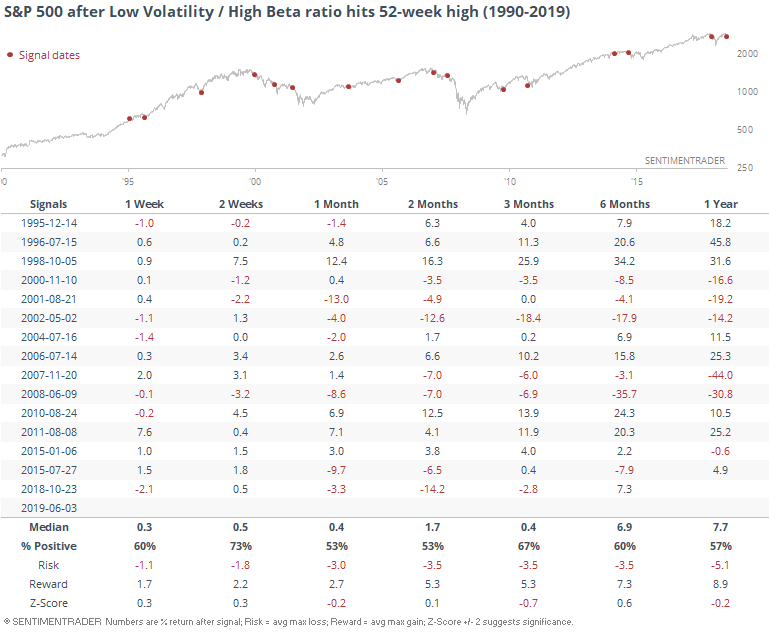
The rallies in these types of stocks has pushed the S&P 500 Low Volatility index to a new high. High Beta has suffered, so the ratio between them just broke out to the highest level in years.
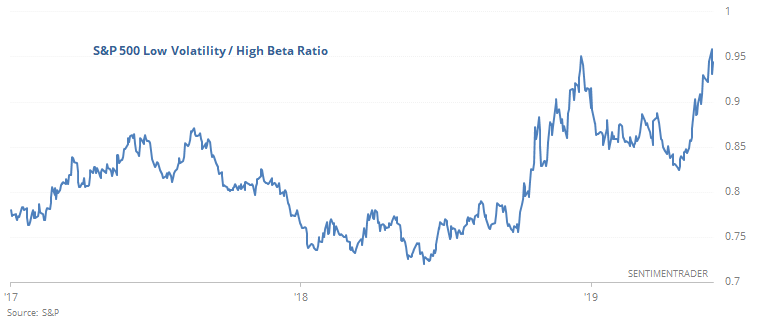
As a predictor for stocks in general, it was inconclusive.
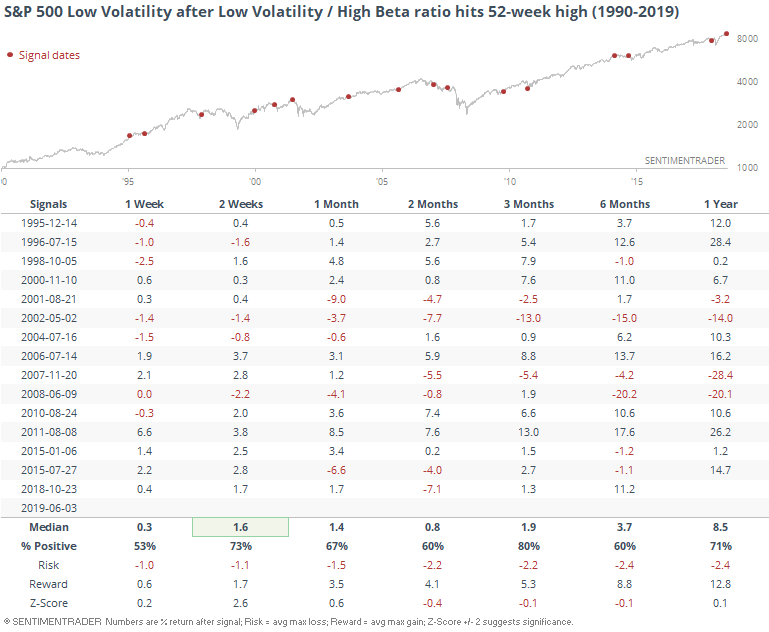
For the Low Vol stocks, it was mostly a good sign.
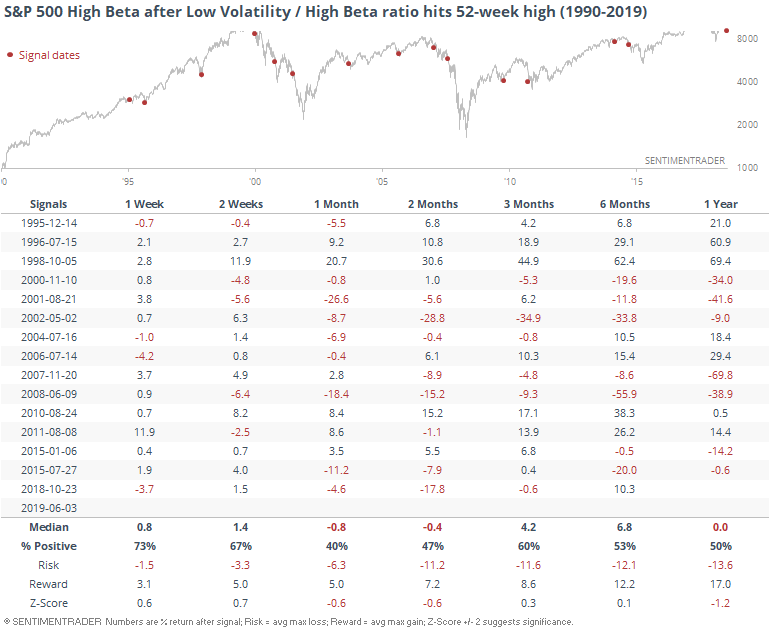
Not so much for the High Beta ones, though.
Breadth Review
Perhaps the biggest development in breadth, theoretically anyway, is the surge in 52-week highs among companies within the S&P 500. More than 13% of stocks in the index hit a fresh high on Wednesday, the most in well over a year.
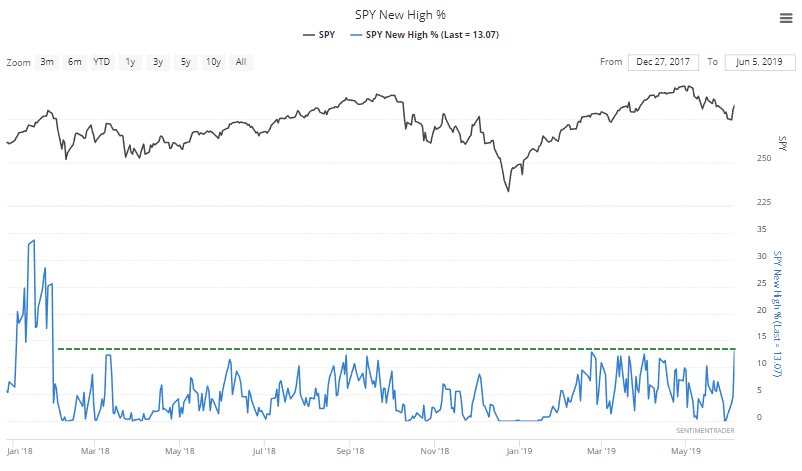
That's taken to be a good sign, but there are far better ones than this. While it does mean that participation is broadening, that's not always a good sign.
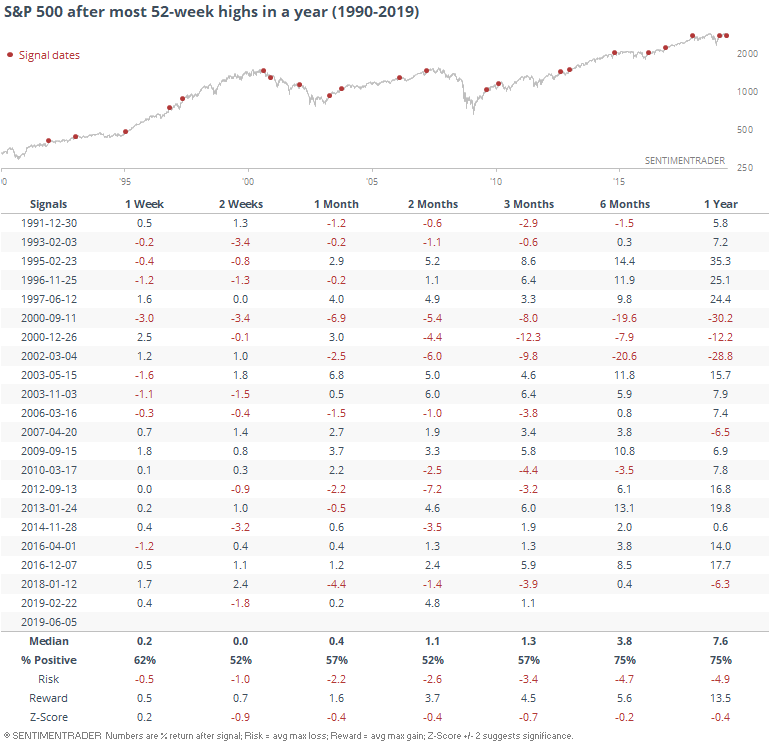
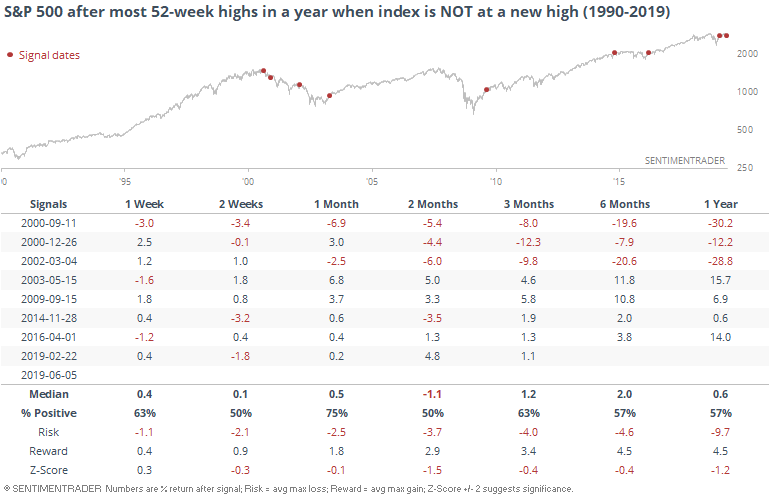
It's not unusual to expect a surge in stocks at new highs when the index itself is also at a new high. That's far from the case now, with the S&P off nearly 5% from its peak.
This happened several times in the early 2000s (not good) and several times since the financial crisis (much better).
No Bull
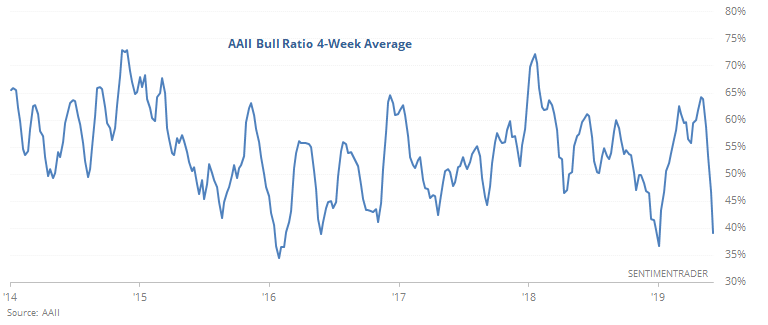
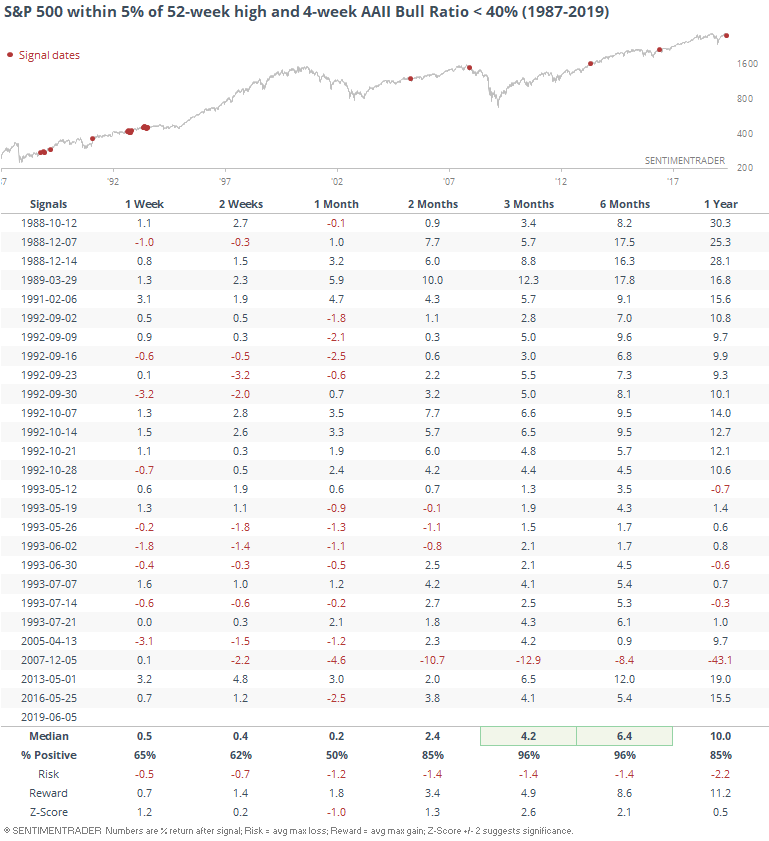
Yet again this week, investors in the AAII poll became even more negative. The 4-week average of the Bull Ratio is now below 40%, a remarkably low reading since the S&P 500 is well within 5% of its peak.
Over the past 5 years, there have been only a few weeks that showed more pessimism.
There have been 26 weeks when this has been the case, leading to a higher level in the S&P over the next 3-6 months 25 times.
Peso Problems
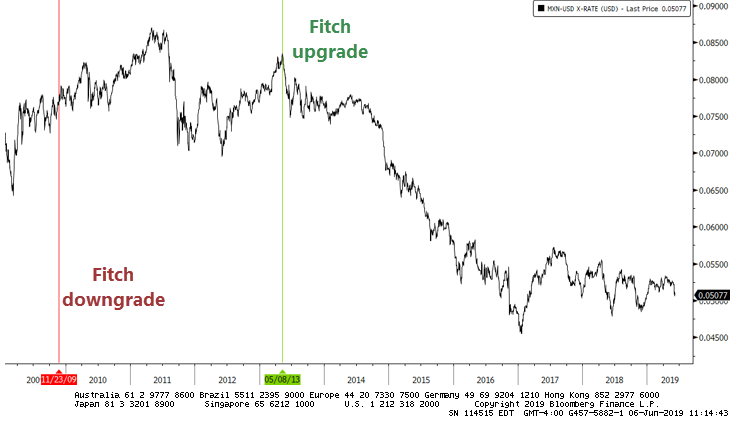
Mexico's currency got hit on a sovereign downgrade by Fitch. We've seen so many times in the past how these ratings firms do not serve investors, they serve other interests. Laypersons who invest based on these changes and outlooks tend to be very poorly led - not only do these companies tend to look backward, often their outlooks are clouded by competing interests.
For what it's worth, here are Fitch's last two changes on Mexico's rating, compared to the peso. Their upgrade in 2013 top-ticked it.