
Three sectors for a favorable market period

Key points
- The S&P 500 Index is entering a seasonally favorable period
- This piece asks the question, "what if we look at sectors instead of the index"
- There are three sectors that stand out during this favorable period
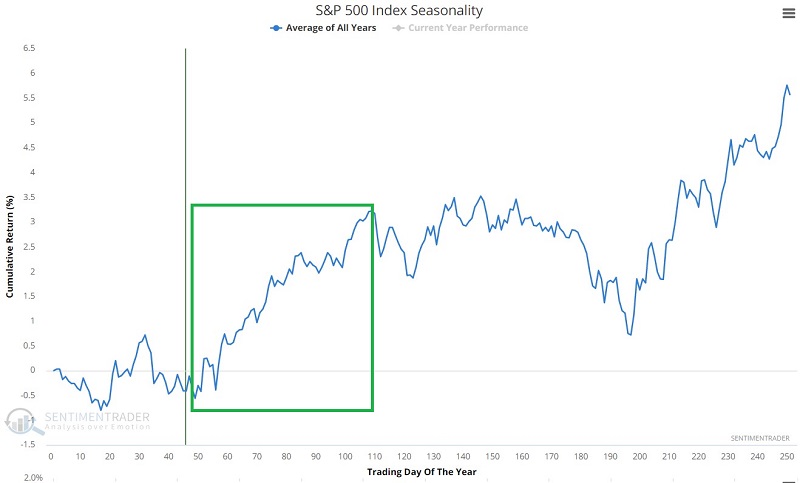
A favorable seasonal period for the S&P 500 Index
The chart below displays the annual seasonal trend for the S&P 500 Index. It also highlights the period from Trading Day of Year (TDY) #49 through TDY #85. For 2023, this period extends from the close on 2023-03-14 through the close on 2023-05-04.
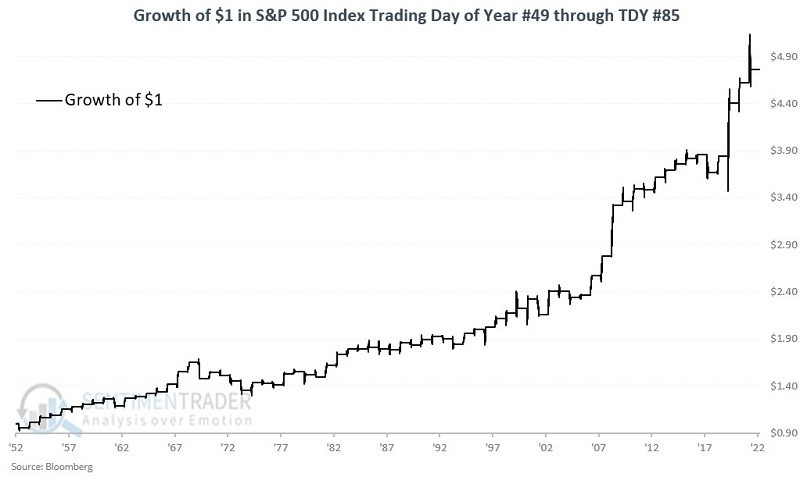
The chart below displays the growth of $1 invested in the S&P 500 only from the close of TDY #49 through the close of TDY #85 every year since 1953.
The table below displays a summary of the results.
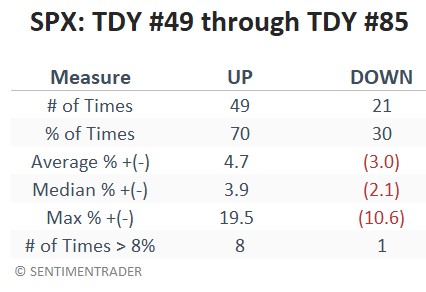
Note that the maximum percentage decline for the S&P 500 during this period is -10.8%. Could 2023 exceed that worst performance? Sure, it is possible. But for now, all those pundits shouting "Market Crash Imminent" are calling for something unprecedented from mid-March to early May.
Like most things in the market, the bottom line is that seasonality is no "sure thing." However, it suggests a long-term edge associated with being in stocks during this period. As detailed in this article, the key is ensuring that price action confirms the favorable seasonal trend.
Drilling down into sectors
The table below displays the performance of each of the S&P 500 sectors during the TDY #49 through TDY #85 period since 1953. The table displays the average percentage annual gain during this period, the median percentage annual gain, and the percentage of time the sector showed an increase.
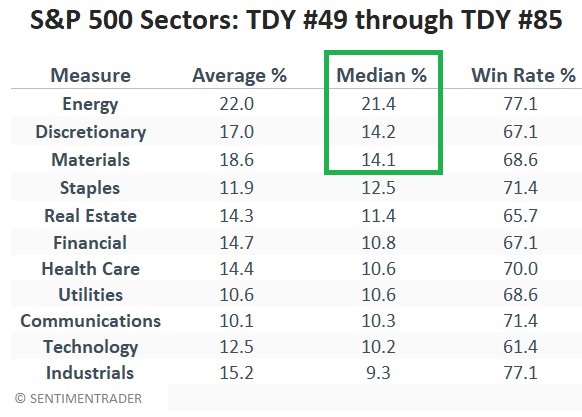
The sectors in the table above are ranked by Median % +(-) during the TDY #49 through TDY #85 period. On this basis, the top three performing sectors were Energy, Materials, and Consumer Discretionary.
Trading the top three sectors as a portfolio
Now let's look at how a portfolio holding these three sectors might have performed over time. We used the FAMA French sector indexes from 1953 to 1991 and the S&P 500 Sector indexes after that for our test.
Note that the strategy can be replicated using the following ETFs:
- Energy Select Sector SPDR Fund (XLE)
- Materials Select Sector SPDR Fund (XLB)
- Consumer Discretionary Select Sector SPDR (XLY)
For our test, each year at the close of TDY #49, we split the portfolio evenly between the three sectors and held them through TDY #85. To illustrate seasonal period results only, the portfolio is flat (no gains or losses) the rest of the time.
The chart below displays the hypothetical growth of $1 split among Energy, Materials, and Consumer Discretionary during the seasonally favorable period every year since 1953.
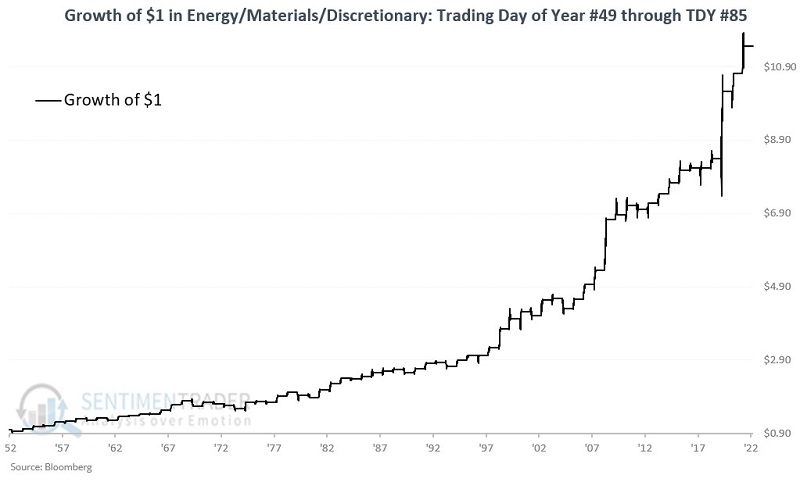
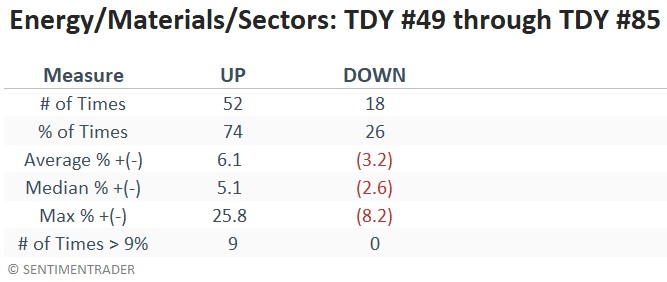
$1 invested in the S&P 500 only during the favorable seasonal period grew to $4.77. On the other hand, $1, split evenly among the three sectors, grew to $11.47. The table below summarizes the performance of the three-sector portfolio.
What the research tells us…
There is no guarantee that the stock market will advance between now and early May. Likewise, there is no guarantee that the three sectors we've highlighted will continue to be the leaders during the late winter into the early/mid-spring period in the future. Still, for traders looking for a potential "edge" in the market, the results above illustrate that it may be possible to outperform a market index significantly over time.