Data &
Technology
Research
Reports
Report Solutions
Reports Library
Actionable
Strategies
Free
Resources
Simple Backtest Calculator
Simple Seasonality Calculator
The Kelly Criterion Calculator
Sentiment Geo Map
Public Research Reports
Free Webinar
Pricing
Company
About
Meet Our Team
In the News
Testimonials
Client Success Stories
Contact
Log inLoginSign up
< BACK TO ALL REPORTS

This year is just like...

Jason Goepfert
2021-05-04
The S&P 500 has had a great start to the year. Through 4 months, it has a high correlation to years like 2013. Going back to 1928 and looking at the years with the highest correlation, future returns struggled during the summer months.

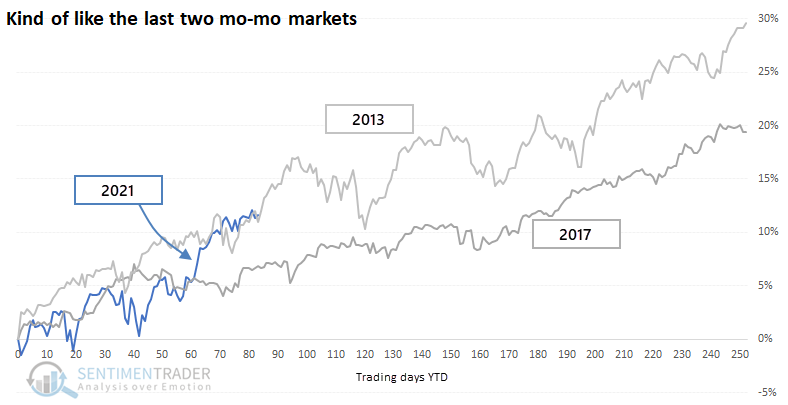
Through the first 4 months of the year, stocks have barely suffered any downside volatility. This seems like 2013 or 2017, two other recent years that were marvelous for trend followers and miserable for pretty much every other strategy.

Buying momentum to start the year has rolled over just about every mean-reversion strategy in 2021, and it's tempting to pick a year that seems similar based on eyeballing a chart. We prefer to take a more objective approach using as much data as possible.

THE CLOSEST HISTORICAL ANALOGS

Using that discipline, we can go back nearly 100 years and look for every 4-month (84 trading-day) start to the year. We'll then filter the years, looking only at those that showed the highest correlation.

There were 19 years with a correlation of more than +0.75 (on a scale of -1.0 to +1.0). We can see their average price path below.

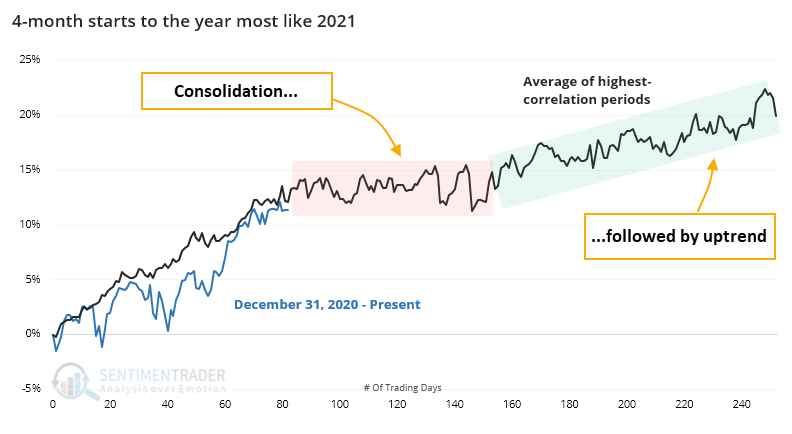
Once the years got to about this point, they tended to plateau into the summer months before picking up again in the fall. The overall trend was still up and to the right.

The 10 most recent years that made the cut are shown below.

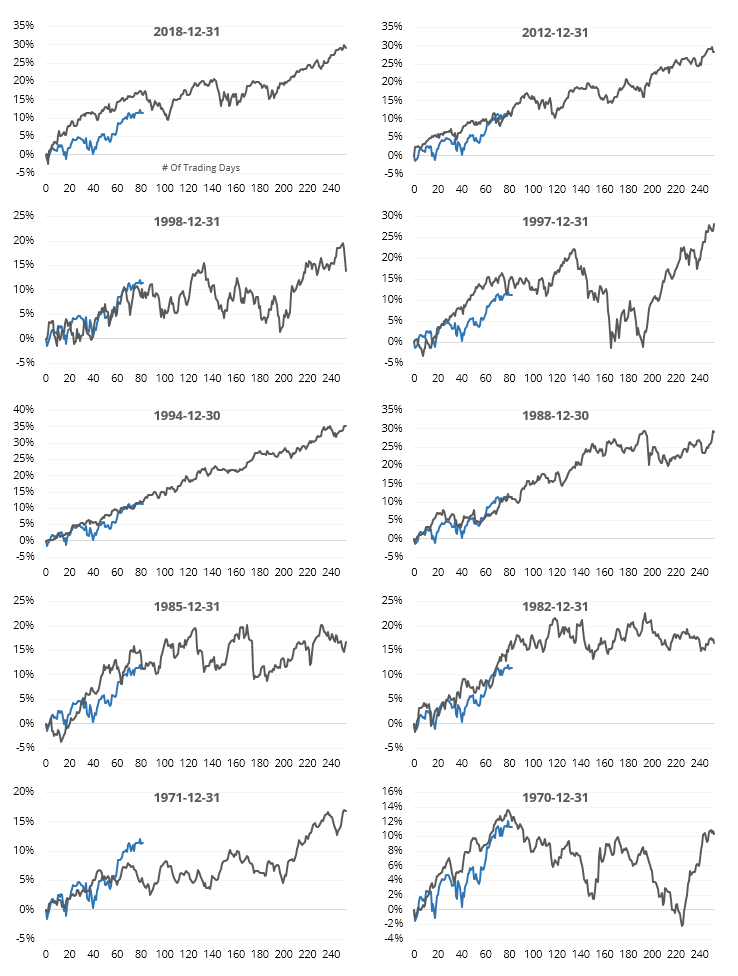
Most of them tended to see some exhaustion about now, or if they did see a further push, gave it back in the month(s) ahead. The only real exceptions were 1995, which was pretty much an uninterrupted uptrend, and 1989. All the others saw at least some chop.

FUTURE RETURNS AFTER THE MOST SIMILAR YEARS

The table below shows the S&P's future returns as of day #84 for the years with the highest correlation so far to 2021.

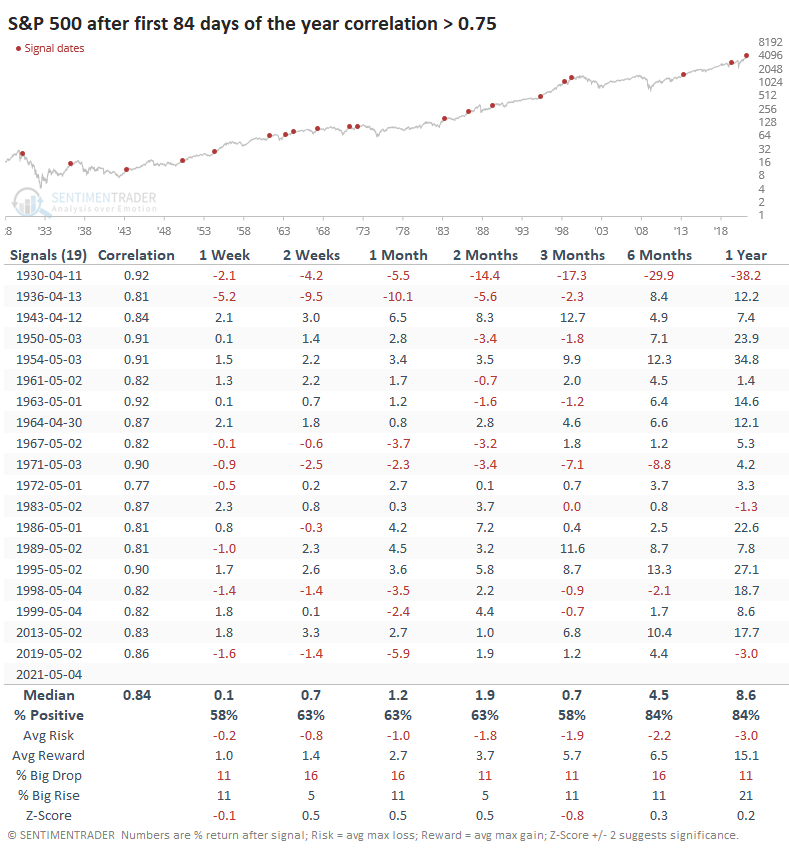
Returns weren't bad, but they weren't great either, especially for the first few months.

Over the next 3 months, the S&P averaged a return of only +0.7%, below a random 3-month return. The risk/reward wasn't bad at all, and over the next 6-12 months, there was only one terrible loss.

ANOTHER CHALLENGE - LOTS OF COMPANY

An additional challenge for the short- to medium-term this year is the high level of sentiment. The table below shows the S&P 500's future returns entering May with the highest levels of Dumb Money Confidence.

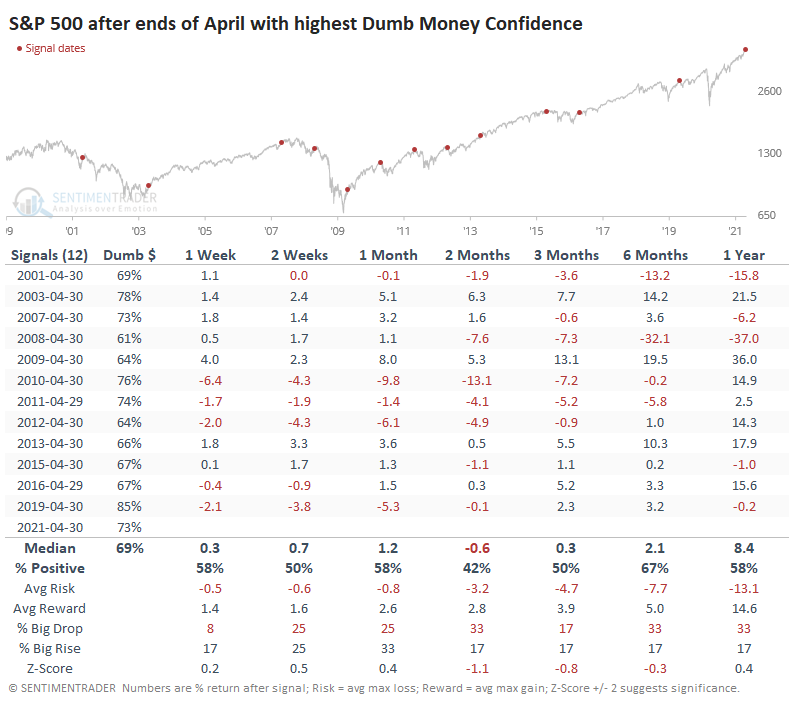
The only two years that didn't see weakness, or only a minimal gain, through June were 2003 and 2009. Both of those, of course, were the first years of a bear market recovery.

Confidence has been high for months, with no ill effect on price action. As we saw in February, the "dumb money" has been smart to a degree we've never seen before, so that's a caveat.

Given the recent record of stocks struggling in the early summer with high optimism and the long record of it struggling after the most similar 4-month starts to the year, it suggests a low likelihood of a runaway upside market.

Sorry, you don't have access to this report

Upgrade your subscription plan to get access
Go to Dasboard
DATA &
TECHnologies
IndicatorEdge
‍
BackTestEdge
‍
Other Tools
‍
DataEdge API
RESEARCH
reports
Research Solution
‍
Reports Library
‍
actionable
Strategies
Trading Strategies
‍
Smart Stock Scanner
‍
FREE
RESOUrCES
Simple Backtest
Calculator
Simple Seasonality
Calculator
The Kelly Criterion
Calculator
Sentiment Geo Map
‍
Public Research Reports
‍
Free Webinar
COMPANY
‍
About
‍
Meet our Team
‍
In the News
‍
Testimonials
‍
Client Success Stories
Pricing
Bundle pricing
‍
Announcements
‍
FAQ
© 2024 Sundial Capital Research Inc. All rights reserved.
Setsail Marketing
TermsPrivacyAffiliate Program
Risk Disclosure: Futures and forex trading contains substantial risk and is not for every investor. An investor could potentially lose all or more than the initial investment. Risk capital is money that can be lost without jeopardizing ones’ financial security or life style. Only risk capital should be used for trading and only those with sufficient risk capital should consider trading. Past performance is not necessarily indicative of future results.

Hypothetical Performance Disclosure: Hypothetical performance results have many inherent limitations, some of which are described below. No representation is being made that any account will or is likely to achieve profits or losses similar to those shown; in fact, there are frequently sharp differences between hypothetical performance results and the actual results subsequently achieved by any particular trading program. One of the limitations of hypothetical performance results is that they are generally prepared with the benefit of hindsight. In addition, hypothetical trading does not involve financial risk, and no hypothetical trading record can completely account for the impact of financial risk of actual trading. for example, the ability to withstand losses or to adhere to a particular trading program in spite of trading losses are material points which can also adversely affect actual trading results. There are numerous other factors related to the markets in general or to the implementation of any specific trading program which cannot be fully accounted for in the preparation of hypothetical performance results and all which can adversely affect trading results.

Testimonial Disclosure: Testimonials appearing on this website may not be representative of other clients or customers and is not a guarantee of future performance or success.