Data &
Technology
Research
Reports
Report Solutions
Reports Library
Actionable
Strategies
Free
Resources
Simple Backtest Calculator
Simple Seasonality Calculator
The Kelly Criterion Calculator
Sentiment Geo Map
Public Research Reports
Free Webinar
Pricing
Company
About
Meet Our Team
In the News
Testimonials
Client Success Stories
Contact
Log inLoginSign up
< BACK TO ALL REPORTS

This Sector is Seeing Panic-Level Selling Pressure

Jason Goepfert
2021-09-24
Industrial stocks have suffered among the most out of any sector over the past month, the breadth suggests we're nearing panic levels.

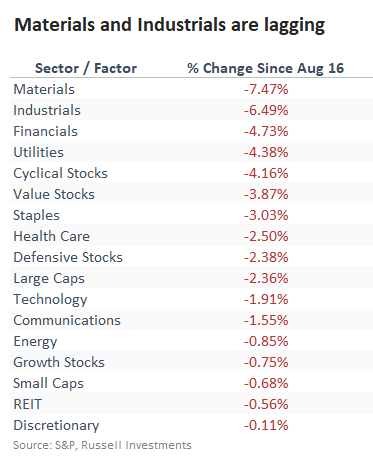
Industrial stocks have had a tough month. Out of the S&P 500's major sectors, Industrials are lagging near the bottom since mid-August in total return. Only Materials stocks have suffered more, and both sectors have lost quite a bit more than even the other laggards. 

Longer-term selling pressure has pushed the McClellan Summation Index for Industrials close to zero. Over the past five years, this has been a good buying opportunity...except when it wasn't. When the Summation Index sliced through zero and kept moving, it highlighted harsh environments for buyers until the indicator fell to -1000 and started to curl higher.

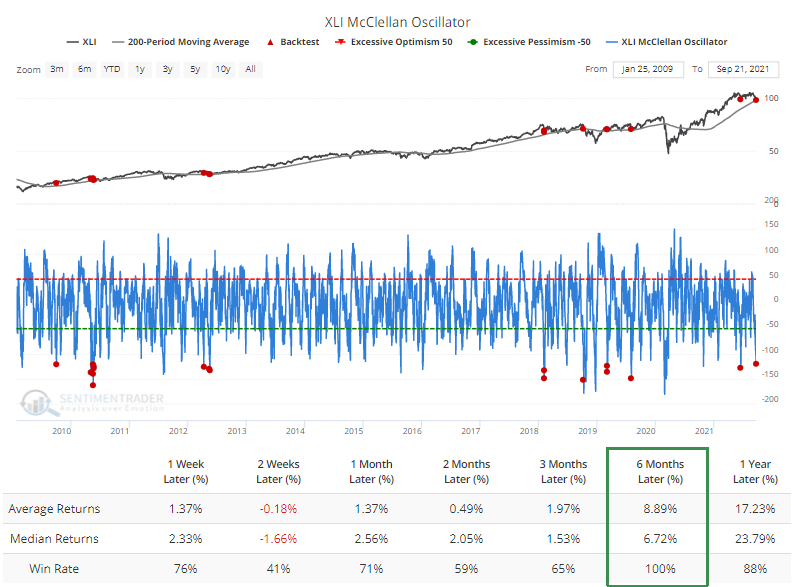
Pressure on the Summation Index is due to the shorter-term McClellan Oscillator plunging to -120. According to our Backtest Engine, a reading this low is truly extreme when the XLI fund was still above a rising 200-day moving average. The others preceded a choppy couple of weeks, but each of them worked higher over the next six months (a roaring bull market as a background doesn't hurt).

When we create a panic breadth composite, we can see that Industrials have just entered the extreme zone.

Panic became even more panicky during the pandemic, but otherwise, it presented a good risk/reward for investors, or at least for traders. Over the past 30 years, its record has been good - not great - when it reached this level. Like most oscillators, more extreme readings tend to lead to more consistent results.


What else we're looking at

  • A look at several breadth measures for Industrials and what they suggest about the market environment
  • What happens after the panic breadth composite reaches the current level when Industrials have barely corrected
  • Tech stocks have given a potential buy signal from washout breadth

Stat box

Depending on your data vendor, more than 80% of volume on the NYSE flowed into advancing stocks on back-to-back days. This kind of breadth thrust has a decent record at preceding further gains.

Etcetera

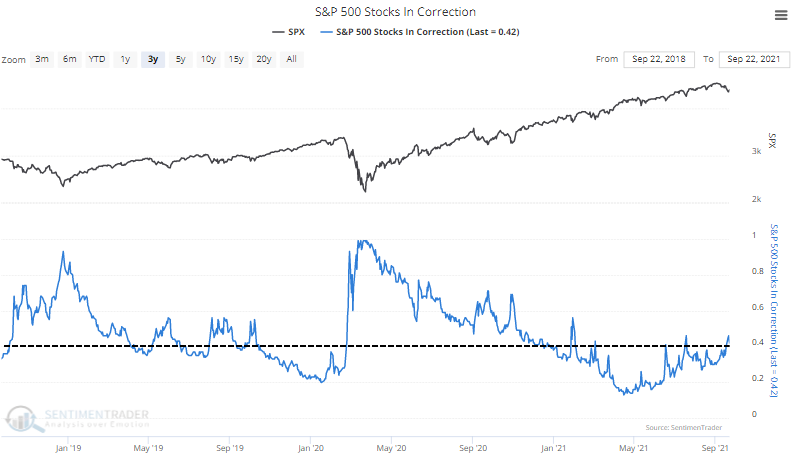
Common corrections. More than 40% of S&P 500 stocks are mired in corrections, though that is declining thanks to a late-week rebound. Unhealthy markets see this figure above 40% and rising.

s&p 500 stocks in correction down 10%

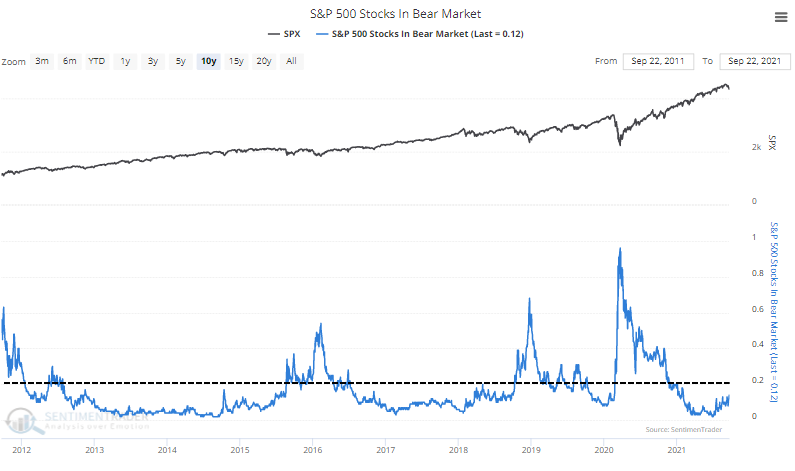
Few bear markets. While many stocks have corrected, few have yet fallen into bear markets. As long as this figure is below 20%, stocks are in a healthy longer-term environment.

s&p stocks in bear markets

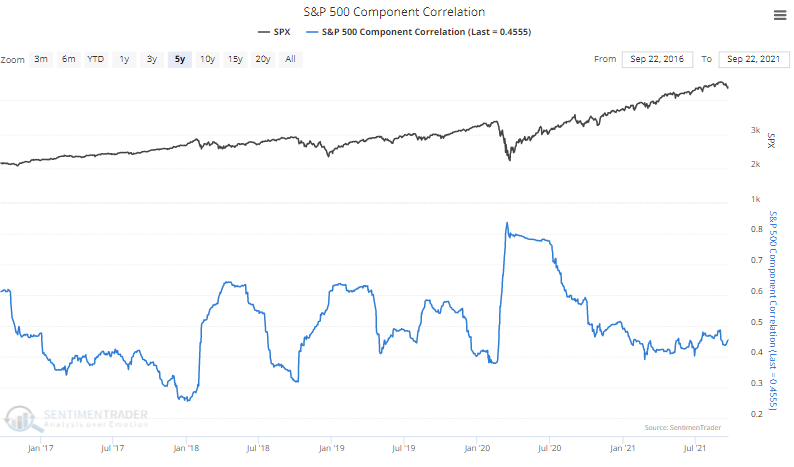
Mediocre correlations. When investors panic, they sell everything. When they're complacent, they trade stocks on their own merits, and correlations among them fall. Currently, correlations among S&P 500 stocks are in the middle of the range, a good place to be.

s&p 500 stock correlation

DATA &
TECHnologies
IndicatorEdge
‍
BackTestEdge
‍
Other Tools
‍
DataEdge API
RESEARCH
reports
Research Solution
‍
Reports Library
‍
actionable
Strategies
Trading Strategies
‍
Smart Stock Scanner
‍
FREE
RESOUrCES
Simple Backtest
Calculator
Simple Seasonality
Calculator
The Kelly Criterion
Calculator
Sentiment Geo Map
‍
Public Research Reports
‍
Free Webinar
COMPANY
‍
About
‍
Meet our Team
‍
In the News
‍
Testimonials
‍
Client Success Stories
Pricing
Bundle pricing
‍
Announcements
‍
FAQ
© 2024 Sundial Capital Research Inc. All rights reserved.
Setsail Marketing
TermsPrivacyAffiliate Program
Risk Disclosure: Futures and forex trading contains substantial risk and is not for every investor. An investor could potentially lose all or more than the initial investment. Risk capital is money that can be lost without jeopardizing ones’ financial security or life style. Only risk capital should be used for trading and only those with sufficient risk capital should consider trading. Past performance is not necessarily indicative of future results.

Hypothetical Performance Disclosure: Hypothetical performance results have many inherent limitations, some of which are described below. No representation is being made that any account will or is likely to achieve profits or losses similar to those shown; in fact, there are frequently sharp differences between hypothetical performance results and the actual results subsequently achieved by any particular trading program. One of the limitations of hypothetical performance results is that they are generally prepared with the benefit of hindsight. In addition, hypothetical trading does not involve financial risk, and no hypothetical trading record can completely account for the impact of financial risk of actual trading. for example, the ability to withstand losses or to adhere to a particular trading program in spite of trading losses are material points which can also adversely affect actual trading results. There are numerous other factors related to the markets in general or to the implementation of any specific trading program which cannot be fully accounted for in the preparation of hypothetical performance results and all which can adversely affect trading results.

Testimonial Disclosure: Testimonials appearing on this website may not be representative of other clients or customers and is not a guarantee of future performance or success.