
This measure of big gains just shattered 100 years of history

Stocks have been running hot, and investors are responding. More and more extremes have been triggering, helping to push valuations high amid low volatility.
The past few weeks have only added to a historic run from the months before that. At various points during the past year, we've looked at streaks of large gains in the S&P or different sectors, and it's only gotten more remarkable. Even with a breather over the past couple of sessions, the S&P has never before seen a year with more +1% daily gains versus -1% losses.
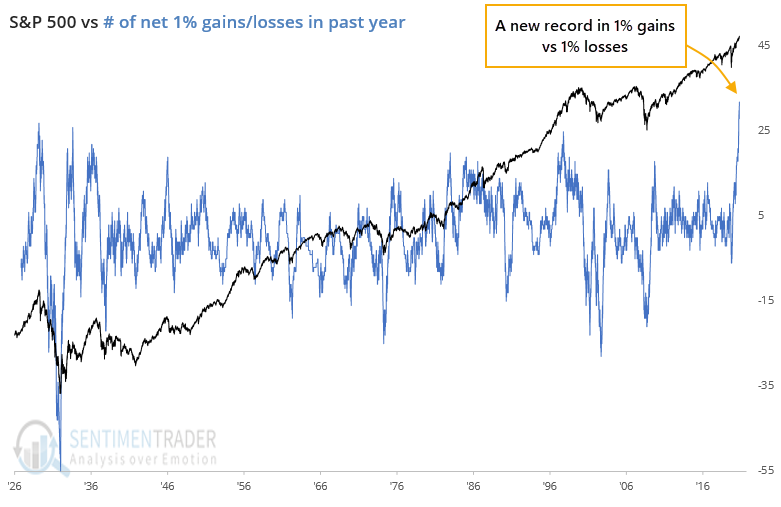
The past year has seen 32 more big gains versus losses, more than the net +27 days in 1929, +26 days in 1934, and +25 days in 1998.
When we zoom in on the time periods that saw nearly as many big gains vs. losses as the past year, we see how stocks struggled to hold the momentum. And when we drill down into each of the major sectors, there are 5 in particular that currently have a record or near-record net number of big positive days.
All of them preceded at least multi-month exhaustion points.

| Stat Box More than 98% of stocks in the S&P 500 Information Technology sector closed above their 200-day moving averages on Thursday. In the past 20 years, this has been exceeded only 3 other distinct times (June 2003, September 2009, and March 2017). |
What else we're looking at
- Closer detail on other instances of large up days swamping large down days
- Charts dating back to 1926 showing the net number of big up/down days for all 10 major sectors
- What it means when the Nikkei 225 sees a jump in stocks at 1-month lows
- Gaining an edge with a simple 2-factor seasonality + trend model, and what it's saying now