Data &
Technology
Research
Reports
Report Solutions
Reports Library
Actionable
Strategies
Free
Resources
Simple Backtest Calculator
Simple Seasonality Calculator
The Kelly Criterion Calculator
Sentiment Geo Map
Public Research Reports
Free Webinar
Pricing
Company
About
Meet Our Team
In the News
Testimonials
Client Success Stories
Contact
Log inLoginSign up
< BACK TO ALL REPORTS

This Just Happened for Only the 4th Time in 20 Years

Jason Goepfert
2021-09-21
For the first time in nearly a year, fewer than 60% of NYSE securities were trading above their 200-day moving averages.

We've looked at a lot of momentum and breadth studies in recent months, with the conclusion that 2021 has been a year for the record books. The few precedents often witnessed some short-term soft spots but consistently good longer-term returns.

Broader market breadth has been weakening for months, but major indexes shrugged that off with ease. Among stocks traded on the NYSE, fewer and fewer have been holding above their 200-day moving averages. That happened in 2014 and 2017 as well, but it persisted for a very long time.

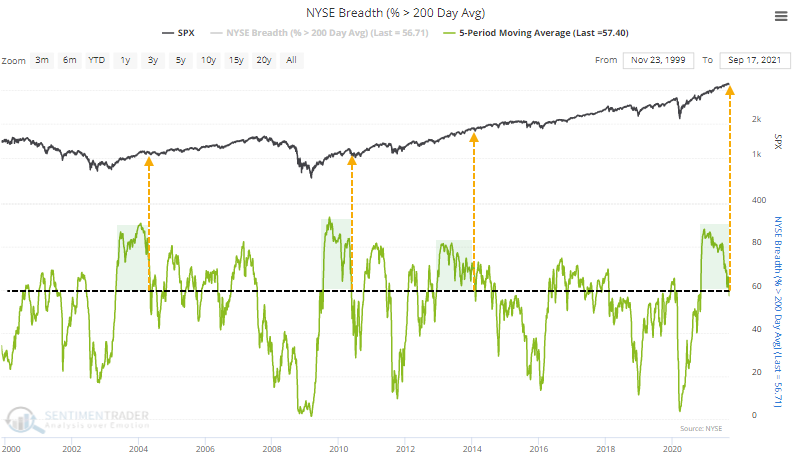
The 5-day average of this figure dropped below 60% for the first time in over 200 sessions, ending the 13th-longest streak since 1928. 

Like we've seen with most of the other studies that looked at long-term momentum and positive breadth, the ends of streaks like this typically did not morph into something more serious. Out of the 12 precedents, only one preceded a double-digit decline over any time frame.

When the other long streaks ended, the S&P 500 was an average of 5.8% below a multi-year high at the time. When the streak ended last week, the S&P was only 2.1% from its peak, the shallowest pullback of all.


What else we're looking at

  • Full returns following the ends of long streaks with positive NYSE breadth since 1928
  • What happens after the S&P 500 finally has back-to-back closes below its 50-day moving average
  • How SPY has typically reacted after panic gaps down after weekend news headlines
  • Silver has made a round-trip from massive gains to a 52-week low
  • A look at this week's seasonal tendency
  • An update on absolute and relative trends in sector, industry, and country ETFs

Stat box

Traders pulled more than $1.2 billion out of the DIA Dow Industrials ETF on Monday. That's the most in a year and only the 5th time in 5 years when the fund's outflow exceeded $1 billion.

Etcetera

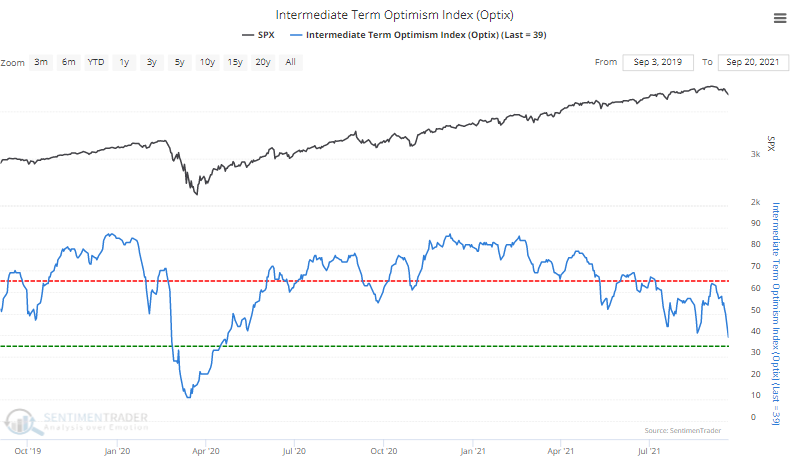
Waning optimism. Medium-term sentiment has declined to the lowest level of the past year. Over the past two years, only February - April 2020 saw investors less enthusiastic than they are now.

medium term sentiment optimism index

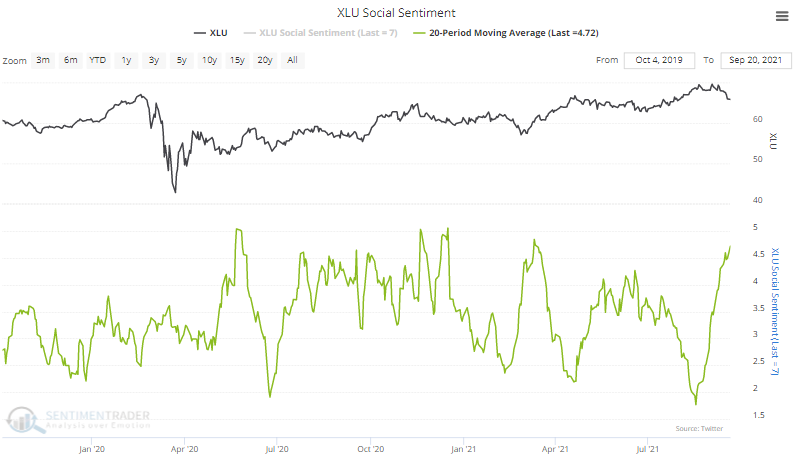
Socially unacceptable. Over the past month, the XLU utilities fund has seen an average of more than 4.5 negative mentions on Twitter for every positive mention. That's nearing the most in the past year.

xlu utilities social sentiment twitter

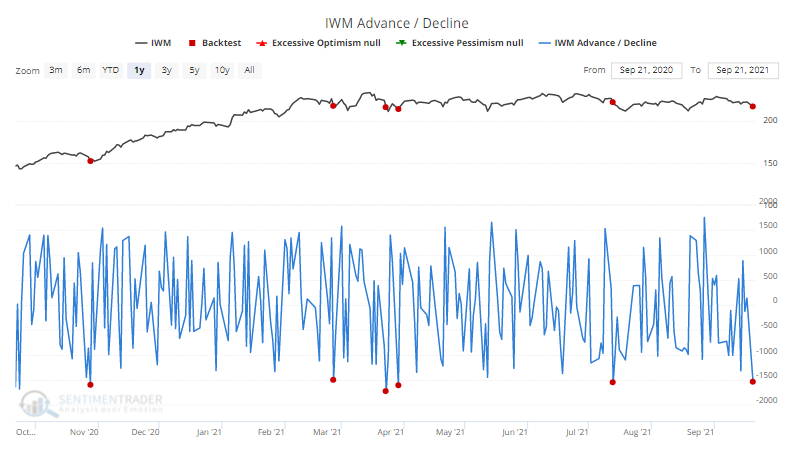
Big declines in small stocks. Within the Russell 2000, nearly 1,600 more stocks declined than advanced on Monday, only the 6th time in the past year when selling pressure was so overwhelming.

iwm russell 2000 small cap advance decline breadth

DATA &
TECHnologies
IndicatorEdge
‍
BackTestEdge
‍
Other Tools
‍
DataEdge API
RESEARCH
reports
Research Solution
‍
Reports Library
‍
actionable
Strategies
Trading Strategies
‍
Smart Stock Scanner
‍
FREE
RESOUrCES
Simple Backtest
Calculator
Simple Seasonality
Calculator
The Kelly Criterion
Calculator
Sentiment Geo Map
‍
Public Research Reports
‍
Free Webinar
COMPANY
‍
About
‍
Meet our Team
‍
In the News
‍
Testimonials
‍
Client Success Stories
Pricing
Bundle pricing
‍
Announcements
‍
FAQ
© 2024 Sundial Capital Research Inc. All rights reserved.
Setsail Marketing
TermsPrivacyAffiliate Program
Risk Disclosure: Futures and forex trading contains substantial risk and is not for every investor. An investor could potentially lose all or more than the initial investment. Risk capital is money that can be lost without jeopardizing ones’ financial security or life style. Only risk capital should be used for trading and only those with sufficient risk capital should consider trading. Past performance is not necessarily indicative of future results.

Hypothetical Performance Disclosure: Hypothetical performance results have many inherent limitations, some of which are described below. No representation is being made that any account will or is likely to achieve profits or losses similar to those shown; in fact, there are frequently sharp differences between hypothetical performance results and the actual results subsequently achieved by any particular trading program. One of the limitations of hypothetical performance results is that they are generally prepared with the benefit of hindsight. In addition, hypothetical trading does not involve financial risk, and no hypothetical trading record can completely account for the impact of financial risk of actual trading. for example, the ability to withstand losses or to adhere to a particular trading program in spite of trading losses are material points which can also adversely affect actual trading results. There are numerous other factors related to the markets in general or to the implementation of any specific trading program which cannot be fully accounted for in the preparation of hypothetical performance results and all which can adversely affect trading results.

Testimonial Disclosure: Testimonials appearing on this website may not be representative of other clients or customers and is not a guarantee of future performance or success.