This is Why Drivers Should See Some Relief
At the moment, given the non-stop rise in the price of crude oil in the last year and the pickup of inflation in recent months, there is a lot of concern regarding the future direction of gasoline prices. Human nature being what it is, this is understandable. Which make this an opportune time to invoke the following:
Jay's Kaeppel's Trading Maxim #16: Human nature can be detrimental to trading success and should be avoided as much as, um, humanly possible.
The chart below displays retail gas prices since 1991 as reported the U.S. Retail Automotive Gasoline Total Regular Average spot price, sourced from the U.S. Department of Energy. Again, with prices surging recently to a 4-year high, the heightened level of concern is understandable.
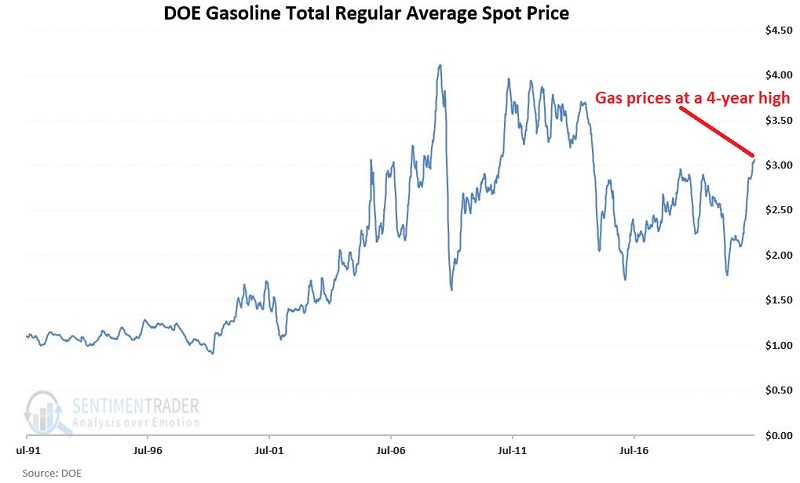
At first blush, there does not appear to be much rhyme or reason to the fluctuations in the price of gasoline. However, if we dig a little deeper, it turns out that there is a great deal of cyclicality to it.
The chart below displays the annual seasonal trend for Unleaded Gas futures.
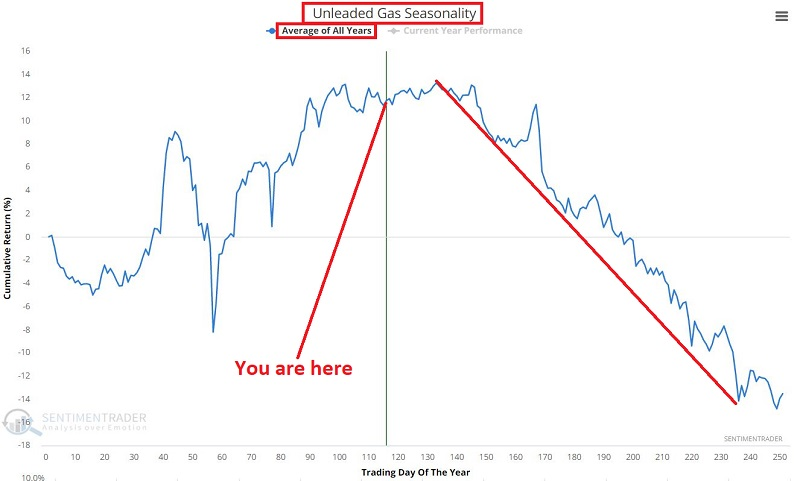
Does anything jump out at you in the chart above? If your vision is even remotely functional, you likely picked up on the significant weakness that tends to occur in the second half of the year.
This raises an interesting question: "Does this cyclicality in the futures market translate in any way to the price at the pump?" That answer to that question depends on how closely gas prices correlate to unleaded gas futures.
Read the full piece for free by clicking here
What else we're looking at
- A reason why gas prices might decline during the summer months
- A detailed look at asset and sector returns when the dollar jumps on an FOMC rate decision day
- What happens when there is a jump in S&P 500 stocks at a 1-month low
| Stat box On Thursday, the S&P 500 closed within 1% of its high but more than 40% of its stocks plunged to a 1-month low. Going back to 1927, this is a record amount of stocks at 1-month lows with the index itself being within 1% of a 52-week high. |
Etcetera
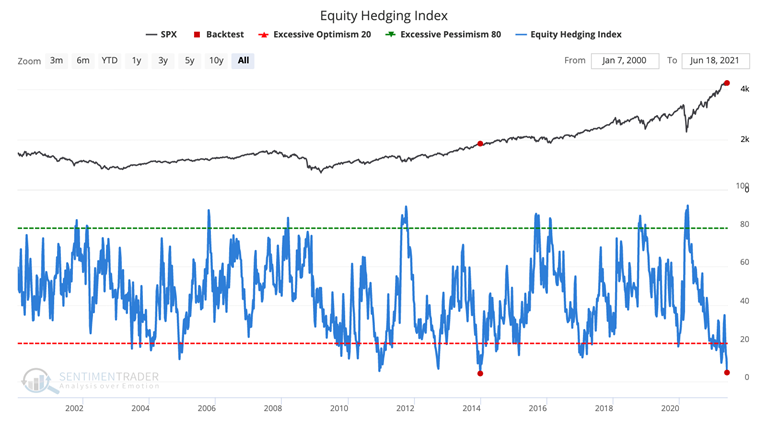
Hedging bets. The Equity Hedging Index has dropped below 5 for only the second time in history. This shows that investors are employing very few hedging strategies.
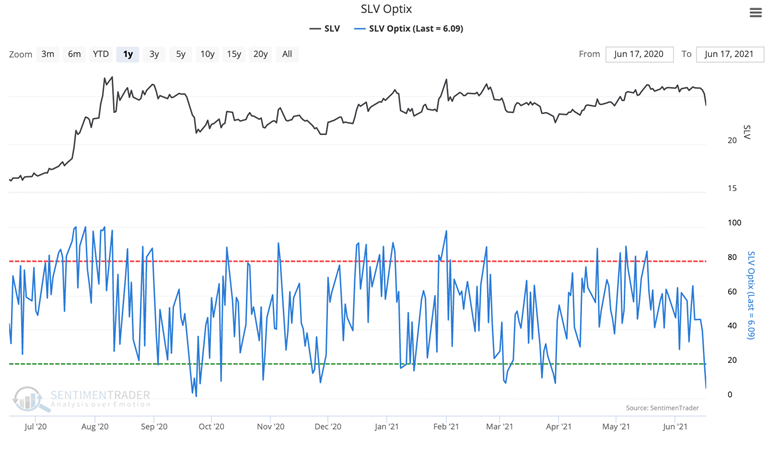
Sliding silver. The SLV Optimism Index has reached its lowest point since August 2020, sitting at 6%. This is a sign of extreme short-term pessimism in silver.
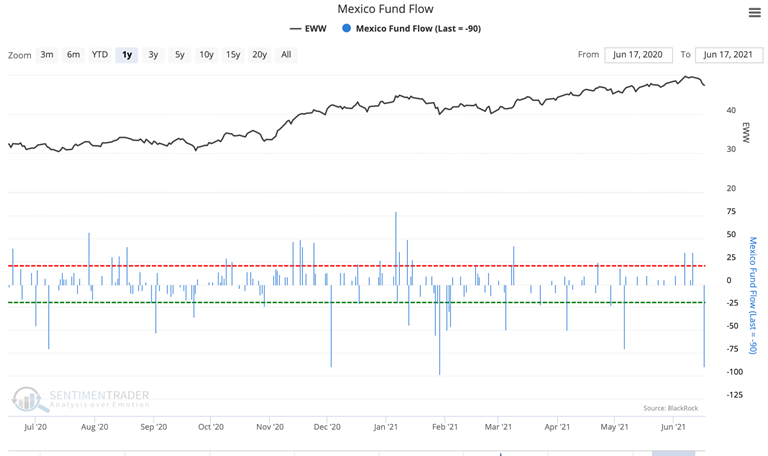
Going loco. The Mexico Fund, EWW, has seen its second-largest withdraw of the year, with $90 million being withdrawn from the fund. The largest outflow occurred near the fund's low point near the end of January.
