Data &
Technology
Research
Reports
Report Solutions
Reports Library
Actionable
Strategies
Free
Resources
Simple Backtest Calculator
Simple Seasonality Calculator
The Kelly Criterion Calculator
Sentiment Geo Map
Public Research Reports
Free Webinar
Pricing
Company
About
Meet Our Team
In the News
Testimonials
Client Success Stories
Contact
Log inLoginSign up
< BACK TO ALL REPORTS

This Is The Biggest Cluster of Nasdaq Warnings in 6 Years

Jason Goepfert
2021-08-18
Split market conditions in the Nasdaq Composite index have triggered technical warnings like the Hindenburg Omen and Titanic Syndrome.

Despite new highs in many of the major U.S. equity indexes, the old school NYSE Advance/Decline Line hadn't made a fresh high for over two months.

It's worse on the Nasdaq.

On Monday, the Nasdaq Composite closed within 1% of a 52-week high, and yet two long-term measures of breadth on that exchange fell to very low levels. The McClellan Summation Index closed below -350, and the New High / New Low Ratio was below 30%. Those are the worst figures in history, dating back to 1986, for a day when the Composite was so near a high.

This internal tumult has been triggering some technical warning signs, such as the Hindenburg Omen and Titanic Syndrome for the Nasdaq exchange. 

Over the past 30 sessions, a combined 13 signals have been triggered, the most in six years.

hindenburg omen and titanic syndrome warning signs

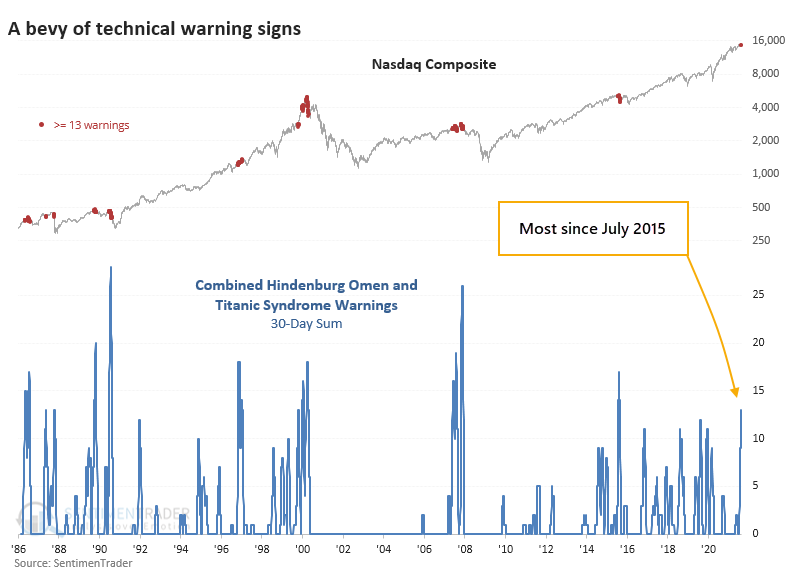
When there has been such a cluster of signals with the Composite within spitting distance of a new high, trouble was brewing most of the time. The Nasdaq escaped any damage in 1996, 1999 (for a while), and 2016 but otherwise witnessed high volatility and negative returns.

After the speculative blow-off in late January - early February of this year, we've been on the lookout for major deterioration under the surface of the indexes. There have been periodic bouts of that since then, and the indexes have almost immediately recovered. We'll have to see if this is yet another episode.


What else we're looking at

  • Returns after the Nasdaq Composite is near a high, with a low Summation Index and New High / New Low Ratio
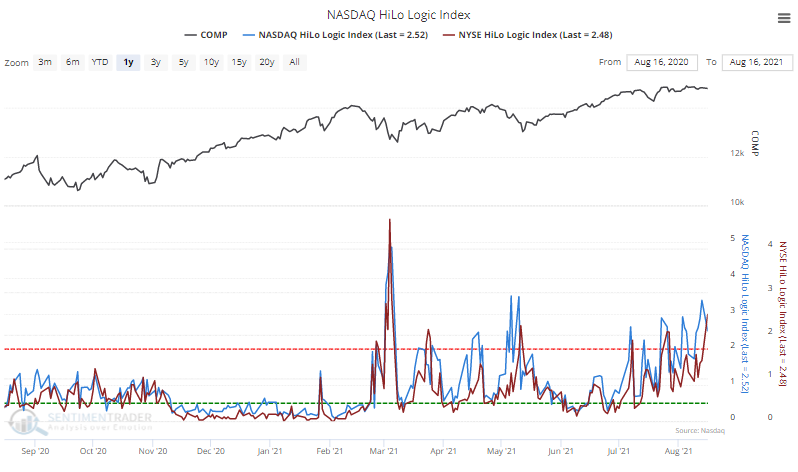
  • What an extreme HiLo Logic Index means for the Composite
  • Taking a look at several index ratios an investor should be watching
  • Transportation stocks just triggered a reversal signal

Stat box

Traders shoveled even more money into the SPY fund, tracking the S&P 500 index, on Tuesday. The average over the past 3 days has now climbed to more than $2.5 billion. Our Backtest Engine shows that over the past decade, that high of an inflow during an uptrend has led to an average 2-week return of -0.5% for SPY.

Etcetera

Hi ho, HiLo. The HiLo Logic Index is high for both the NYSE and Nasdaq, showing that the exchanges are abnormally split between many stocks hitting 52-week highs and 52-week lows at the same time.

hilo logic index

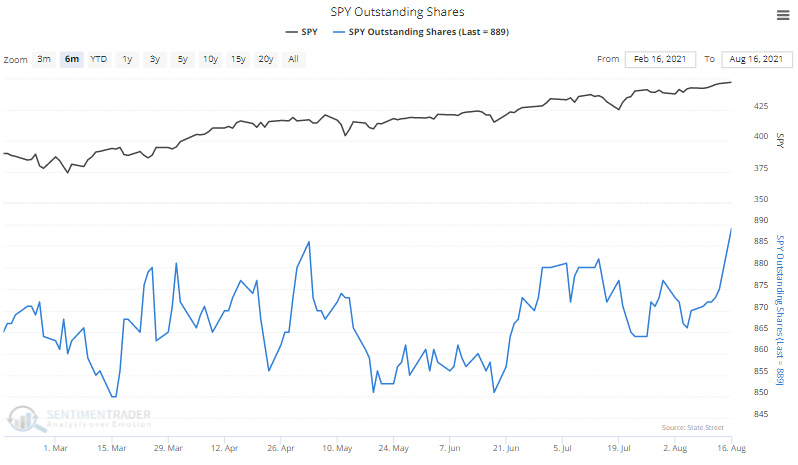
Get me in! There has been a sudden increase in shares outstanding in the S&P 500 fund, SPY. This could be the creation of units to satisfy short-sellers, but more likely it's demand from buyers.

spy shares outstanding

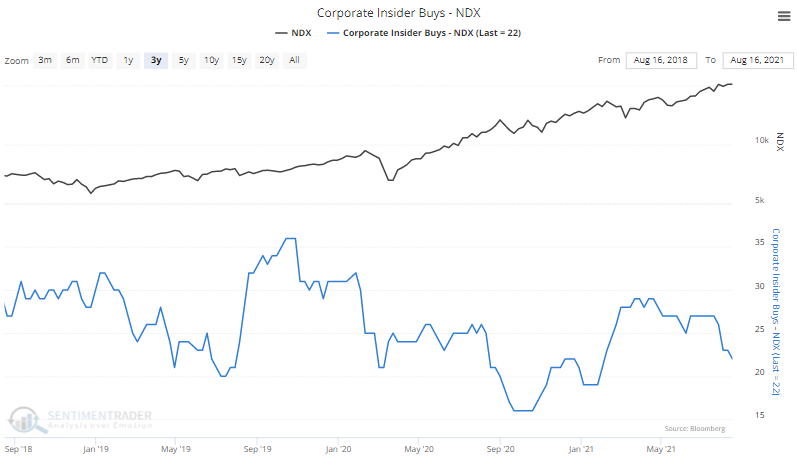
Tepid on tech. The number of corporate insiders buying shares in Nasdaq 100 companies over the past 6 months has slowed to one of the lowest levels of the past 3 years.

nasdaq 100 ndx insider buying

DATA &
TECHnologies
IndicatorEdge
‍
BackTestEdge
‍
Other Tools
‍
DataEdge API
RESEARCH
reports
Research Solution
‍
Reports Library
‍
actionable
Strategies
Trading Strategies
‍
Smart Stock Scanner
‍
FREE
RESOUrCES
Simple Backtest
Calculator
Simple Seasonality
Calculator
The Kelly Criterion
Calculator
Sentiment Geo Map
‍
Public Research Reports
‍
Free Webinar
COMPANY
‍
About
‍
Meet our Team
‍
In the News
‍
Testimonials
‍
Client Success Stories
Pricing
Bundle pricing
‍
Announcements
‍
FAQ
© 2024 Sundial Capital Research Inc. All rights reserved.
Setsail Marketing
TermsPrivacyAffiliate Program
Risk Disclosure: Futures and forex trading contains substantial risk and is not for every investor. An investor could potentially lose all or more than the initial investment. Risk capital is money that can be lost without jeopardizing ones’ financial security or life style. Only risk capital should be used for trading and only those with sufficient risk capital should consider trading. Past performance is not necessarily indicative of future results.

Hypothetical Performance Disclosure: Hypothetical performance results have many inherent limitations, some of which are described below. No representation is being made that any account will or is likely to achieve profits or losses similar to those shown; in fact, there are frequently sharp differences between hypothetical performance results and the actual results subsequently achieved by any particular trading program. One of the limitations of hypothetical performance results is that they are generally prepared with the benefit of hindsight. In addition, hypothetical trading does not involve financial risk, and no hypothetical trading record can completely account for the impact of financial risk of actual trading. for example, the ability to withstand losses or to adhere to a particular trading program in spite of trading losses are material points which can also adversely affect actual trading results. There are numerous other factors related to the markets in general or to the implementation of any specific trading program which cannot be fully accounted for in the preparation of hypothetical performance results and all which can adversely affect trading results.

Testimonial Disclosure: Testimonials appearing on this website may not be representative of other clients or customers and is not a guarantee of future performance or success.