Data &
Technology
Research
Reports
Report Solutions
Reports Library
Actionable
Strategies
Free
Resources
Simple Backtest Calculator
Simple Seasonality Calculator
The Kelly Criterion Calculator
Sentiment Geo Map
Public Research Reports
Free Webinar
Pricing
Company
About
Meet Our Team
In the News
Testimonials
Client Success Stories
Contact
Log inLoginSign up
< BACK TO ALL REPORTS

This Indicator Put April in The History Books

Jason Goepfert
2021-05-06
Across 3 different time frames, breadth within the S&P 500 in April 2021 was the 7th most impressive of all months since 1928.

Since at least December, there have been two competing forces at work. They've both been so extreme and at opposite ends of the spectrum that we've never really seen the tension quite so high before.

Those two forces are sentiment and momentum. While they are often in conflict, what's unusual about the last few months is that we've seen the type of sentiment normally witnessed near the ends of bull markets. At the same time, we've seen momentum and thrusts normally witnessed at the beginnings of them.

The momentum we've discussed isn't just the price gains in major averages. It's mostly the internal health of the moves, especially since October. Participation among stocks, industries, sectors, and even countries has been stellar - even record-breaking.

Bloomberg notes that April 2021 was the best month in history for one common indicator of market breadth. No other month had seen so many stocks hover above their 200-day moving averages.

"During 18 sessions this month through trading on Thursday, 95% or more of the index's members traded above their 200-day moving average. That's the most days ever observed in a single calendar month and double the previous high of nine days in September 2009." - Bloomberg

The Bloomberg article highlighted the percentage of S&P 500 members trading above their 200-day moving averages. But last month stands out for showing among the best trends ever across short-, medium-, and long-term time frames.

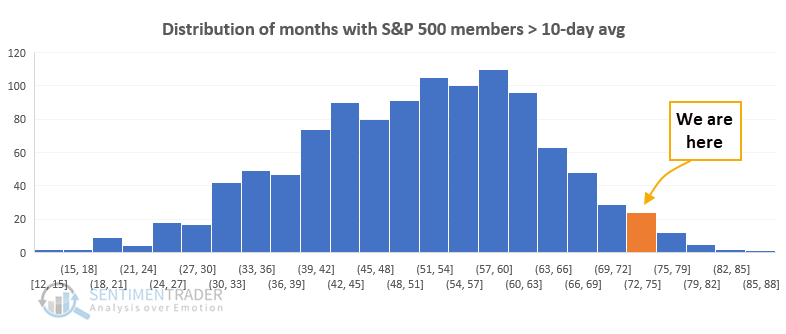
During the entire month of April, 73% of S&P members traded above their 10-day moving averages on an average day. That puts last month near the far right on the distribution curve of all months.

Breadth thrust months most stocks above 10 day moving average

Looking at all three time frames, April 2021 made the top 20 months only with the percentage trading above their 200-day averages. 

Even so, last month ranked relatively high on all 3 metrics, as we could see from the distribution graphs above. When we average all 3 together, April 2021 ranked as the 7th best breadth month ever.

Stat Box

The largest ETF in the world, the S&P 500 tracking fund SPY, closed below its opening price for the 7th day in a row. That's tied for the 4h-longest stretch of intraday selling pressure since the fund's inception in 1993.


What else we're looking at

  • Full details on April 2021's place on breadth thrusts all-time
  • Future returns following the best monthly breadth thrusts since 1928
  • A deeper look into the April Barometer
DATA &
TECHnologies
IndicatorEdge
‍
BackTestEdge
‍
Other Tools
‍
DataEdge API
RESEARCH
reports
Research Solution
‍
Reports Library
‍
actionable
Strategies
Trading Strategies
‍
Smart Stock Scanner
‍
FREE
RESOUrCES
Simple Backtest
Calculator
Simple Seasonality
Calculator
The Kelly Criterion
Calculator
Sentiment Geo Map
‍
Public Research Reports
‍
Free Webinar
COMPANY
‍
About
‍
Meet our Team
‍
In the News
‍
Testimonials
‍
Client Success Stories
Pricing
Bundle pricing
‍
Announcements
‍
FAQ
© 2024 Sundial Capital Research Inc. All rights reserved.
Setsail Marketing
TermsPrivacyAffiliate Program
Risk Disclosure: Futures and forex trading contains substantial risk and is not for every investor. An investor could potentially lose all or more than the initial investment. Risk capital is money that can be lost without jeopardizing ones’ financial security or life style. Only risk capital should be used for trading and only those with sufficient risk capital should consider trading. Past performance is not necessarily indicative of future results.

Hypothetical Performance Disclosure: Hypothetical performance results have many inherent limitations, some of which are described below. No representation is being made that any account will or is likely to achieve profits or losses similar to those shown; in fact, there are frequently sharp differences between hypothetical performance results and the actual results subsequently achieved by any particular trading program. One of the limitations of hypothetical performance results is that they are generally prepared with the benefit of hindsight. In addition, hypothetical trading does not involve financial risk, and no hypothetical trading record can completely account for the impact of financial risk of actual trading. for example, the ability to withstand losses or to adhere to a particular trading program in spite of trading losses are material points which can also adversely affect actual trading results. There are numerous other factors related to the markets in general or to the implementation of any specific trading program which cannot be fully accounted for in the preparation of hypothetical performance results and all which can adversely affect trading results.

Testimonial Disclosure: Testimonials appearing on this website may not be representative of other clients or customers and is not a guarantee of future performance or success.