Data &
Technology
Research
Reports
Report Solutions
Reports Library
Actionable
Strategies
Free
Resources
Simple Backtest Calculator
Simple Seasonality Calculator
The Kelly Criterion Calculator
Sentiment Geo Map
Public Research Reports
Free Webinar
Pricing
Company
About
Meet Our Team
In the News
Testimonials
Client Success Stories
Contact
Log inLoginSign up
< BACK TO ALL REPORTS

This indicator is now giving a warning for stocks

Jason Goepfert
2021-03-25
For the first time in many months, there are more 52-week lows than 52-week highs among securities on the NYSE.

One of the major developments we've been watching for since there was overwhelming evidence of excessive optimism is weakening internals.

That can take any number of forms, and for the most part, we haven't really seen it until very recently.

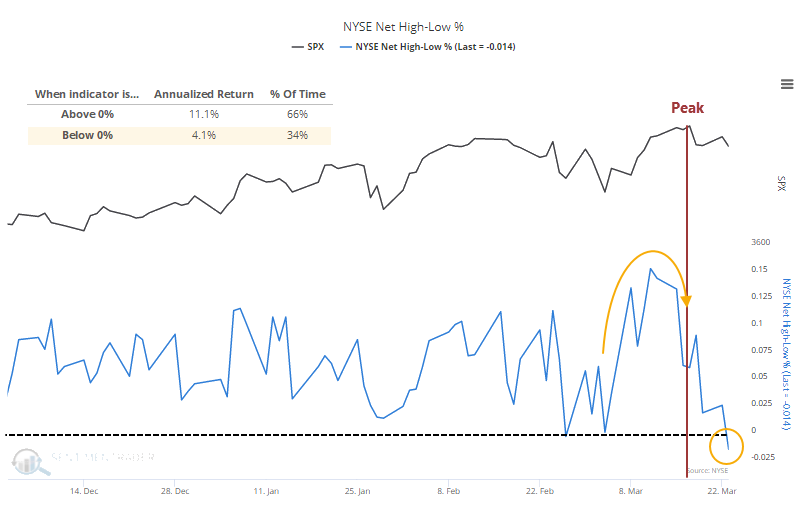
One of the clearest ways to look for this is the net percentage of securities on the NYSE that reach 52-week highs versus 52-week lows. After the surge in new highs in early March, there was a minor divergence as those figures weakened even as the S&P 500 made a new high, but it wasn't major.

More concerning is that by Tuesday, there were more 52-week lows than 52-week highs. We don't care that it was caused by a fall in SPACs or any other excuse - there's always something.

NYSE net new highs new lows

The reason we shouldn't expect a protracted divergence this time is simply how far stocks have traveled. Across all the major equity indexes, and throwing in over-the-counter stocks just because they have seen such a tremendous surge of interest, the median stock is up more than 100% from its lows.

What else we're looking at

  • Looking at other peaks in recent years, compared to behavior in the NYSE New High / New Low indicator
  • Charts of the median stock gain in the S&P 500, Dow Industrials, Nasdaq 100, Russell 2000, and OTC market
  • Comparing 1-year returns across sectors and factors versus a typical 1-year anniversary from a bear market low
  • Looking at gold and its 4-year cycle
  • What happens when there is a surge in equity inflows relative to stock market capitalization
  • An update on our Relative Range Rank for risk-on index ratios

Stat Box

Emerging markets indexes fell into a correction, 10% below their highs, for the first time since hitting new highs in February. This is the 16th time they've done so since 1987.


Etcetera

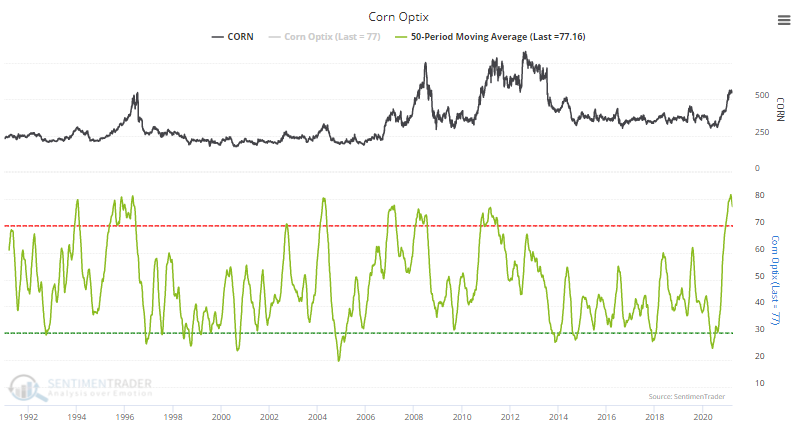
Harvesting gains. Investors in corn futures have been plenty hopeful, driving a 50-day moving average of the Optimism Index close to record highs. That's now starting to turn.

corn sentiment

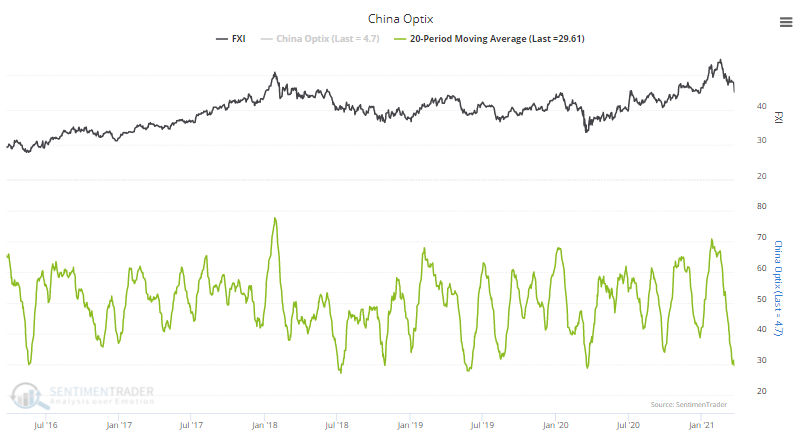
Not feeling good about the buyers, though. Much of the enthusiasm for grains comes from exports overseas to markets like China. Traders in the FXI fund, though, haven't been too keen about stocks in that market, with the 20-day Optimism Index dropping to one of the lowest levels in 5 years.

china stock sentiment

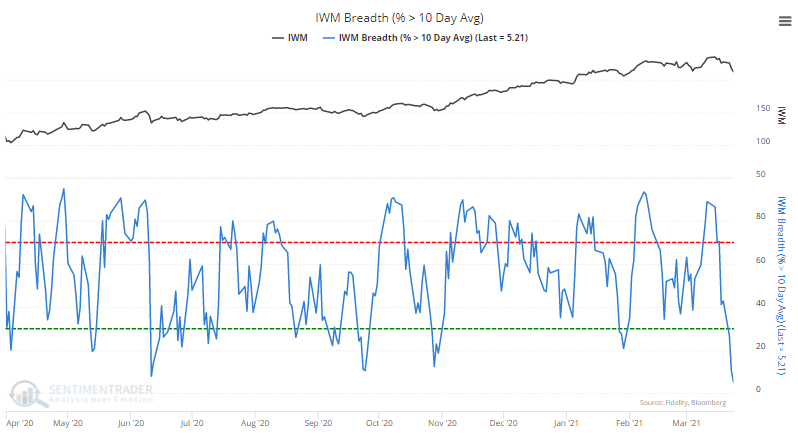
Small-cap smackdown. The carnage in small-cap stocks has pushed so many of them below their 10-day averages that fewer than 5.5% of components in the Russell 2000 remain above those short-term averages, the fewest of this bull market.

small cap russell 2000 percent above 10 day moving average

DATA &
TECHnologies
IndicatorEdge
‍
BackTestEdge
‍
Other Tools
‍
DataEdge API
RESEARCH
reports
Research Solution
‍
Reports Library
‍
actionable
Strategies
Trading Strategies
‍
Smart Stock Scanner
‍
FREE
RESOUrCES
Simple Backtest
Calculator
Simple Seasonality
Calculator
The Kelly Criterion
Calculator
Sentiment Geo Map
‍
Public Research Reports
‍
Free Webinar
COMPANY
‍
About
‍
Meet our Team
‍
In the News
‍
Testimonials
‍
Client Success Stories
Pricing
Bundle pricing
‍
Announcements
‍
FAQ
© 2024 Sundial Capital Research Inc. All rights reserved.
Setsail Marketing
TermsPrivacyAffiliate Program
Risk Disclosure: Futures and forex trading contains substantial risk and is not for every investor. An investor could potentially lose all or more than the initial investment. Risk capital is money that can be lost without jeopardizing ones’ financial security or life style. Only risk capital should be used for trading and only those with sufficient risk capital should consider trading. Past performance is not necessarily indicative of future results.

Hypothetical Performance Disclosure: Hypothetical performance results have many inherent limitations, some of which are described below. No representation is being made that any account will or is likely to achieve profits or losses similar to those shown; in fact, there are frequently sharp differences between hypothetical performance results and the actual results subsequently achieved by any particular trading program. One of the limitations of hypothetical performance results is that they are generally prepared with the benefit of hindsight. In addition, hypothetical trading does not involve financial risk, and no hypothetical trading record can completely account for the impact of financial risk of actual trading. for example, the ability to withstand losses or to adhere to a particular trading program in spite of trading losses are material points which can also adversely affect actual trading results. There are numerous other factors related to the markets in general or to the implementation of any specific trading program which cannot be fully accounted for in the preparation of hypothetical performance results and all which can adversely affect trading results.

Testimonial Disclosure: Testimonials appearing on this website may not be representative of other clients or customers and is not a guarantee of future performance or success.