
This indicator has an almost perfect record at forecasting the end of a bear market

Key points:
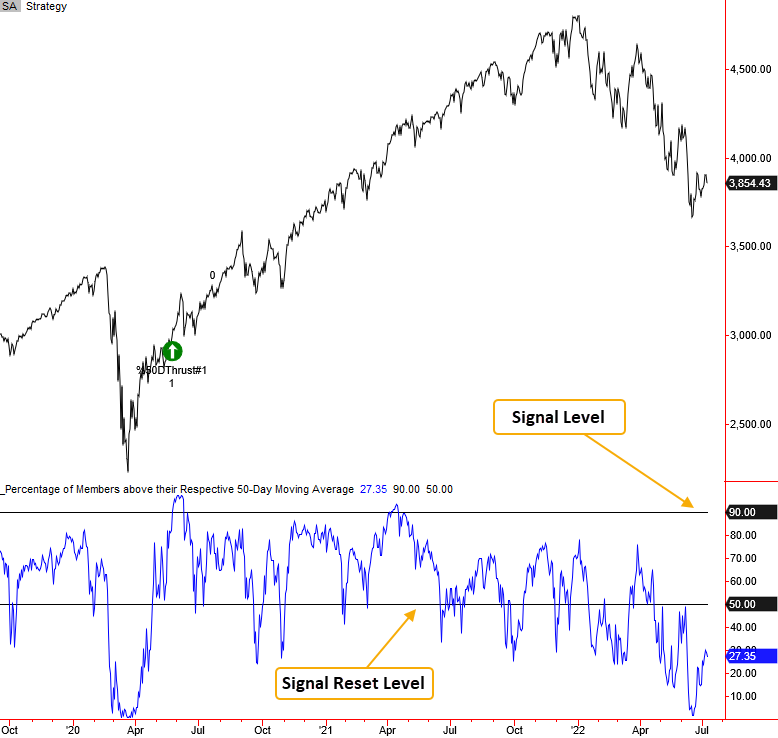
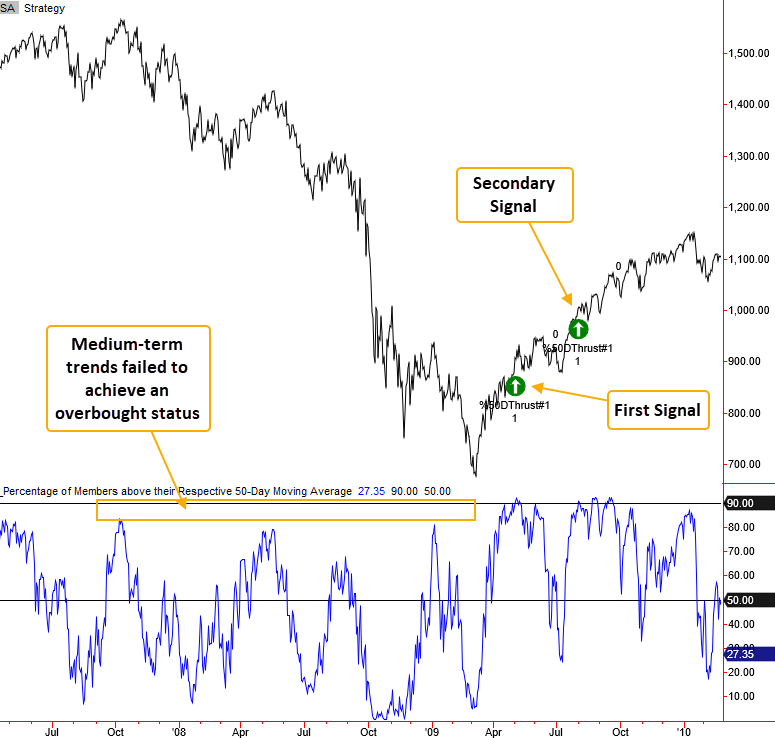
- The number of S&P 500 members trading above their 50-day average remains depressed at 27.35%
- A surge above 90% would most likely mark the end of the current bear market
- The S&P 500 rallied 83% of the time over the next year after bear market signals
- If I isolate the first signal after a bear, the S&P 500 has rallied 79% of the time over the next year
A breadth signal that has an excellent track record in forecasting an end to a bear market
Bear markets are a mental challenge that requires extreme discipline and patience if one is to manage them successfully. Several years ago, I developed my Tactical Composite Trend Model to help me navigate bull and bear cycles. While the TCTM is not a pure black box system, the model provides me with an unbiased and disciplined approach to money management, a hallmark of successful investing.
Today's note aims to review one of the components in the TCTM Composite Thrust Model, as its track record in forecasting an end to a bear market is excellent. If you forced me to pick one indicator out of the ten components in the CTM, this would be the one.
You can follow this indicator on our website and save the signal to your favorites folder in the backtest engine.
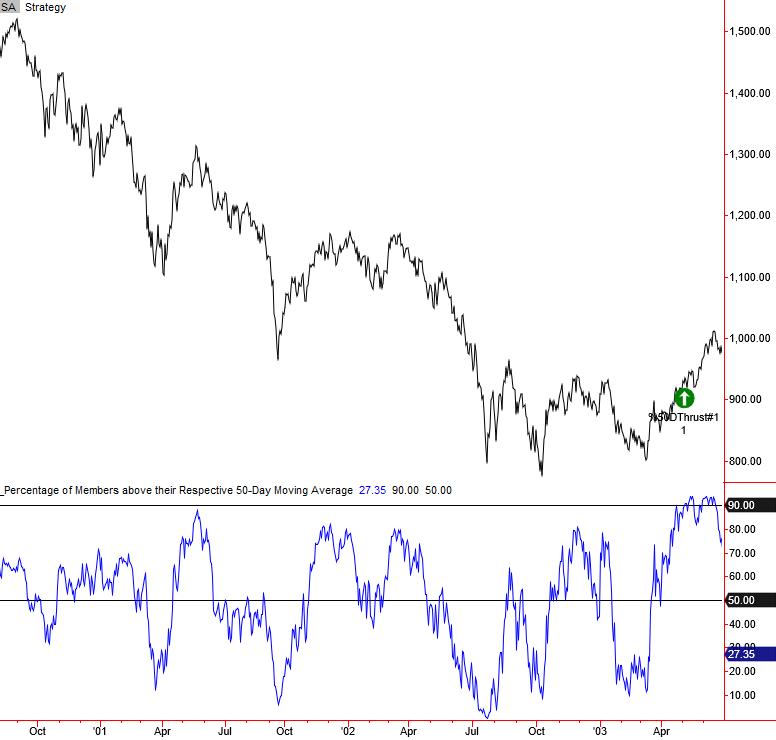
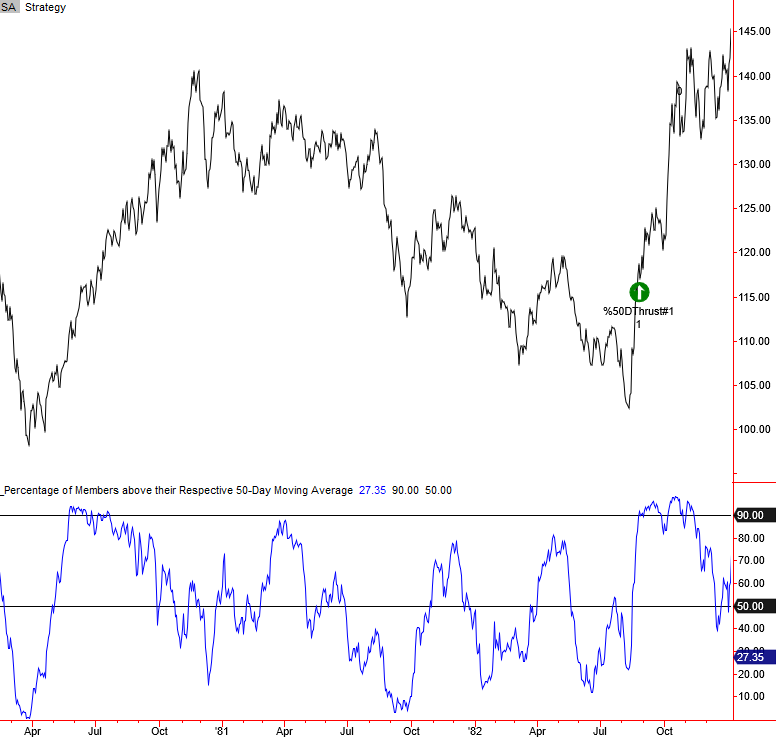
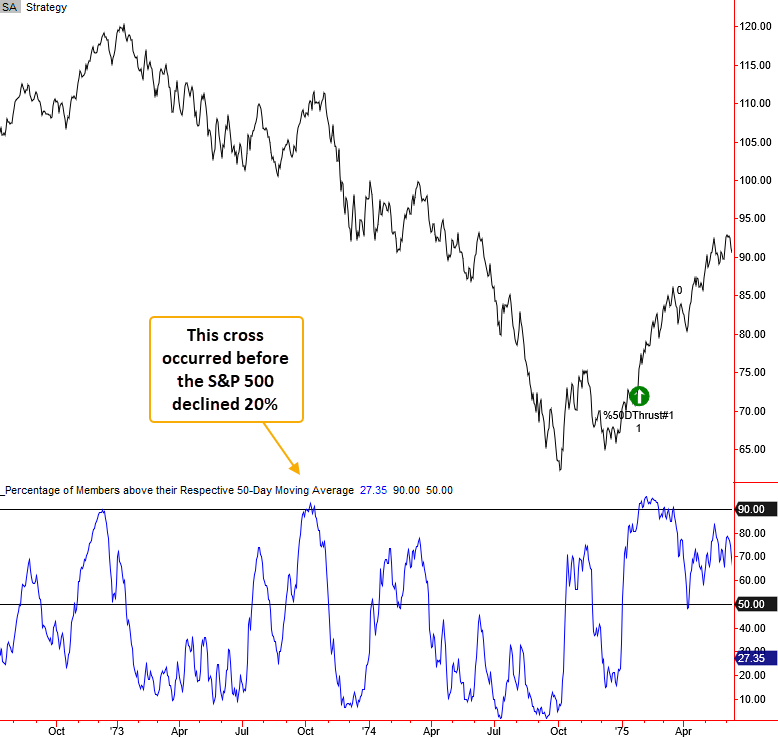
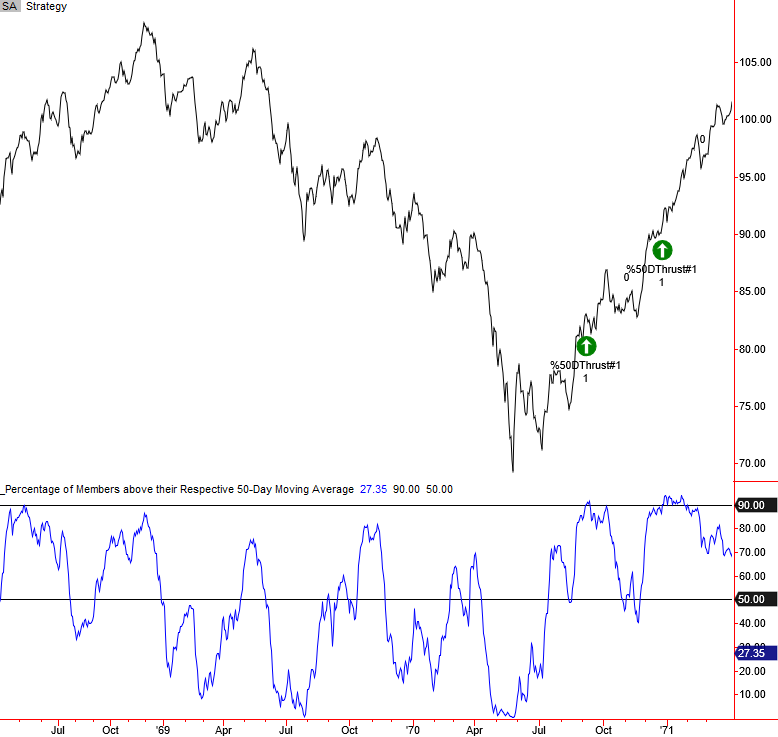
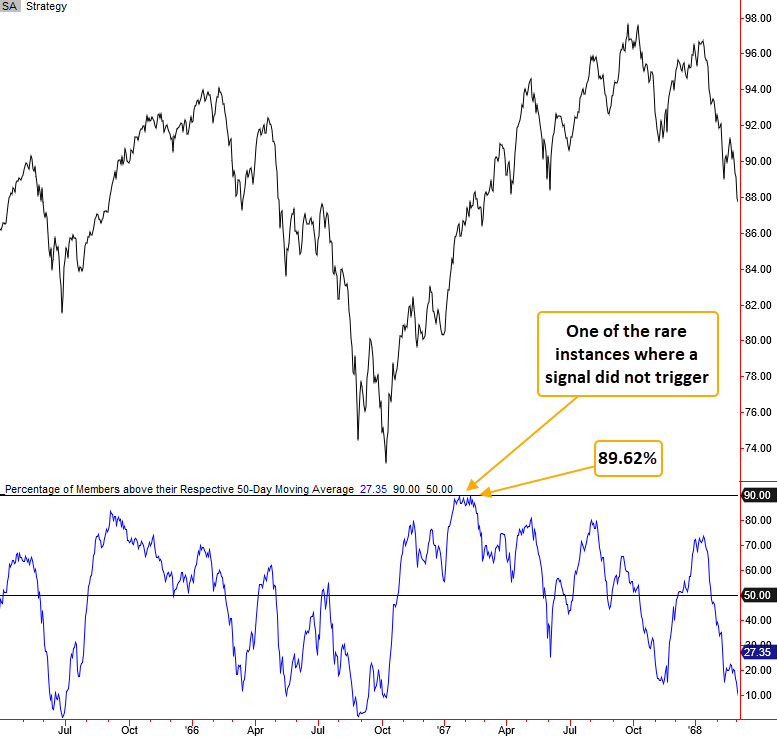
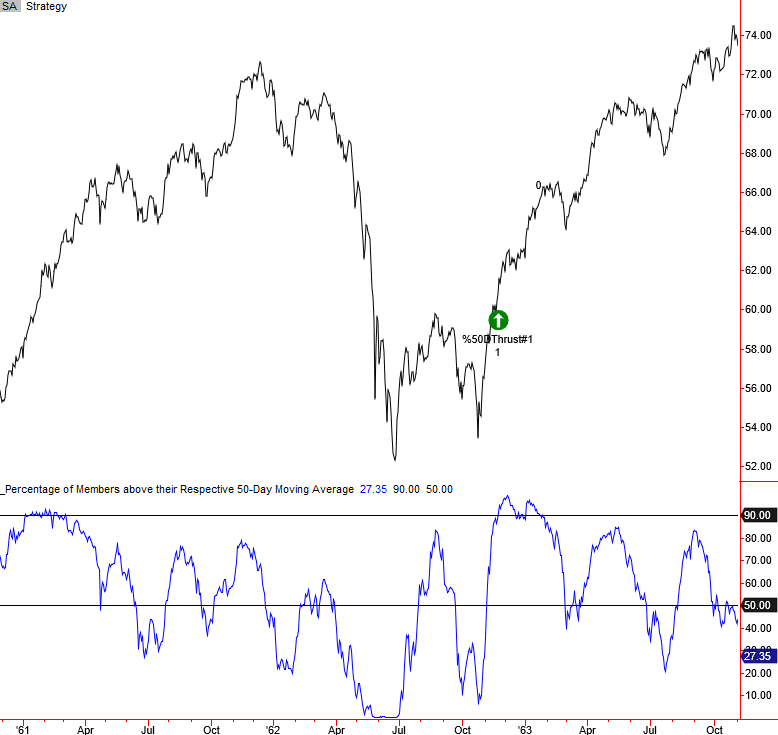
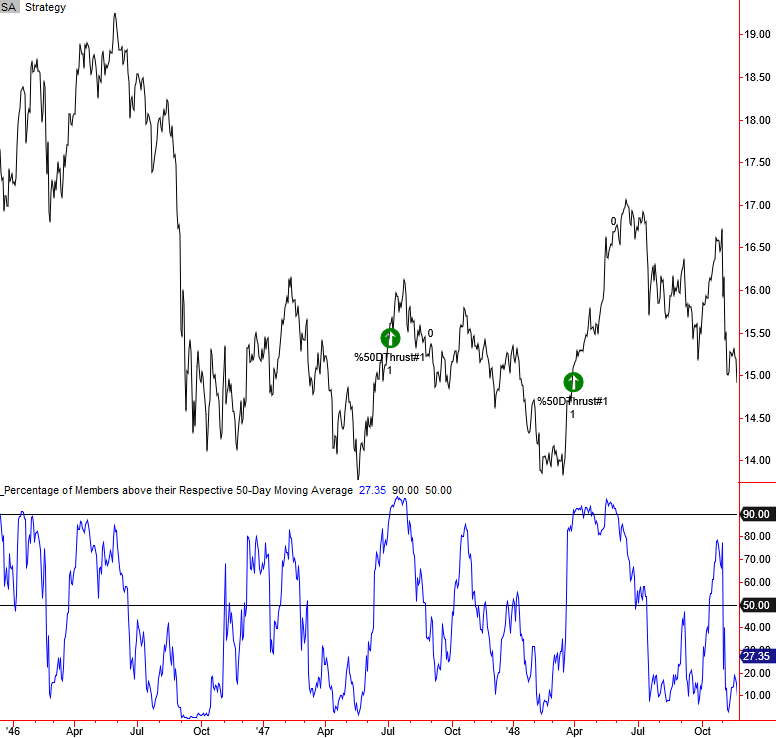
The algorithm identifies when the number of S&P 500 members trading above their 50-day moving average exceeds 90%. I screen out repeats by requiring the number to fall below 50% before a new signal can trigger again.
With the S&P 500 index down 20% from a multi-year high, let's assess the outlook for stocks after a bear market signal. To be clear, I will eliminate instances that occurred within the context of a correction or when the index was at a high.
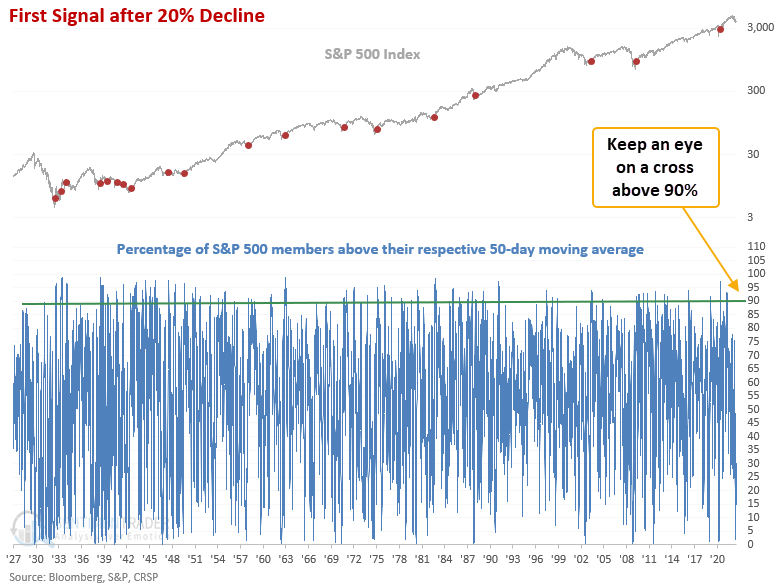
Signals associated with a bear market (down 20% or more from multi-year high)
This model generated a signal 30 times over the past 90 years. After the others, future returns, win rates, and z-scores were excellent across all time frames. The 1-year outlook has maintained a perfect record since 1942. 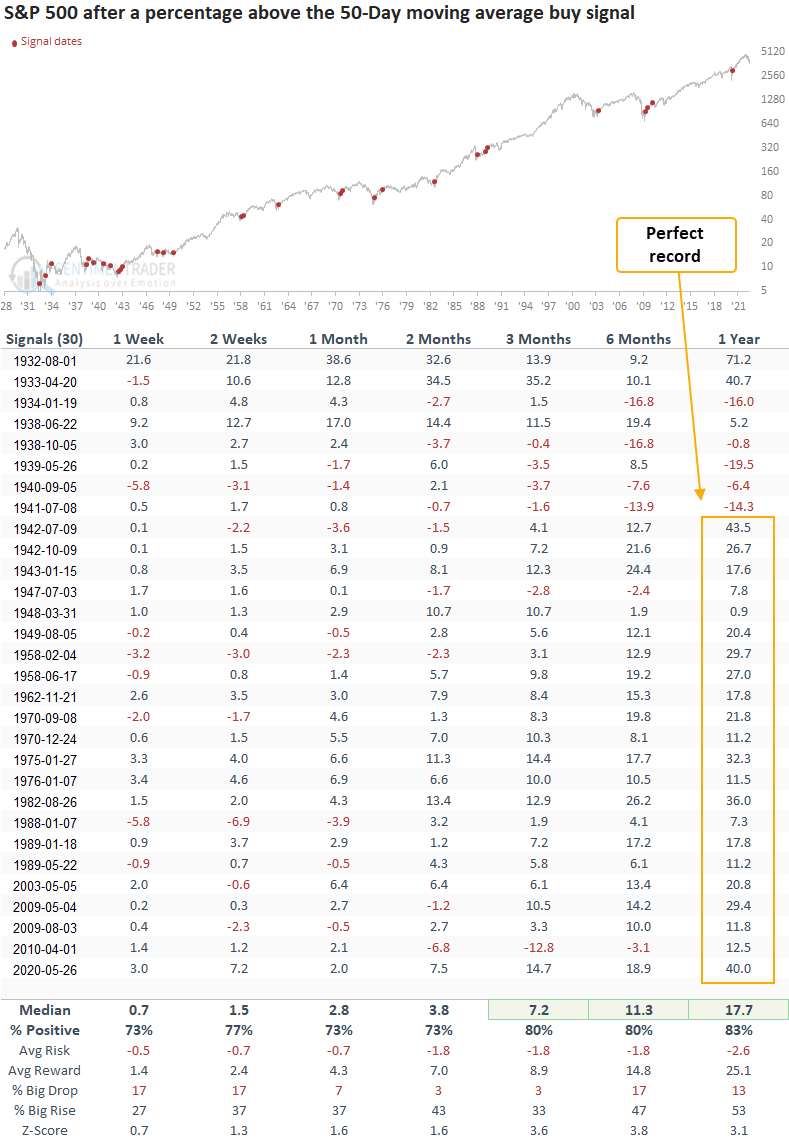
First Signal in a bear market
If I isolate the first signal in a bear market, the model generated a signal 19 times in the last 90 years. After the others, S&P 500 future returns, win rates, and z-scores were solid across all time frames. However, the stats are slightly less robust than in our first table. That means secondary signals had excellent results. Once again, the 1-year outlook has maintained a perfect record since 1942.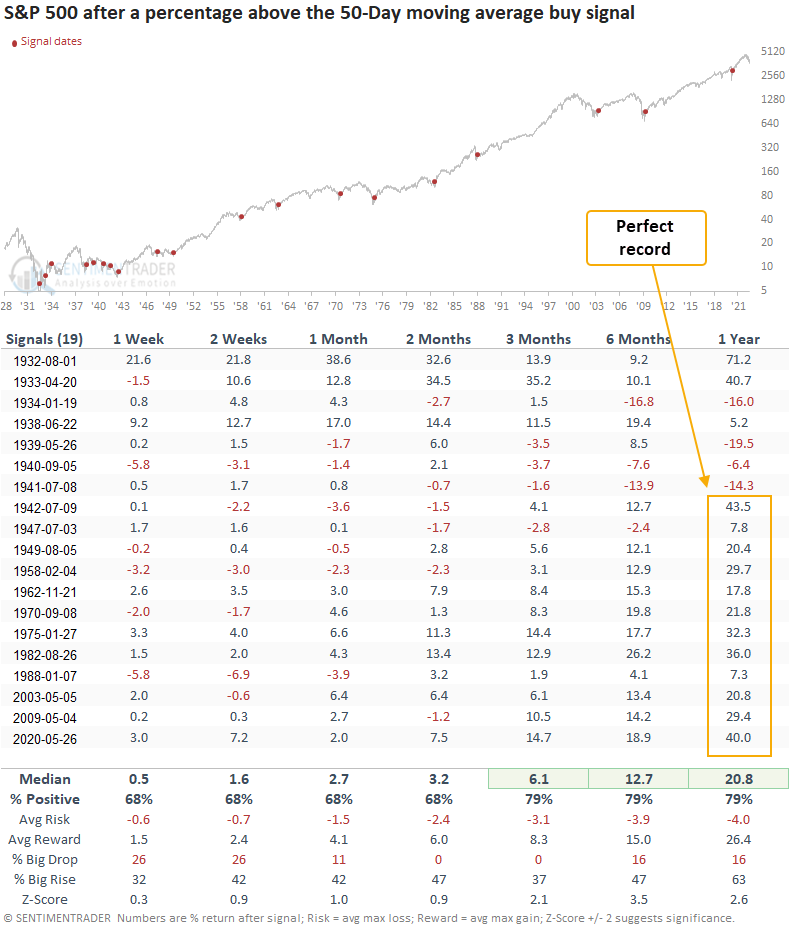
Let's zoom in and review some of the bear market signals/charts since 1929.
Current day chart example
2007-08 bear market chart example
2000-02 bear market chart example
1980-82 bear market chart example
1973-74 bear market chart example
1968-70 bear market chart example
1966 bear market chart example
1962 bear market chart example
1946-49 bear market chart example
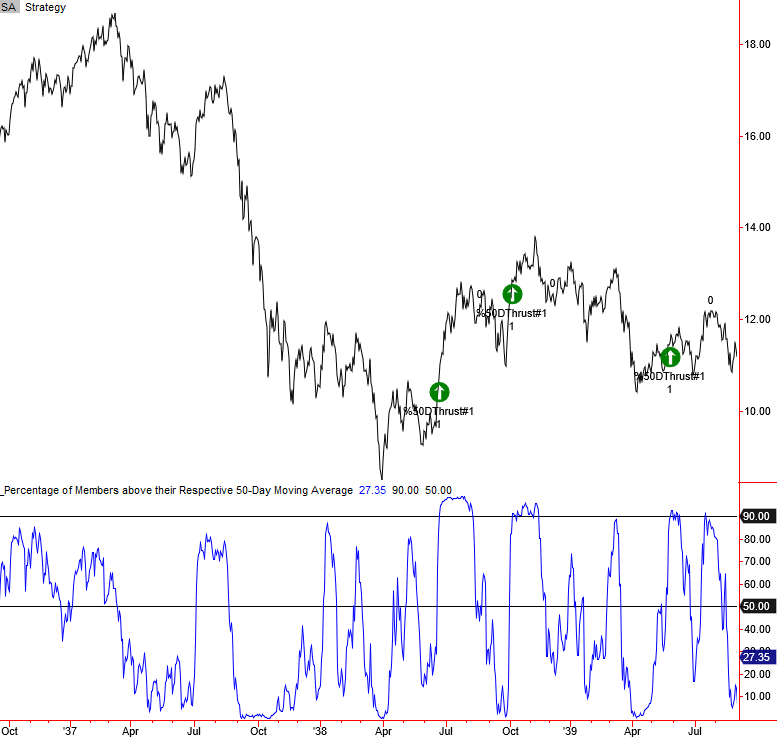
1937-42 bear market chart example
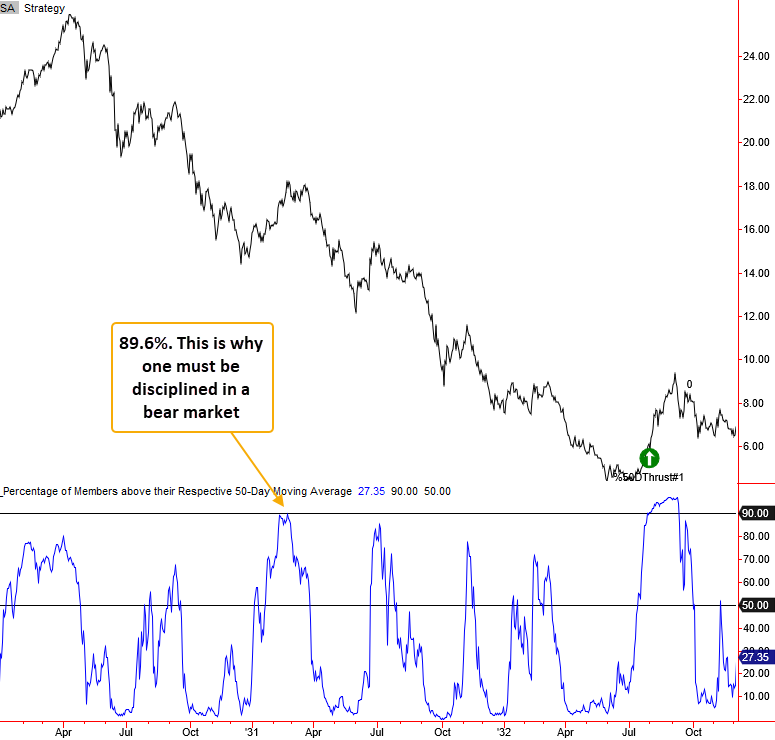
1929-32 bear market chart example
What the research tells us...
When the number of S&P 500 members trading above their 50-day moving average exceeds 90% in a bear market, the reversal in price trends suggests the market has shifted from a cyclical downtrend to an uptrend. The long-term results look excellent, especially the 1-year win rate since 1942. While one should never rely upon a single indicator, this one is about as good as it gets in forecasting an end to a bear market.