Data &
Technology
Research
Reports
Report Solutions
Reports Library
Actionable
Strategies
Free
Resources
Simple Backtest Calculator
Simple Seasonality Calculator
The Kelly Criterion Calculator
Sentiment Geo Map
Public Research Reports
Free Webinar
Pricing
Company
About
Meet Our Team
In the News
Testimonials
Client Success Stories
Contact
Log inLoginSign up
< BACK TO ALL REPORTS

This Granddaddy of All Indicators Just Broke Out

Jason Goepfert
2021-10-28
For the first time in more than 4 months, the NYSE Cumulative Advance/Decline Line broke out to a new high

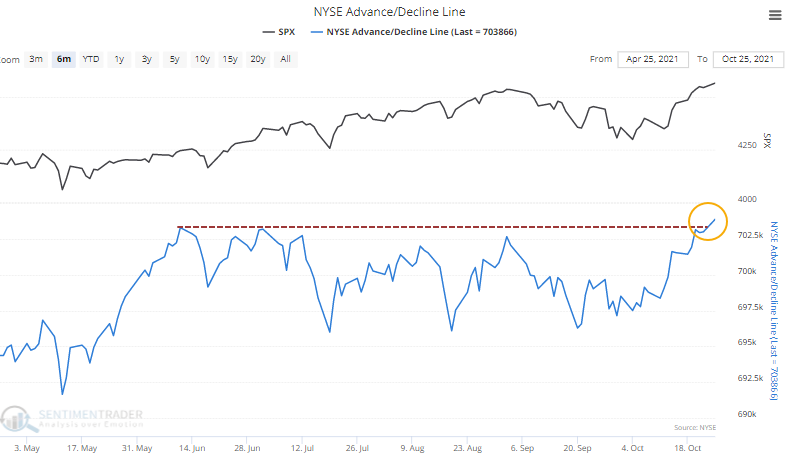
Earlier this week, the Advance/Decline Line for S&P 500 stocks broke out to a new high. A line that incorporates the breadth of all securities traded on the NYSE hadn't quite done the same. Now it has.

For the first time in more than 90 days, the NYSE Cumulative Advance/Decline Line is sitting at a record high. Analysts have focused on this indicator since the earliest days of widespread data dissemination. 

NYSE advance decline line breaks out to new highs

There are all kinds of things traded on the NYSE, with some arguments being that they should be excluded. That's a mistake. Securities with a smaller capitalization or that are especially sensitive to interest rates are suitable to include in breadth measurements.

New highs in the NYSE A/D Line have consistently preceded stock gains since 1928. Over the next three months, there were no losses greater than -8.5% at any point for any signal. On average, drawdowns were limited to only -1.6%.

Just because cumulative breadth measures like the Advance/Decline Line are sitting at new highs, it does not mean stocks can't decline. They can; they can even crash. 

The biggest difference is that those significant declines usually began a prolonged "everything" rally in the A/D Line. They rarely happened when the A/D Line was just breaking out to new highs.


What else we're looking at

  • Full returns and risk vs. reward in the S&P 500 after new highs in the A/D Line
  • A detailed look at Tesla options and ways to trade it based on implied volatility

Stat box

According to the ISE exchange, options traders bought more put options than call options on stocks on Wednesday. That's the 1st time since June 2020 they ostensibly were betting more on stocks declining than rallying.

Etcetera

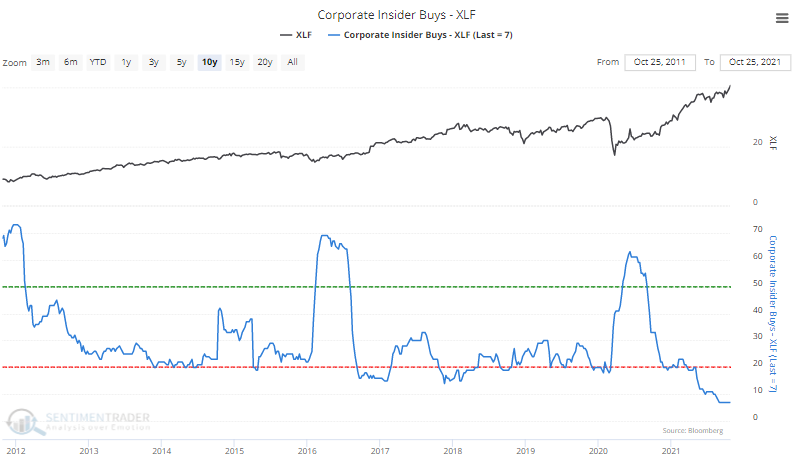
No betting on banks. Corporate insider buying transactions among financial firms have fallen to the lowest level in a decade over the past 6 months.

Corporate insider buy transactions in financial stocks has tumbled

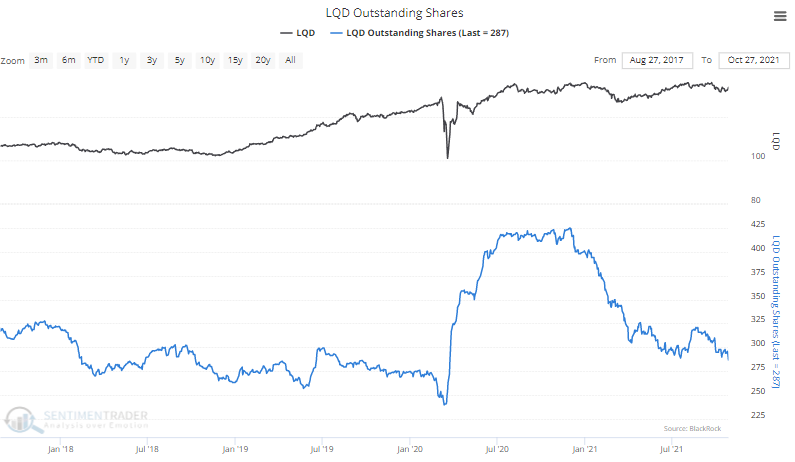
Bored with bonds. Shares outstanding in the LQD investment-grade corporate bond fund have sunk to their lowest level in over a year as investors' interests get pulled into more exciting areas of the market.

Assets in the LQD corporate bond fund have shriveled

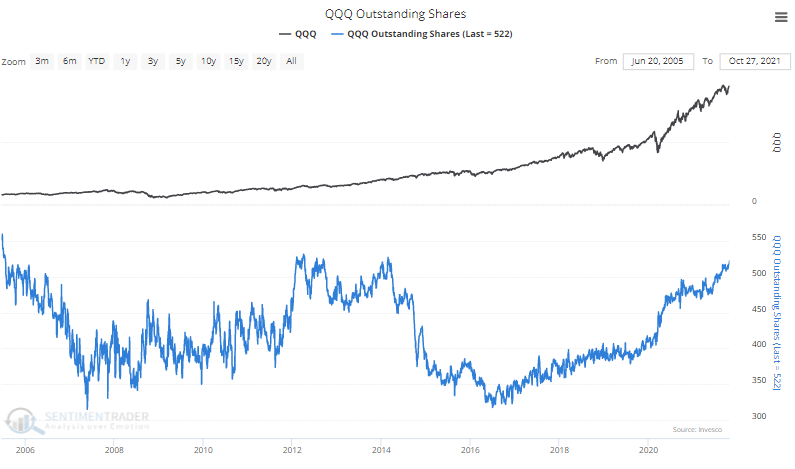
Big Tech is where it's at. After alternatives came to market several years ago, shares outstanding in the QQQ Nasdaq 100 trust shriveled. Thanks to rip-roaring performance lately, demand has skyrocketed and shares are nearing a decade-high.

QQQ shares outstanding are skyrocketing

DATA &
TECHnologies
IndicatorEdge
‍
BackTestEdge
‍
Other Tools
‍
DataEdge API
RESEARCH
reports
Research Solution
‍
Reports Library
‍
actionable
Strategies
Trading Strategies
‍
Smart Stock Scanner
‍
FREE
RESOUrCES
Simple Backtest
Calculator
Simple Seasonality
Calculator
The Kelly Criterion
Calculator
Sentiment Geo Map
‍
Public Research Reports
‍
Free Webinar
COMPANY
‍
About
‍
Meet our Team
‍
In the News
‍
Testimonials
‍
Client Success Stories
Pricing
Bundle pricing
‍
Announcements
‍
FAQ
© 2024 Sundial Capital Research Inc. All rights reserved.
Setsail Marketing
TermsPrivacyAffiliate Program
Risk Disclosure: Futures and forex trading contains substantial risk and is not for every investor. An investor could potentially lose all or more than the initial investment. Risk capital is money that can be lost without jeopardizing ones’ financial security or life style. Only risk capital should be used for trading and only those with sufficient risk capital should consider trading. Past performance is not necessarily indicative of future results.

Hypothetical Performance Disclosure: Hypothetical performance results have many inherent limitations, some of which are described below. No representation is being made that any account will or is likely to achieve profits or losses similar to those shown; in fact, there are frequently sharp differences between hypothetical performance results and the actual results subsequently achieved by any particular trading program. One of the limitations of hypothetical performance results is that they are generally prepared with the benefit of hindsight. In addition, hypothetical trading does not involve financial risk, and no hypothetical trading record can completely account for the impact of financial risk of actual trading. for example, the ability to withstand losses or to adhere to a particular trading program in spite of trading losses are material points which can also adversely affect actual trading results. There are numerous other factors related to the markets in general or to the implementation of any specific trading program which cannot be fully accounted for in the preparation of hypothetical performance results and all which can adversely affect trading results.

Testimonial Disclosure: Testimonials appearing on this website may not be representative of other clients or customers and is not a guarantee of future performance or success.