Data &
Technology
Research
Reports
Report Solutions
Reports Library
Actionable
Strategies
Free
Resources
Simple Backtest Calculator
Simple Seasonality Calculator
The Kelly Criterion Calculator
Sentiment Geo Map
Public Research Reports
Free Webinar
Pricing
Company
About
Meet Our Team
In the News
Testimonials
Client Success Stories
Contact
Log inLoginSign up
< BACK TO ALL REPORTS

This Gas Rally is Reaching Historic Proportions

Jason Goepfert
2021-09-20
Natural gas futures prices have skyrocketed lately, and the futures curve is at one of its most extreme positions in history.

It's gotten terribly expensive to power the world.

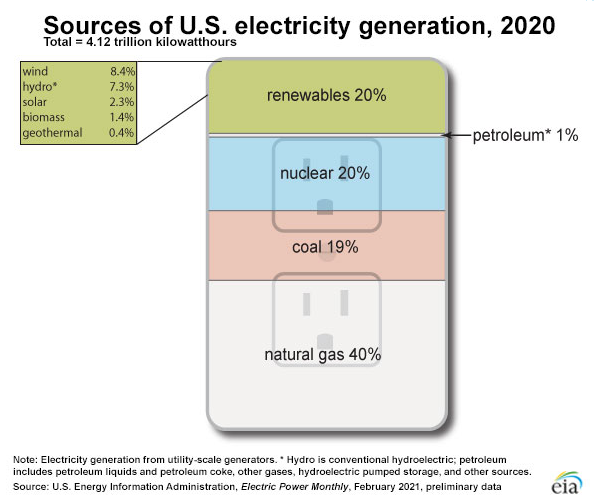
Natural gas is an increasingly important source of energy for developed markets. According to the EIA, natural gas accounted for 40% of U.S. electricity generation in 2020.

EIA natural gas as % of electricity generation

And it has gotten a whole lot pricier. Since the low in June 2020, the continuous front-month natural gas futures contract has risen by 268%, rising by over 38% in just the past month.

So, what should we expect from here if we use history to guide our future outlook for gas prices?

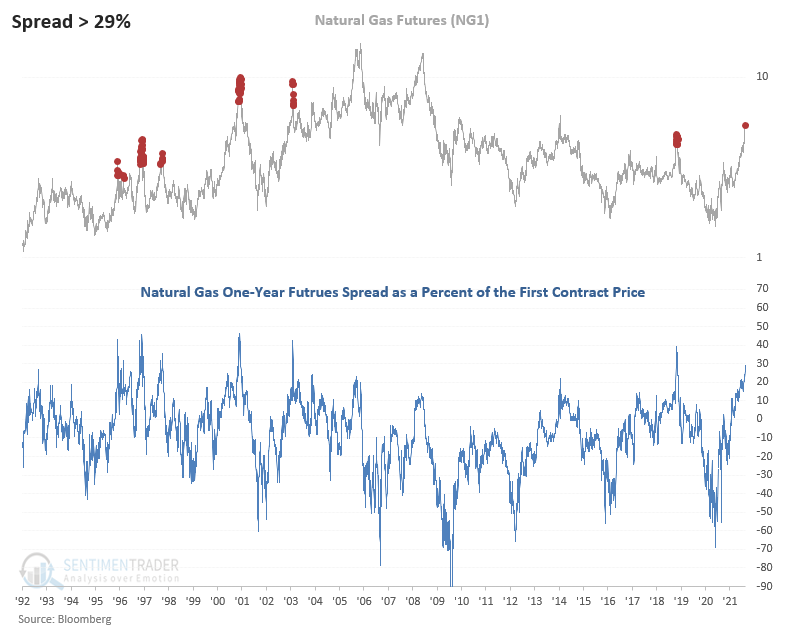
Dean noted that the natural gas one-year futures spread as a percent of the first contract price is an excellent indicator to assess a dislocation in the futures curve. Historically, a high spread identifies significant peaks in the commodity. In contrast, the commodity tends to form a substantial bottom when the spread falls to a low level.

With the spread increasing above 29% last week, it has moved to one of its most extreme positions in 30 years.

Natural gas futures curve

After the other signals, results were a coin toss in the short term with some substantial gains. Once you get past that timeframe, watch out below.

Natural gas prices tend to rise during September and October, and "smart money" commercial hedgers are still net long. Gas may quickly dissipate as that seasonal window fades, especially if hedgers turn less optimistic on the contract.


What else we're looking at

  • A deeper look at natural gas, forward returns, and its tendencies after big rallies over various time frames
  • Seasonal tendencies in retail stocks
  • Semiconductor stocks just had a historic run - what's that's meant for future returns

Stat box

It's been 219 sessions since the S&P 500 closed below its 50-day moving average on consecutive days. That's the 4th-longest streak since 1928.

Etcetera

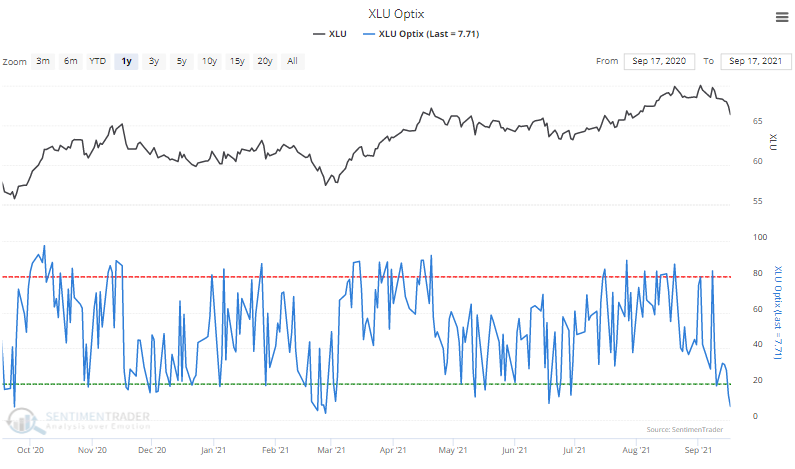
Powering down. After a stellar August, utility stocks have pulled back, and the Optimism Index for the XLU fund has plunged below 10%. It's now at one of the lowest levels of the past year.

xlu utilities sentiment optimism index

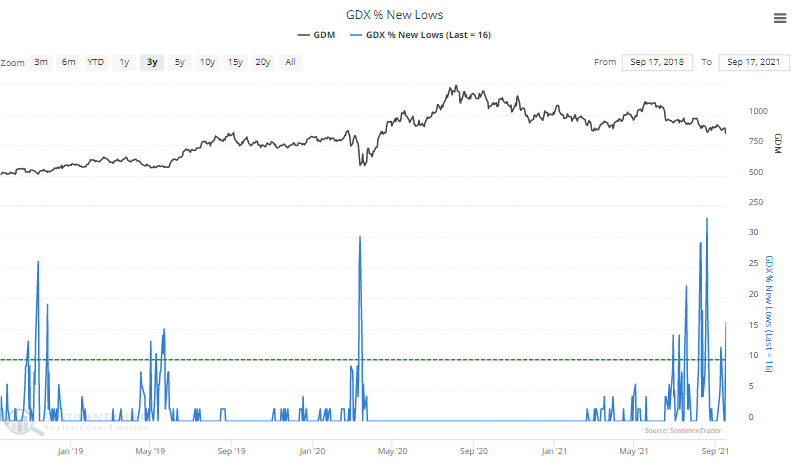
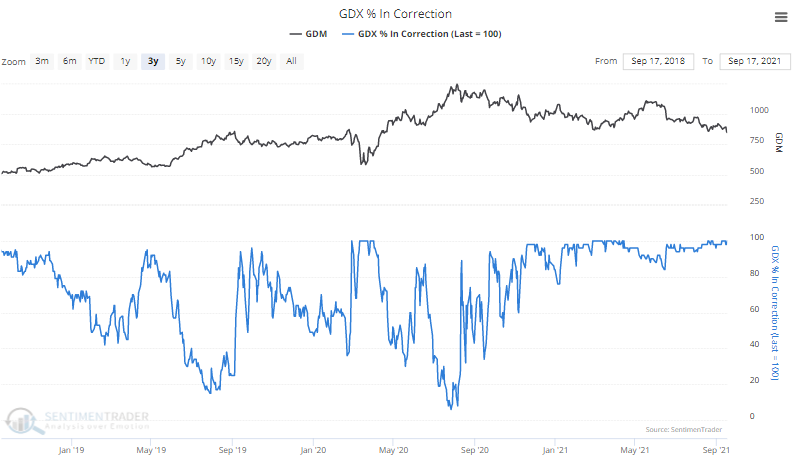
In-correct. After a brief respite during the spring, 100% of gold mining stocks are back in correction territory, trading more than 10% below their 52-week highs.

gdx gdm gold mining stocks in correction down 10%

Lotsa lows. Not only are many gold miners in correction territory, more than 15% of them have declined to 52-week lows. Other panics saw this figure jump to 30% or more. We update these figures every day for premium subscribers.

gdx gdm gold miners are 52 week low

DATA &
TECHnologies
IndicatorEdge
‍
BackTestEdge
‍
Other Tools
‍
DataEdge API
RESEARCH
reports
Research Solution
‍
Reports Library
‍
actionable
Strategies
Trading Strategies
‍
Smart Stock Scanner
‍
FREE
RESOUrCES
Simple Backtest
Calculator
Simple Seasonality
Calculator
The Kelly Criterion
Calculator
Sentiment Geo Map
‍
Public Research Reports
‍
Free Webinar
COMPANY
‍
About
‍
Meet our Team
‍
In the News
‍
Testimonials
‍
Client Success Stories
Pricing
Bundle pricing
‍
Announcements
‍
FAQ
© 2024 Sundial Capital Research Inc. All rights reserved.
Setsail Marketing
TermsPrivacyAffiliate Program
Risk Disclosure: Futures and forex trading contains substantial risk and is not for every investor. An investor could potentially lose all or more than the initial investment. Risk capital is money that can be lost without jeopardizing ones’ financial security or life style. Only risk capital should be used for trading and only those with sufficient risk capital should consider trading. Past performance is not necessarily indicative of future results.

Hypothetical Performance Disclosure: Hypothetical performance results have many inherent limitations, some of which are described below. No representation is being made that any account will or is likely to achieve profits or losses similar to those shown; in fact, there are frequently sharp differences between hypothetical performance results and the actual results subsequently achieved by any particular trading program. One of the limitations of hypothetical performance results is that they are generally prepared with the benefit of hindsight. In addition, hypothetical trading does not involve financial risk, and no hypothetical trading record can completely account for the impact of financial risk of actual trading. for example, the ability to withstand losses or to adhere to a particular trading program in spite of trading losses are material points which can also adversely affect actual trading results. There are numerous other factors related to the markets in general or to the implementation of any specific trading program which cannot be fully accounted for in the preparation of hypothetical performance results and all which can adversely affect trading results.

Testimonial Disclosure: Testimonials appearing on this website may not be representative of other clients or customers and is not a guarantee of future performance or success.