
This combination of valuation + volatility has only been seen a few other times

Investors are pushing the valuation of stocks to extreme heights, and not even having to suffer much volatility along the way. That started to change in a minor way over the last 2 sessions, so we'll have to see if it lasts.
One of the ways we've looked at a shorthand for sentiment over the years is by comparing the S&P 500's forward price/earnings multiple to the VIX "fear gauge." The higher the ratio, the more investors are getting away with pushing valuations higher without much of a consequence.
A 10-day average of the spread between those two factors just reached its highest level in a year.
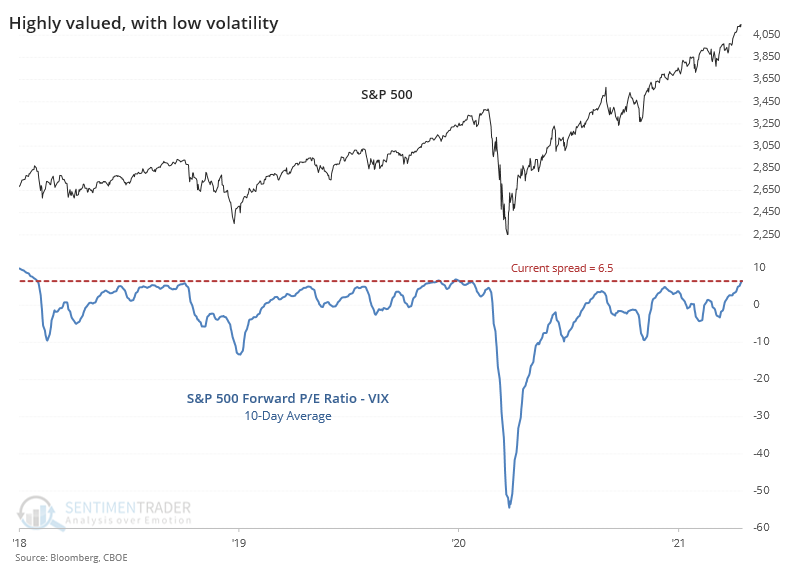
Zooming out over the past 30 years, the current spread is still among the highest readings. After other extremes, the S&P 500 itself declined every time but once, while its valuation declined every time and volatility did the opposite.
This has now been added as a premium chart for daily updates and backtesting for users.

| Stat Box With 138 securities falling to 52-week lows and only 68 rising to 52-week highs on Tuesday, so soon after the Nasdaq 100 had been at a record high, a Titanic Syndrome technical warning was signaled. This is the 1st one since last September. |
What else we're looking at
- Full history of the PE / VIX ratio
- What happened to the S&P, its valuation, and volatility after similar extremes
- An update to our Relative Ratio risk model, which appears on the cusp of a signal
- A useful long-term clue on when to switch from stocks to gold