Data &
Technology
Research
Reports
Report Solutions
Reports Library
Actionable
Strategies
Free
Resources
Simple Backtest Calculator
Simple Seasonality Calculator
The Kelly Criterion Calculator
Sentiment Geo Map
Public Research Reports
Free Webinar
Pricing
Company
About
Meet Our Team
In the News
Testimonials
Client Success Stories
Contact
Log inLoginSign up
< BACK TO ALL REPORTS

This Classic Indicator Hasn't Made a New High for 2 Months

Jason Goepfert
2021-08-17
Over the past 2 months, the S&P 500 has closed at more than 15 new highs, while the Advance/Decline Line hasn't made a single new high.

In decades past, it used to be easy to feel like we had a grasp on what breadth was doing under the major market indexes. Simply ask whether the NYSE Cumulative Advance/Decline Line was hitting new highs or not.

If it was, along with the Dow Industrials or S&P 500, then everything was kosher. If not, well, then there could be trouble.

A while back, analysts started getting more sophisticated and rolled out a version of the A/D Line that only included common stocks, believing that divergences would be more useful (they're not). In recent years, computing power has expanded and access to data is unlike any period in history, so there are a bewildering number of choices to determine what "breadth" means.

If we stick to the old school and simply look at the NYSE A/D Line, then things don't look too bad. It's hanging in there along with the major indexes. About the only potential negative is that it hasn't reached a new high for a couple of months. The S&P 500, meanwhile, has closed at a new high 18 times.

NYSE Cumulative Advance/Decline Line

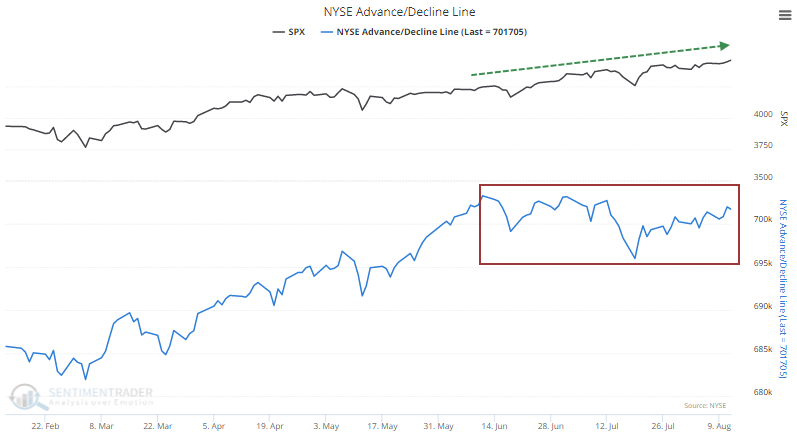
When we look at two-month windows (42 trading days) and tabulate how many 52-week highs the S&P 500 scored without any concurrent new highs in the A/D Line, this is the widest divergence in 25 years.

The last time the S&P scored so many new highs without a new high in the A/D Line was in 1995, which preceded one of the greatest runs in stock market history. It also triggered before a nice rally in 1964 (which ultimately failed). The other precedents, though, were not nearly as kind.


What else we're looking at

  • More detail on S&P 500 returns following multiple new highs without new highs in the A/D Line
  • An update on absolute and relative trends in industry, sector, and country ETFs
  • A trading system using PPI inflation data

Stat box

The S&P 500 fund, SPY, took in more than $6 billion in assets on Monday, the 3rd-largest single-day amount in the past 2 years. Our Backtest Engine shows there have been 12 days with such a big inflow during the past decade, leading to tepid (but positive) returns.

Etcetera

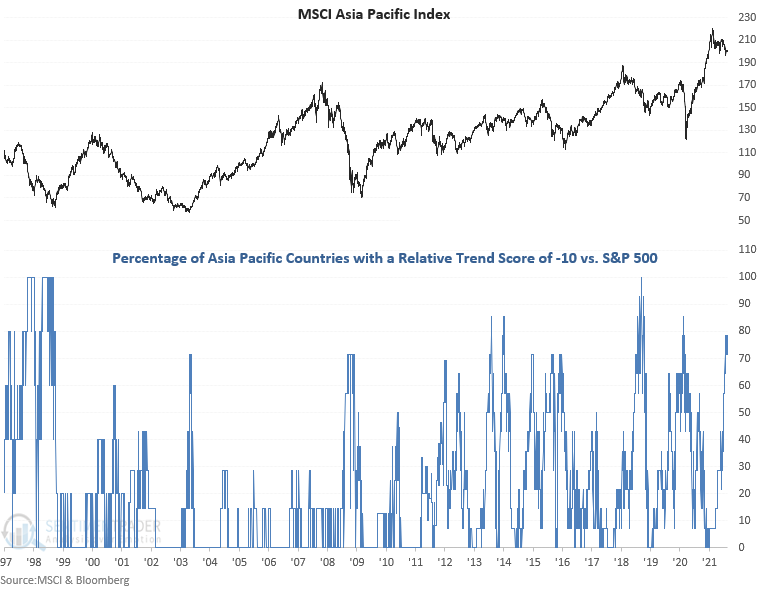
Poor trends. Dean shows that the percentage of Asia Pacific equity indexes with a maximum negative trend relative to the S&P 500 is at such a high level that it has preceded woeful forward returns for an index of those countries.

asia pacific relative trends

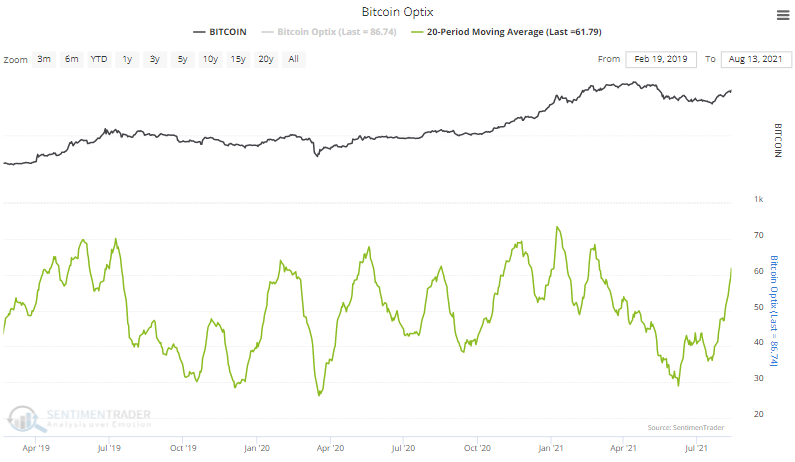
Getting there. A 20-day moving average of the Optimism Index for bitcoin is starting to approach levels that have indicated excess in recent years.

bitcoin sentiment optimism index

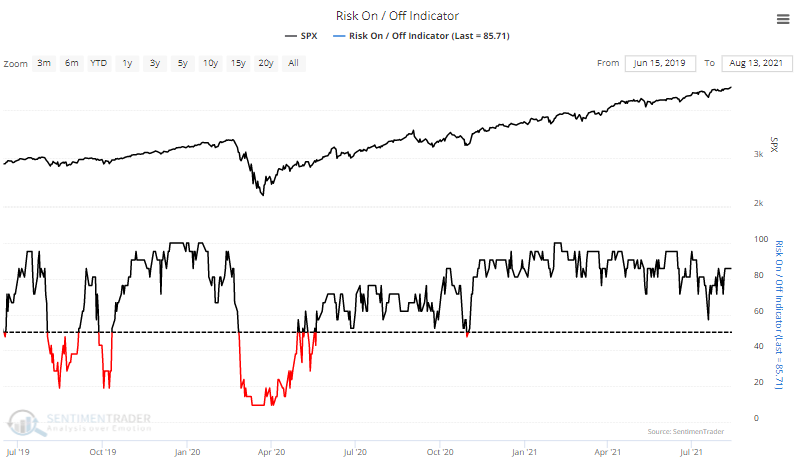
No worries. Investors have been in risk-on mode for the longest stretch of time in more than 20 years.

risk on risk off indicator

DATA &
TECHnologies
IndicatorEdge
‍
BackTestEdge
‍
Other Tools
‍
DataEdge API
RESEARCH
reports
Research Solution
‍
Reports Library
‍
actionable
Strategies
Trading Strategies
‍
Smart Stock Scanner
‍
FREE
RESOUrCES
Simple Backtest
Calculator
Simple Seasonality
Calculator
The Kelly Criterion
Calculator
Sentiment Geo Map
‍
Public Research Reports
‍
Free Webinar
COMPANY
‍
About
‍
Meet our Team
‍
In the News
‍
Testimonials
‍
Client Success Stories
Pricing
Bundle pricing
‍
Announcements
‍
FAQ
© 2024 Sundial Capital Research Inc. All rights reserved.
Setsail Marketing
TermsPrivacyAffiliate Program
Risk Disclosure: Futures and forex trading contains substantial risk and is not for every investor. An investor could potentially lose all or more than the initial investment. Risk capital is money that can be lost without jeopardizing ones’ financial security or life style. Only risk capital should be used for trading and only those with sufficient risk capital should consider trading. Past performance is not necessarily indicative of future results.

Hypothetical Performance Disclosure: Hypothetical performance results have many inherent limitations, some of which are described below. No representation is being made that any account will or is likely to achieve profits or losses similar to those shown; in fact, there are frequently sharp differences between hypothetical performance results and the actual results subsequently achieved by any particular trading program. One of the limitations of hypothetical performance results is that they are generally prepared with the benefit of hindsight. In addition, hypothetical trading does not involve financial risk, and no hypothetical trading record can completely account for the impact of financial risk of actual trading. for example, the ability to withstand losses or to adhere to a particular trading program in spite of trading losses are material points which can also adversely affect actual trading results. There are numerous other factors related to the markets in general or to the implementation of any specific trading program which cannot be fully accounted for in the preparation of hypothetical performance results and all which can adversely affect trading results.

Testimonial Disclosure: Testimonials appearing on this website may not be representative of other clients or customers and is not a guarantee of future performance or success.