Data &
Technology
Research
Reports
Report Solutions
Reports Library
Actionable
Strategies
Free
Resources
Simple Backtest Calculator
Simple Seasonality Calculator
The Kelly Criterion Calculator
Sentiment Geo Map
Public Research Reports
Free Webinar
Pricing
Company
About
Meet Our Team
In the News
Testimonials
Client Success Stories
Contact
Log inLoginSign up
< BACK TO ALL REPORTS

This calendar quirk hasn't lost in 80 years

Jason Goepfert
2021-02-09
The last four days of a month have had a consistently positive bias over the years.

Jay has taken a deep dive into quirks with the calendar, with the primary goal simply to help investors find an edge in the markets by highlighting information that hides in plain sight.

One of those is the last 4 trading days of a calendar month in the S&P 500. 

Interestingly - and as you can see in the chart below - the two losing 10-year rolling periods for the "last 4 days" strategy were the first two measured. Since then, the last 79 consecutive 10-year periods have witnessed an overall gain for the S&P 500 Index during the last 4 days. 

S&P 500 performance during the last 4 days of a month

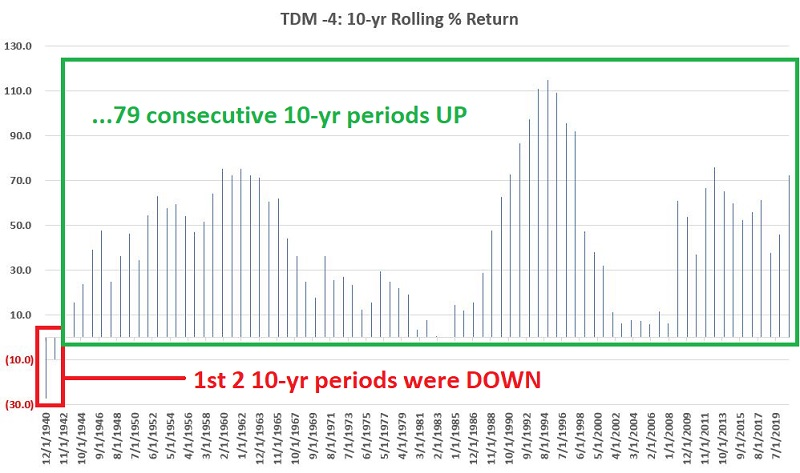
The key thing to note is that buying and holding only during the last 4 days of a month registered a 10-year rolling gain 98% of the time. 

What else we're looking at

  • Full details of the "last 4 days" strategy
  • Trends in gold miners have plunged lately...but it's following a big rally
  • What happens when fewer than 65% of gold mining stocks have a rising 200-day moving average
  • Fewer than 10% of miner are above their 50-day averages
  • ETF traders are fleeing gold-related funds
  • Social Sentiment shows that Twitter users are negative on junior gold miners
  • Our Optimism Index on gold is nearing the baseline for bull markets
  • What happens when "smart money" hedgers are heavily net short gold
  • A miss of > 50k on the Nonfarm Payroll report has some interesting tendencies across sectors and markets
  • What happens after a gap up following a big rally

Stat Box

For the 6th time in its history, the Nasdaq 100 has doubled from a 1-year low. After touching its nadir in March 2020, the index has traded at a price more than twice as great as its low price back then.


Sentiment from other perspectives

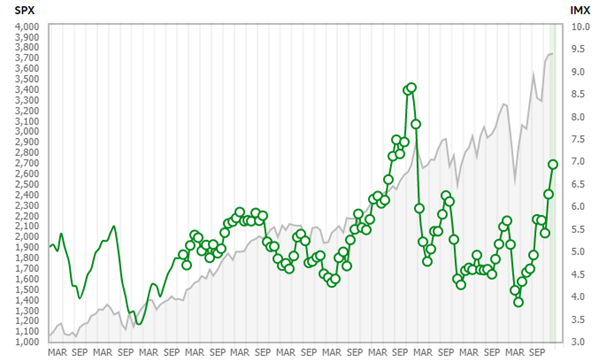
Investors are confident. Exposure to equity markets increased for the second month in a row. During the January period, the IMX increased 10.4%, or 0.65, to 6.91. Source: TD Ameritrade

td ameritrade activity index

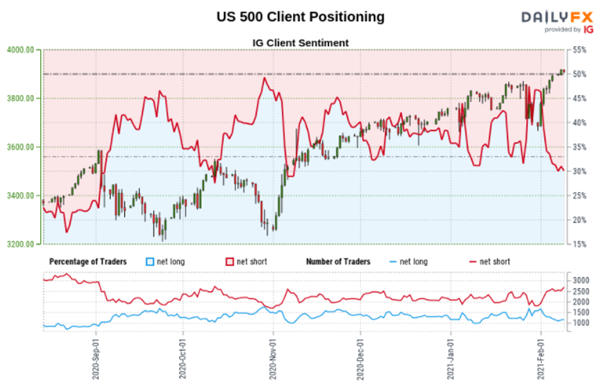
Some futures traders aren't buying in. Clients at one brokerage are the least net long stocks in the S&P 500 in months. This has been more of a smart money type of gauge, with low net long positions mostly preceding future weakness in stocks. Source: DailyFX

dailyfx s&p 500 positioning

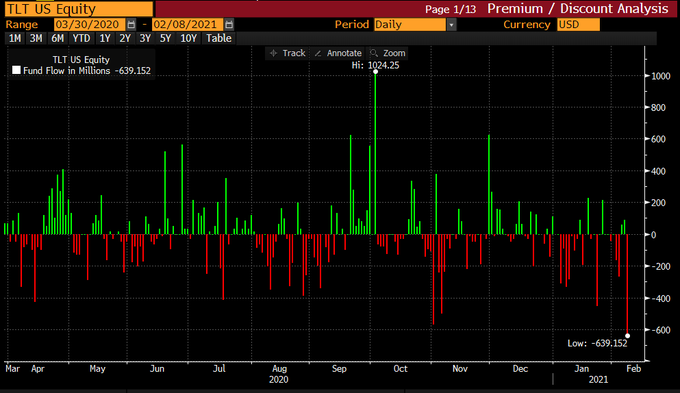
What are investors NOT buying? Bonds! The widely traded TLT fund suffered its worst one-day outflow in almost a year as traders bailed on medium-term Treasuries. Source: Lisa Abramowicz

tlt fund flow

DATA &
TECHnologies
IndicatorEdge
‍
BackTestEdge
‍
Other Tools
‍
DataEdge API
RESEARCH
reports
Research Solution
‍
Reports Library
‍
actionable
Strategies
Trading Strategies
‍
Smart Stock Scanner
‍
FREE
RESOUrCES
Simple Backtest
Calculator
Simple Seasonality
Calculator
The Kelly Criterion
Calculator
Sentiment Geo Map
‍
Public Research Reports
‍
Free Webinar
COMPANY
‍
About
‍
Meet our Team
‍
In the News
‍
Testimonials
‍
Client Success Stories
Pricing
Bundle pricing
‍
Announcements
‍
FAQ
© 2024 Sundial Capital Research Inc. All rights reserved.
Setsail Marketing
TermsPrivacyAffiliate Program
Risk Disclosure: Futures and forex trading contains substantial risk and is not for every investor. An investor could potentially lose all or more than the initial investment. Risk capital is money that can be lost without jeopardizing ones’ financial security or life style. Only risk capital should be used for trading and only those with sufficient risk capital should consider trading. Past performance is not necessarily indicative of future results.

Hypothetical Performance Disclosure: Hypothetical performance results have many inherent limitations, some of which are described below. No representation is being made that any account will or is likely to achieve profits or losses similar to those shown; in fact, there are frequently sharp differences between hypothetical performance results and the actual results subsequently achieved by any particular trading program. One of the limitations of hypothetical performance results is that they are generally prepared with the benefit of hindsight. In addition, hypothetical trading does not involve financial risk, and no hypothetical trading record can completely account for the impact of financial risk of actual trading. for example, the ability to withstand losses or to adhere to a particular trading program in spite of trading losses are material points which can also adversely affect actual trading results. There are numerous other factors related to the markets in general or to the implementation of any specific trading program which cannot be fully accounted for in the preparation of hypothetical performance results and all which can adversely affect trading results.

Testimonial Disclosure: Testimonials appearing on this website may not be representative of other clients or customers and is not a guarantee of future performance or success.