This bull market is just like...

Key points:
- If a new bull market started in October 2022, the first 95 days of it showed a high correlation to 15 others
- Those bull markets tended to persist for months afterward, with high consistency and low drawdowns
- Lower-correlated bull markets showed more volatility with higher drawdowns
The highest-correlated bull markets in history
Last week, we reached the 95th day of the new bull market, making the large assumption that it is, indeed, a bull market. Whenever a rally (or decline) lasts a while, a popular topic revolves around the idea, "Hey, this one is just like..."
Analogs - comparing current price action over x number of days to a similar number of days from another time period - are a popular pastime and mostly useless. It's too easy to get suckered into cherry-picked examples. We've found them helpful in the past only when using an objective, rigorous methodology.
If we assume that October 12, 2022, was the birth of a new bull market, then by last week, the rally had lasted 95 trading days. We can use bull and bear market dates defined by Ned Davis Research to compare the price path during this stretch against all other nascent bull markets since 1928. By doing that, we can look at the highest- and lowest-correlated bull markets to see where the current one fits in and what the future returns looked like after similar behavior.
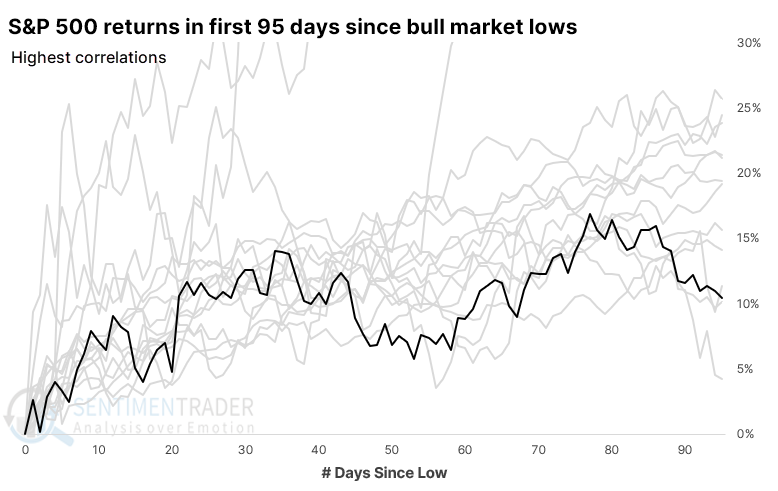
The chart below shows the current bull market in black versus the 15 highest-correlated ones dating back to 1928.

A few gigantic winners, mainly from the 1930s, skew the chart. Below, we see the same precedents but with the vertical scale cut off at 30%. By doing that, we can see how closely the current bull market stacks up against similar bull markets.
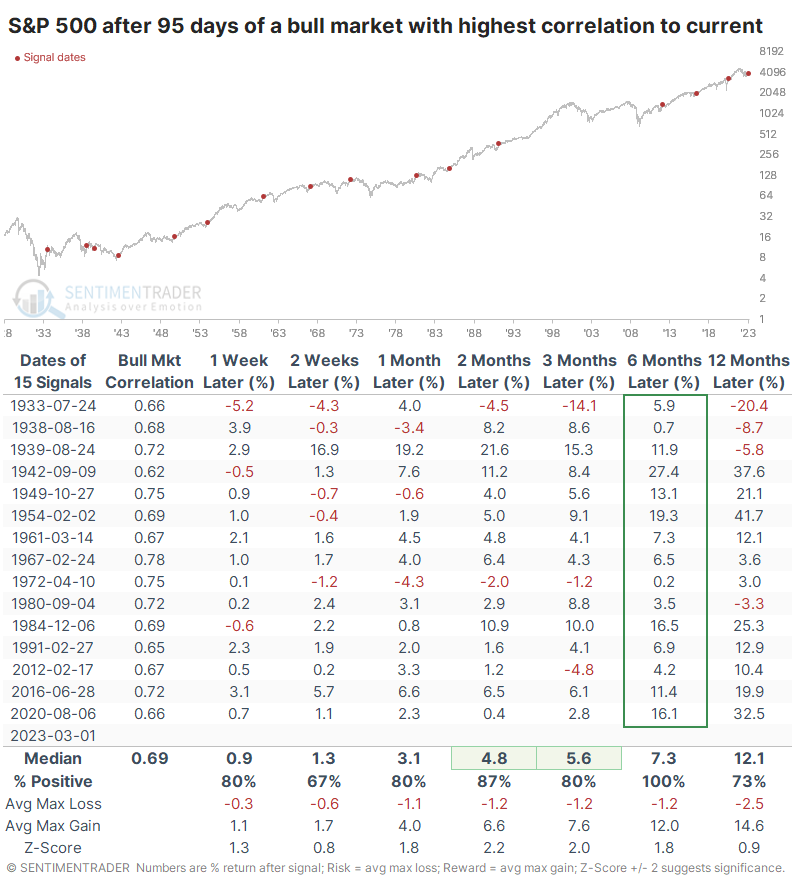
What's most important is what it meant for future returns. The table below shows S&P returns after the first 95 days of the most highly-correlated bull markets. Those returns were good, especially over the next six months, with all positive returns.
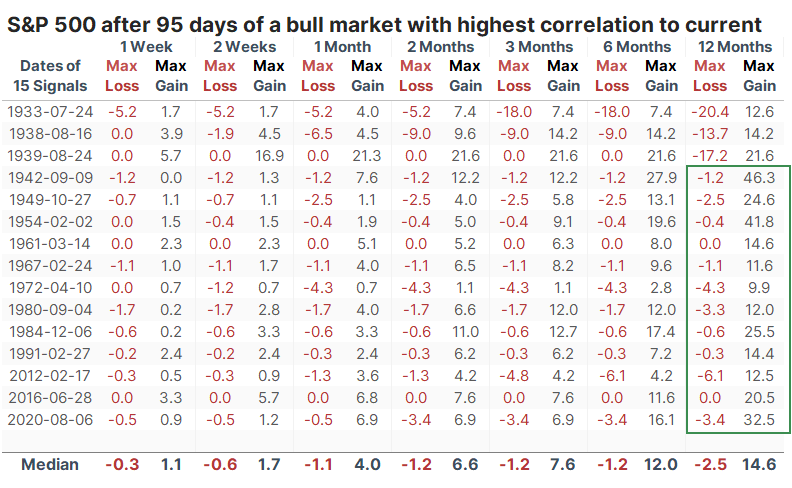
The ratio of maximum gains to maximum losses was especially impressive. Even over the next year, the maximum loss tended to be very small, particularly if we excluded the 1930s. After the 1930s, there was no drawdown of more than -6.1% at any point within the following year.
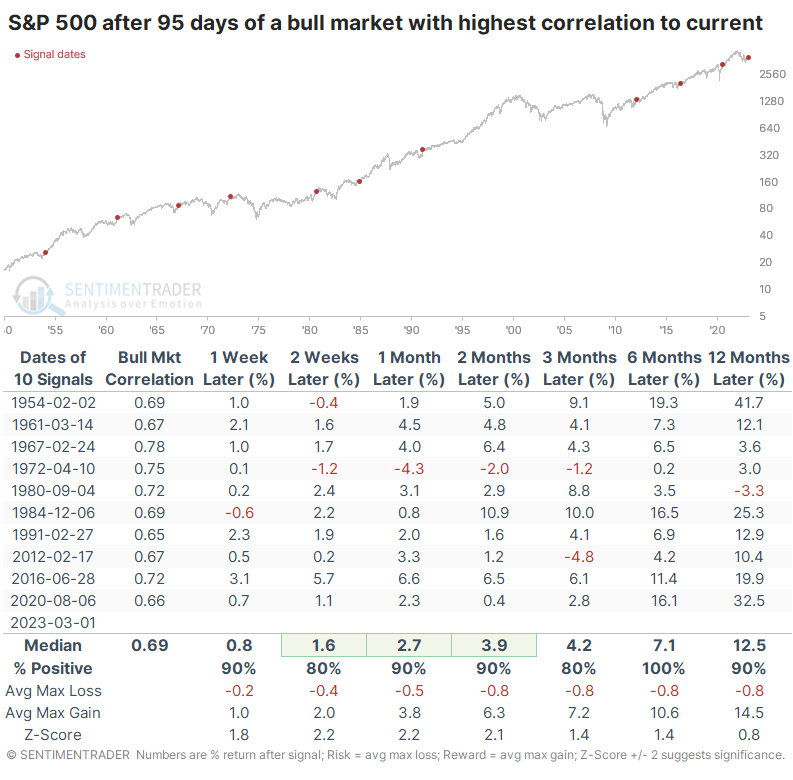
If we filter the table to focus on modern markets since 1950, then returns were pristine. Any losses across any time frame were minimal.
The least-correlated bull markets
As usual, it can be helpful to look at the counter-examples. The chart below shows the current bull market superimposed against the 15 bull markets that had the lowest correlation to the current one.
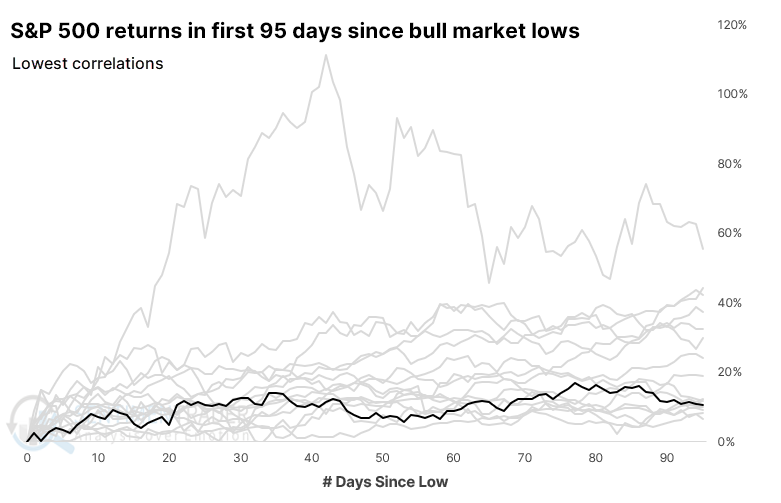
It's hard to tell much from that chart, so the one below zooms in on the vertical scale and cuts it off at 40%. It shows just how chaotic many of those bull markets were.
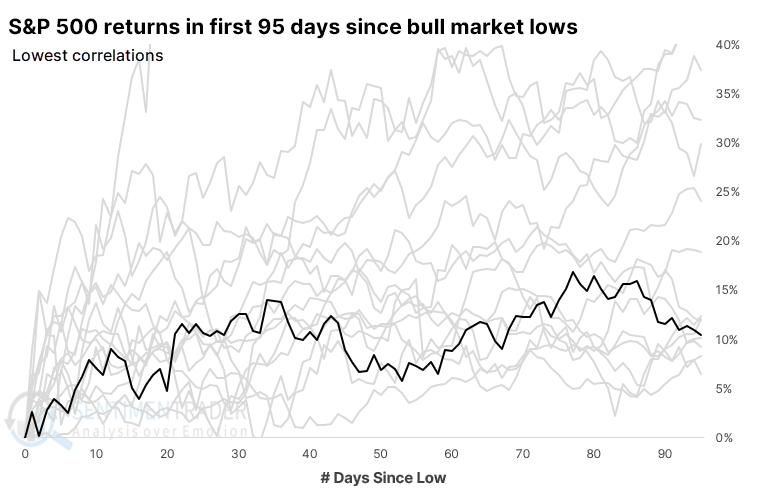
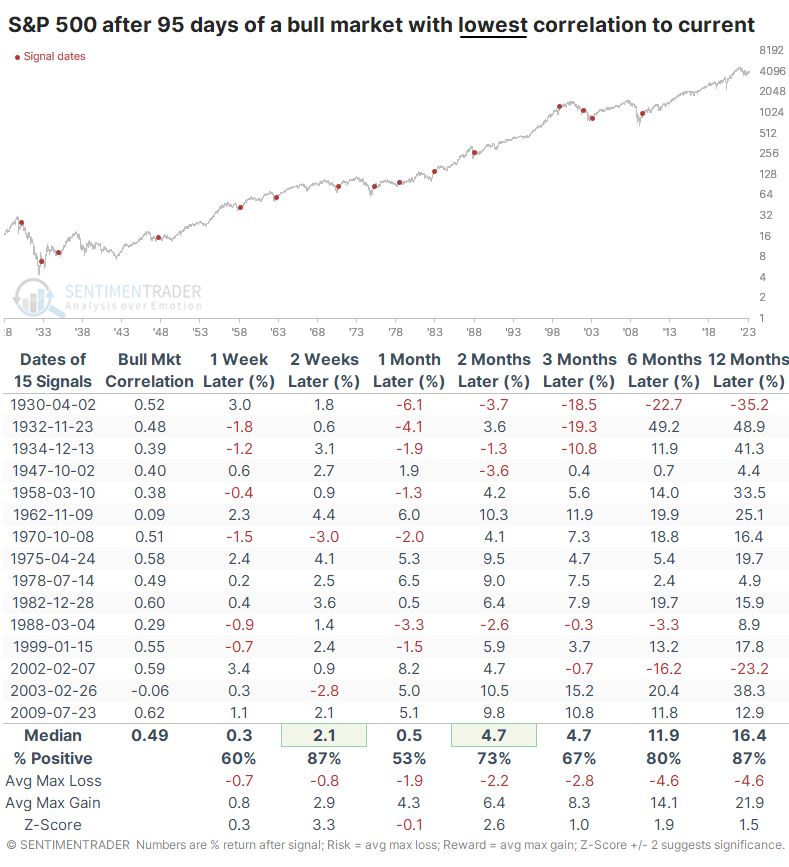
Because these were the beginnings of new bull markets, future returns were mostly positive, almost by definition. But overall, they were less consistently positive, incurred the most significant losses, and suffered more risk than the highest-correlated bull markets.
What the research tells us...
Suppose a new bull market started last October. In that case, it has progressed in line with many of the more sustained bull markets in history, particularly since the 1950s. The first 95 trading days of the bull market (if that's what this is) have a high correlation to the first 95 days of bull markets that showed a strong tendency to persist, with low drawdowns, at least over the next year. While a couple of those ultimately failed, the initial move off the low was compelling enough for buyers to continue to raise their bids for months afterward.

