Products
SentimenTrader Trading Tools
‍
Backtest Engine
My Trading Toolkit
Correlation Analysis
Seasonality
Market Prediction
Indicators & Data API
‍
Proprietary Indicators & Charts
Market Data API
Strategies & Scanner
‍
50+ Trading Strategies
Smart Stock Scanner
Smart Option Scanner
Research Reports
‍
Research Solutions
Reports Library
Free Resources
Simple Backtest Calculator
Simple Seasonality Calculator
The Kelly Criterion Calculator
Sentiment Geo Map
Public Research Reports
Education
Sentiment Indicators
Technical Indicators
Pricing
Company
About
In the News
Testimonials
Client Success Stories
Contact
Log inLoginSign up
< BACK TO ALL REPORTS

This breadth signal suggests a pause

Dean Christians
2021-11-22
Stock participation has lost momentum, suggesting a short-term consolidation.

Key points:

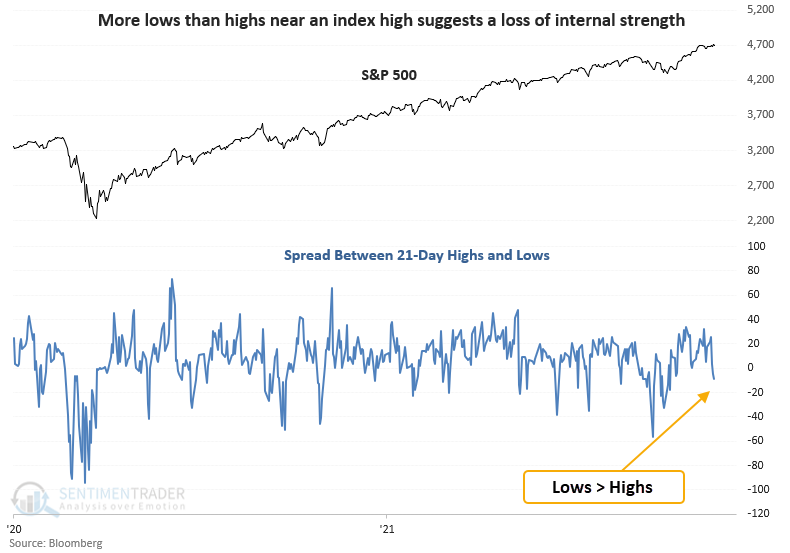
  • New lows are greater than new highs, with the S&P 500 near a high
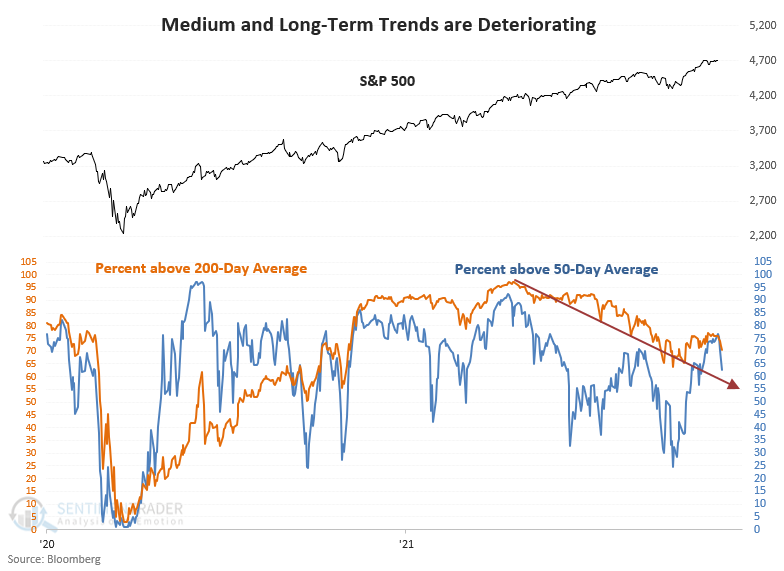
  • Medium and long-term stock trends are deteriorating
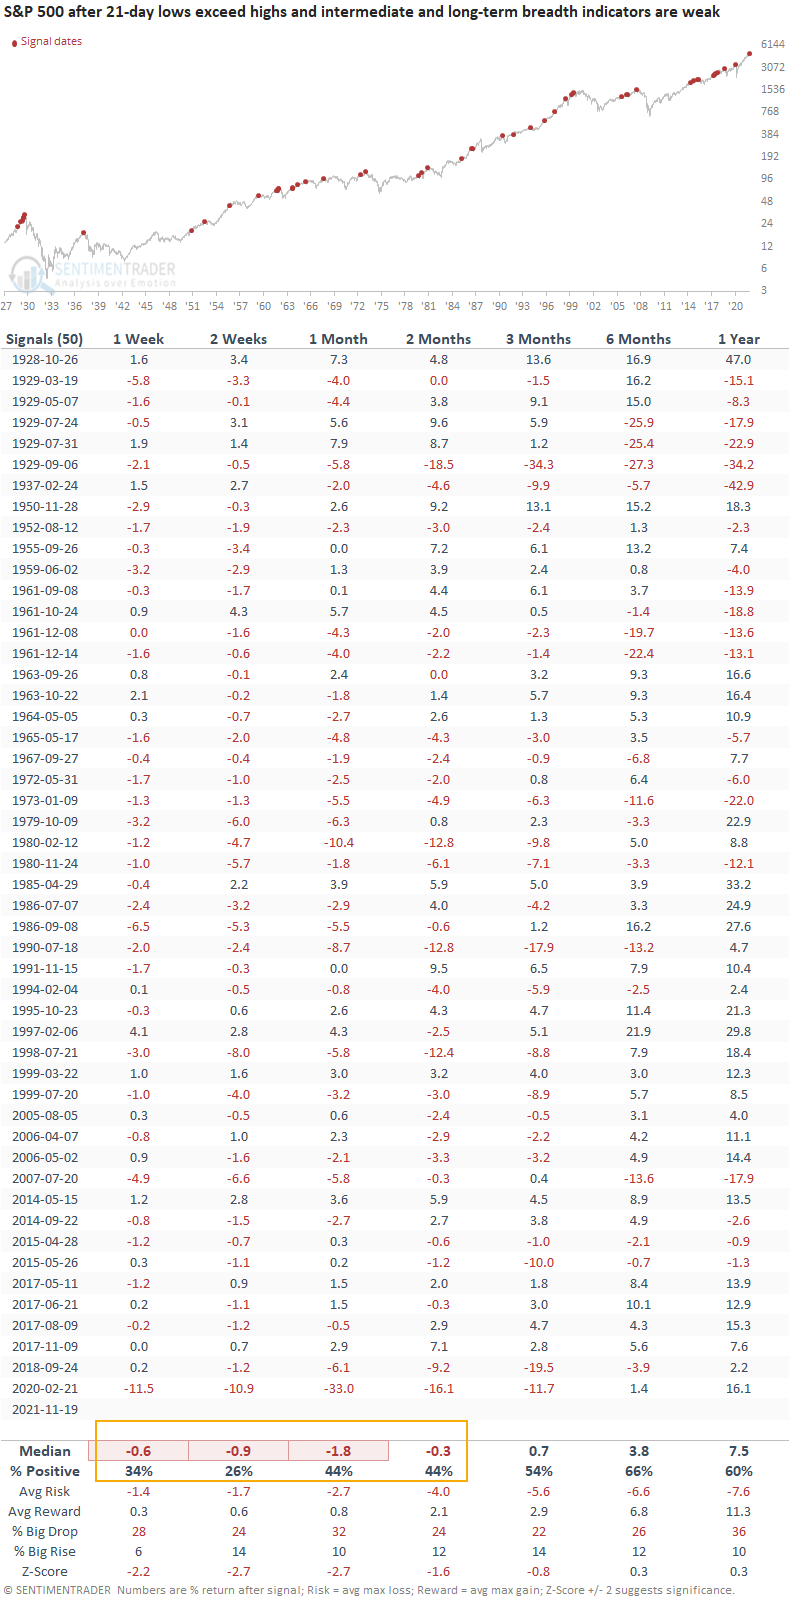
  • Similar conditions preceded negative returns in the near term

Several breadth indicators suggest the market is losing internal momentum

A new signal from a voting member in the composite risk-off model issued an alert on Friday. The component is called the New High Low Spread with Weak 50 & 200-day Average model. 

If you were wondering, the model requires the following criteria to issue an alert.

  1. S&P 500 <= 2 days from a 252-day high
  2. The spread between S&P 500 21-day highs and lows are < -0.5%
  3. The percentage of S&P 500 members above the 50-day average < 66%
  4. The percentage of S&P 500 members above the 200-day average < 75%

The spread between the percentage of members at a 21-day high versus low turned decidedly negative on Friday, two days removed from an all-time high.

Medium and long-term stock participation trends have been trending lower for the last 6 months.

Similar signals preceded weak returns in the near term

This signal has triggered 50 other times over the past 93 years. After the others, future returns and win rates were weak in the short term with several unfavorable risk/reward profiles. 

What the research tells us...

When 21-day lows exceed highs, and the percentage of members above the 50 & 200-day average are weak, stock participation is losing momentum. Similar setups to what we're seeing now have preceded weak returns and win rates in the short term. However, as we've seen all year, the unhealthy breadth conditions have generally been more indicative of rolling internal sector corrections associated with the latest Covid case count. When case counts start to rise, money flows out of cyclical sectors and moves to the perceived safety of a few mega-cap technology stocks.

PRODUCTS
SentimenTrader
Trading Tools
Indicators & Data API
‍
Strategies & Scanner
‍
Research Reports
FREE
RESOUrCES
Simple Backtest
Calculator
Simple Seasonality
Calculator
The Kelly Criterion
Calculator
Sentiment Geo Map
‍
Public Research Reports
‍
Education
Sentiment Indicators
‍
Technical Indicators
‍
Pricing
Bundle pricing
‍
FAQ
‍
Announcements
‍
COMPANY
‍
About
‍
In the News
‍
Testimonials
‍
Client Success Stories
CONTACT
‍
General Inquiries
‍
Media Inquiries
‍
Financial Professionals Inquiries
‍
© 2026 Sundial Capital Research Inc. All rights reserved.
Setsail Marketing
TermsPrivacyAffiliate Program
Risk Disclosure: The information and tools provided are for research and analytical purposes only and are not intended as investment advice. Market analysis involves uncertainty, and outcomes may differ from expectations. Users should conduct their own due diligence and consider their individual circumstances before making any financial decisions. Past performance is not necessarily indicative of future results.

Hypothetical Performance Disclosure: Hypothetical performance results have many inherent limitations, some of which are described below. No representation is being made that any account will or is likely to achieve profits or losses similar to those shown; in fact, there are frequently sharp differences between hypothetical performance results and the actual results subsequently achieved by any particular trading program. One of the limitations of hypothetical performance results is that they are generally prepared with the benefit of hindsight. In addition, hypothetical trading does not involve financial risk, and no hypothetical trading record can completely account for the impact of financial risk of actual trading. for example, the ability to withstand losses or to adhere to a particular trading program in spite of trading losses are material points which can also adversely affect actual trading results. There are numerous other factors related to the markets in general or to the implementation of any specific trading program which cannot be fully accounted for in the preparation of hypothetical performance results and all which can adversely affect trading results.

Testimonial Disclosure: Testimonials appearing on this website may not be representative of other clients or customers and is not a guarantee of future performance or success.