
This breadth signal can help you prepare for a bear market

Everyone wants to find a way to prepare for a bear market and devastating losses. I'll show you a simple method, with the exact rules, to do just that.
Over decades as a Wall Street trader and researcher, I've created and tested countless risk-off models that seek to identify the early stages of a bullish to bearish trend reversal for the stock market. My research concluded that market breadth is one of the best tools for identifying trend changes in advance of price action alone.
Breadth-based indicators offer an inside look at the participation of individual components within an index that provides valuable information. This look beneath the surface allows us to quantify a basket of securities underlying strength or weakness.
"Markets are strongest when broad and weakest when they narrow to a handful of issues." - Bob Ferrell
I'll now share how I use the percentage of members above the 50-day moving average to identify a trend change that often foreshadows bear market or correction periods.
THE CONCEPT
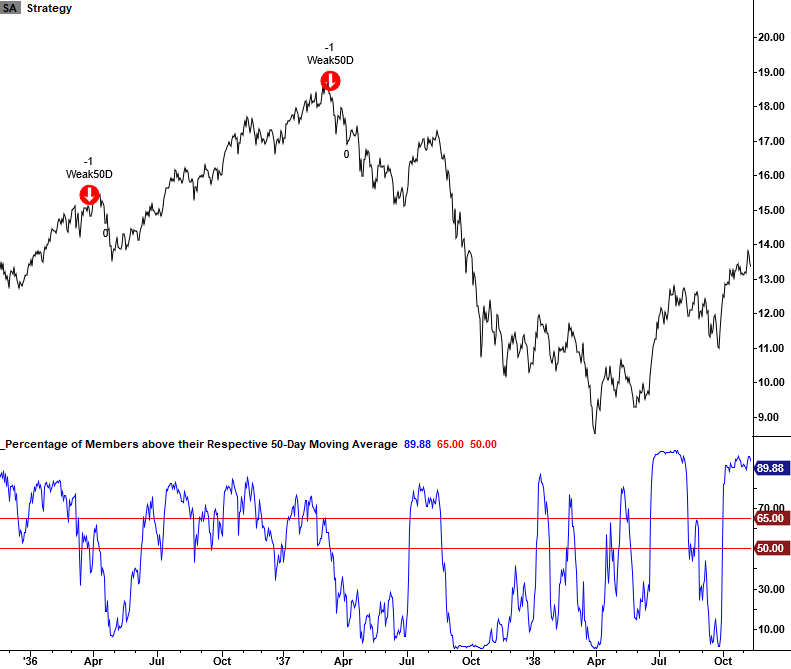
The percentage of members above the 50-Day moving average risk-off model identifies instances when a low number of Index members are trading above their respective 50-day average as the Index itself hovers near a high. The model will issue two separate alerts based upon the following conditions.
CONDITIONS FOR 1ST BREADTH SIGNAL
- Percentage of S&P 500 members <= 65%
- S&P 500 Index <= 0.25% from 252-Day High
- If Condition 1 & 2, start a days since true count
- If days since true count <= ten days and the percentage of S&P 500 members crosses below 50%, signal risk-off
- If percentage of members crosses above 66%, reset condition = true
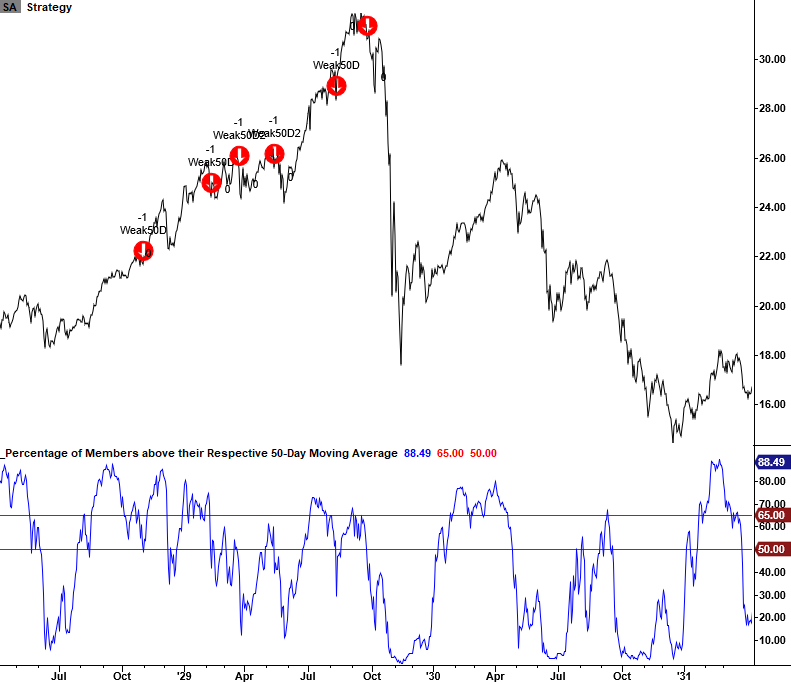
CONDITIONS FOR 2ND BREADTH SIGNAL
- Percentage of S&P 500 members <= 54.5%
- S&P 500 Index <= 0.25% from 252-day high
- If Condition 1 & 2, start a days since true count
- If days since true count <= ten days and the S&P 500 5-day rate of change is -1% or more, signal risk-off
- If percentage of members crosses above 63%, reset condition = true
Let's take a look at some charts and the historical signal performance.
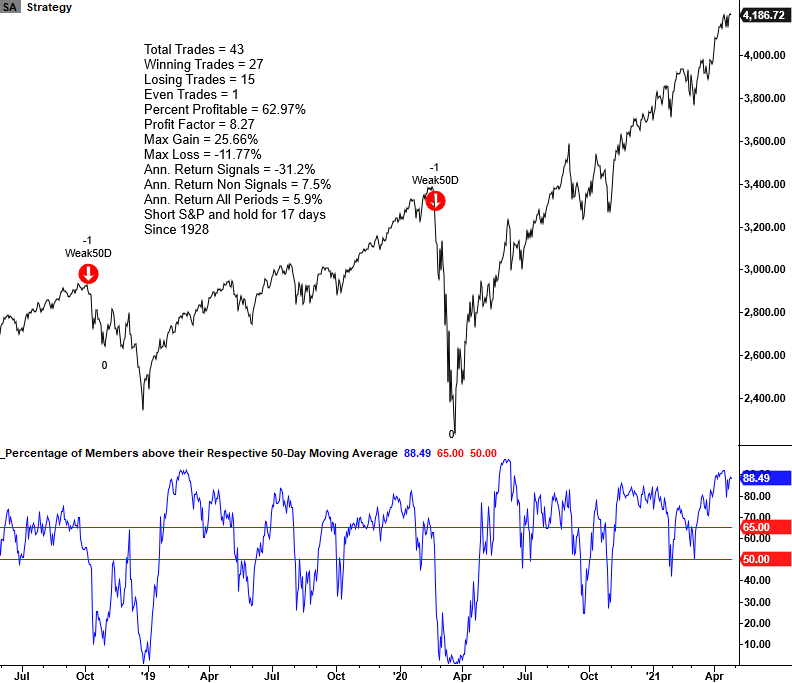
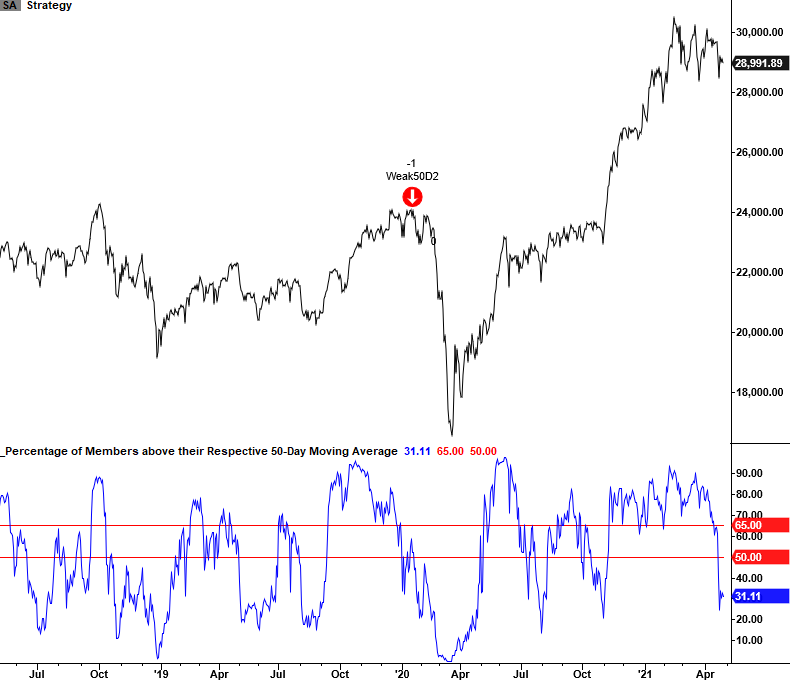
CURRENT CHART
I calculate performance statistics in the chart as a short signal, whereas annualized returns result from buying the S&P 500. Through the spring of 2021, this signal successfully shorted the S&P 63% of the time when holding for 17 trading days.
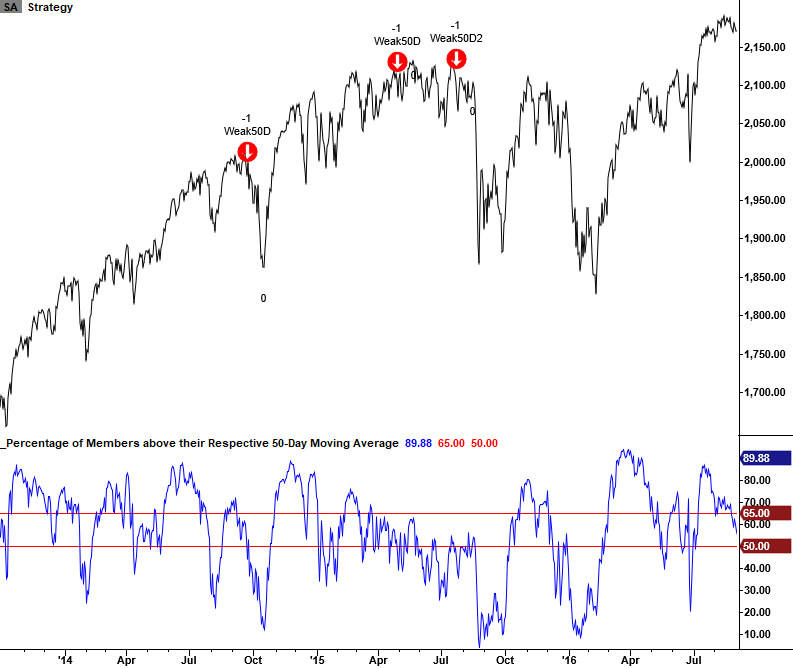
2015-2016 OIL/COMMODITY BEAR MARKET
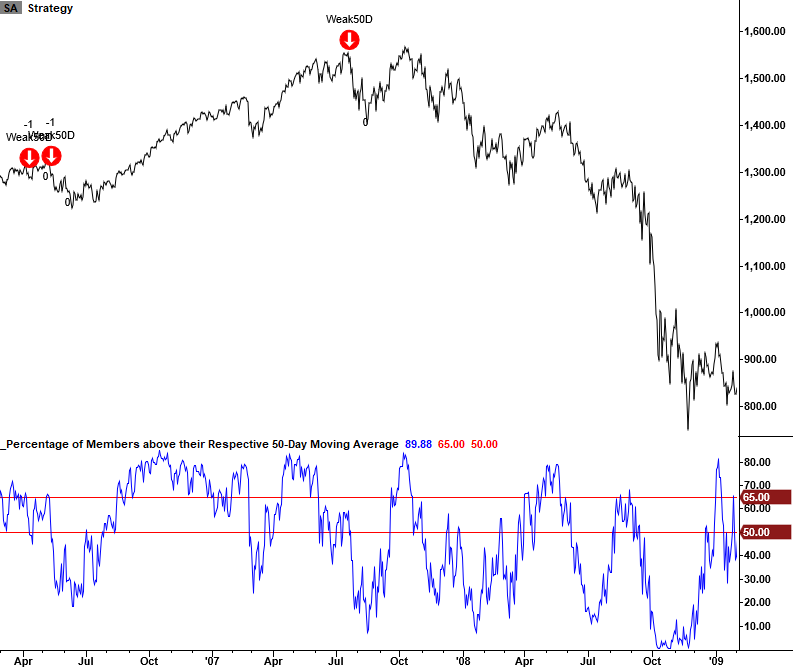
2007-08 FINANCIAL CRISIS
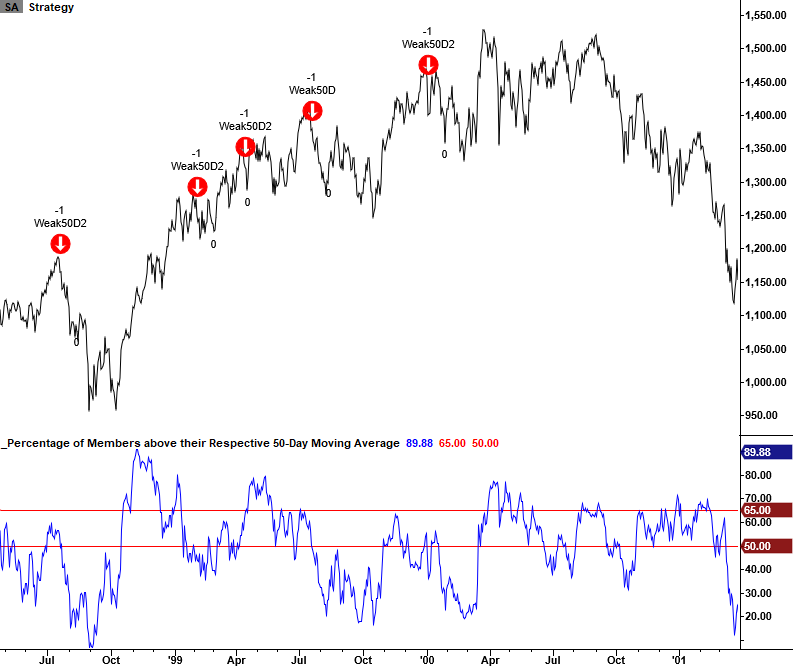
1998 LTCM and 2000 INTERNET BUBBLE
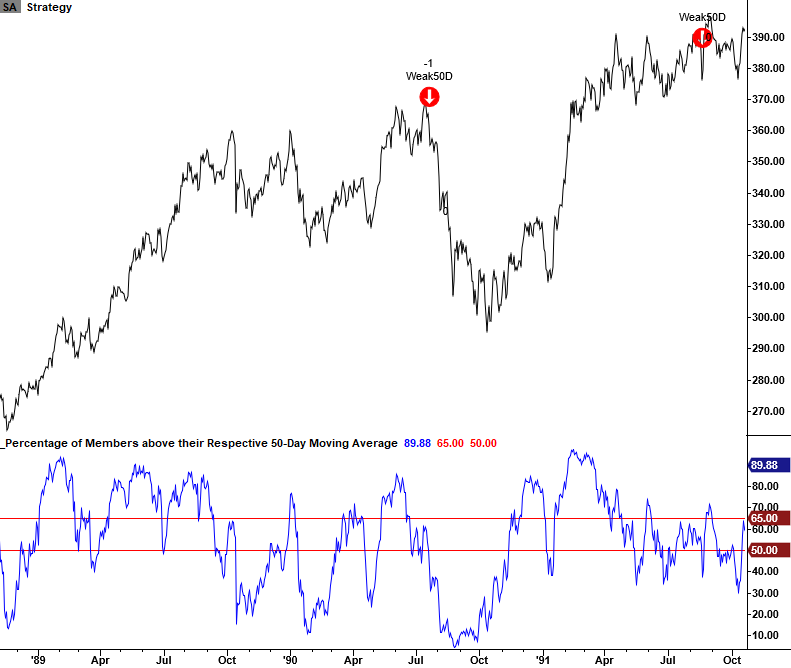
1990 SAVINGS & LOAN - IRAQ OIL SPIKE
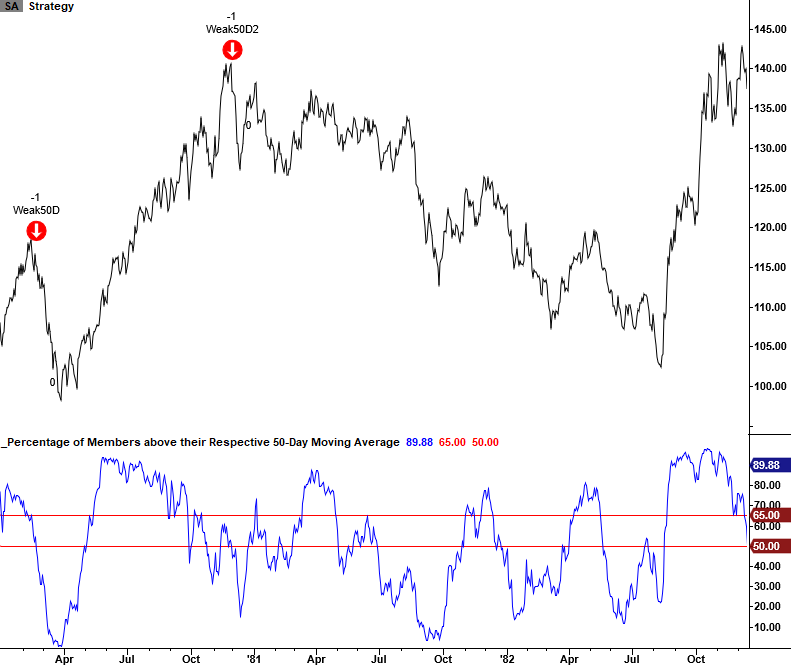
1980 OIL/COMMODITY BUBBLE
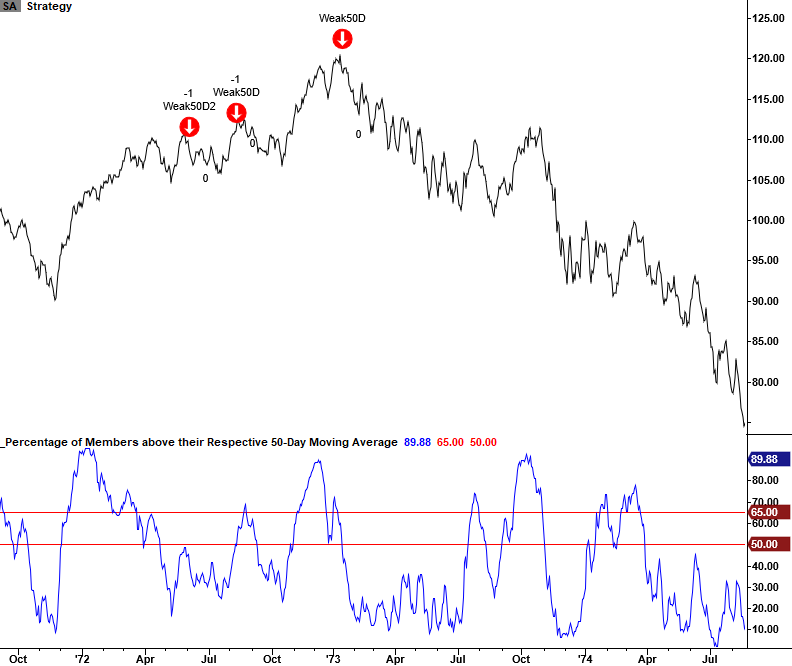
1973-74 BRETTON WOODS - NIXON SHOCK - OIL EMBARGO
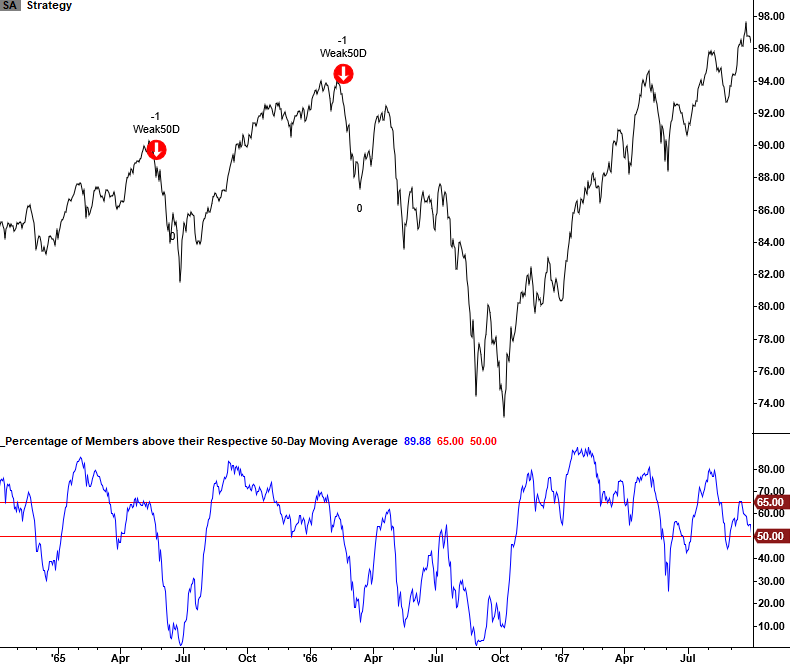
1966 VIETNAM WAR - FED TIGHTENING
1937-38 RECESSION
1929-32 GREAT DEPRESSION
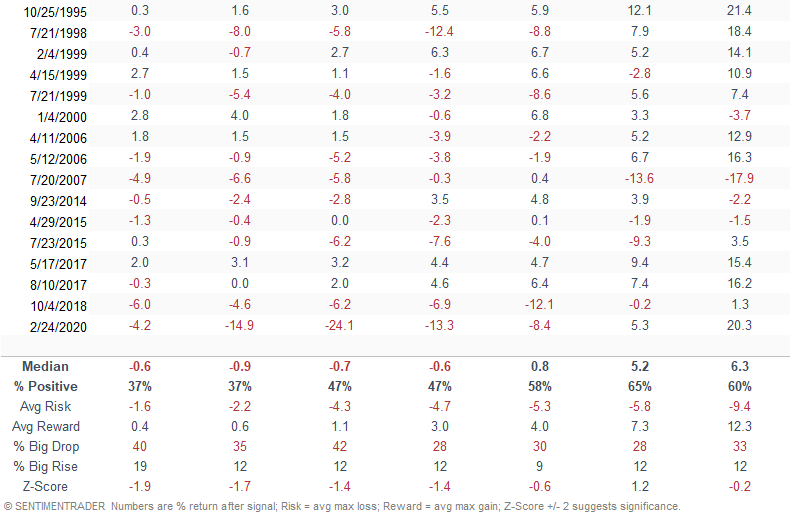
HOW THE SIGNALS PERFORMED
The table below shows every signal since 1928. Performance was weak over the next 1-8 weeks, with several z-scores approaching significance.
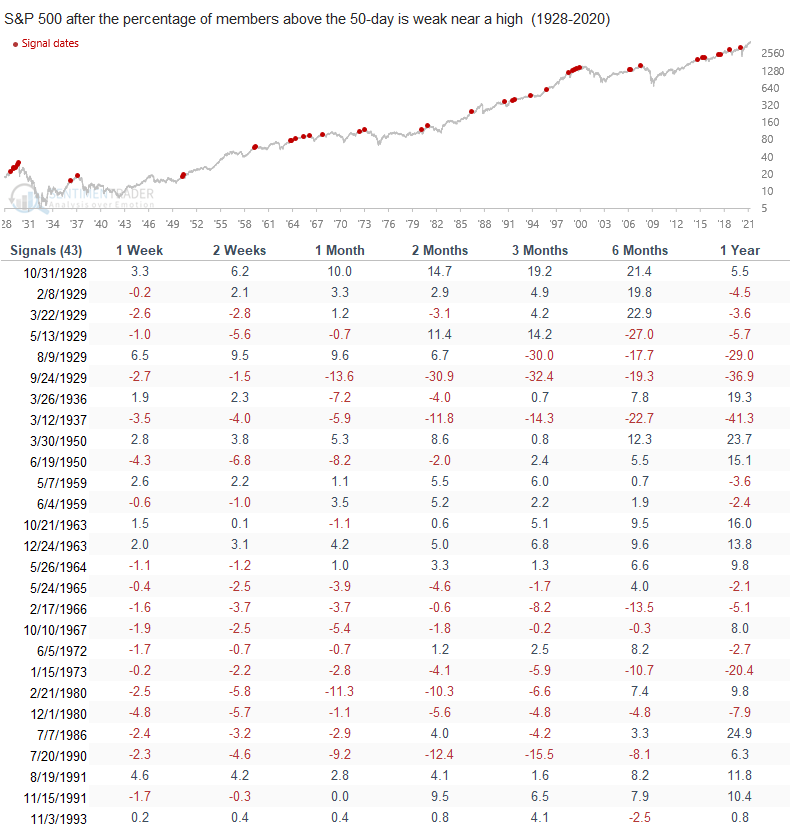
The model utilizes a days-in-trade (DIT) and indicator stop level for exits. The failsafe level for the S&P 500 model is 69.5%, and it has only triggered four times in history. In other words, the DIT exit occurs in most instances as the indicator does not improve to a level that would trigger the stop.
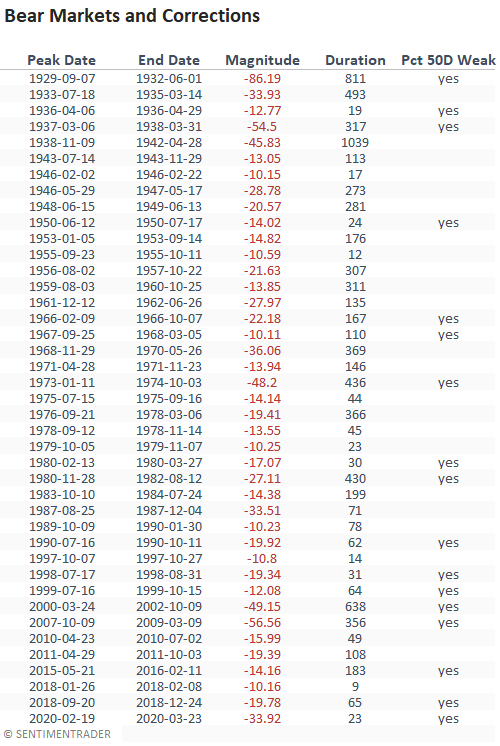
IDENTIFYING PREVIOUS BEAR MARKETS
The following table provides a historical signal perspective for the percentage of members above the 50-day average risk-off signal. A "yes" in the last column indicates that a signal triggered either before or just after a significant correction or bear market peak.
The risk-off signal triggered in 8 out of 14 bear market instances since 1929. By utilizing this method, an investor could have avoided over half of bear markets.
INTERNATIONAL SIGNALS
One of the great things about the market breadth risk-off signal is that the concept works on other indexes, including overseas.
JAPAN - NIKKEI 225 INDEX
CANADA - S&P/TORONTO STOCK EXCHANGE
WHERE TO FIND OUT MORE
We all want to avoid losing money during a prolonged bear market.
As we just saw, using the percentage of members above the 50-day average has triggered ahead of several major market peaks. It wasn't perfect (nothing is) but it's a simple system, with readily available data, and triggered before most major declines, especially in recent decades.
I would always use the signal in conjunction with other risk-off models as a weight-of-the-evidence approach provides a more favorable outcome when managing market exposure.
If you would like to follow this signal or learn more about how we use breadth-based indicators to assess market conditions, please visit www.sentimentrader.com for more information. With a database that starts in 1927 and contains over 300 times series, we can provide a historical perspective on market breadth unmatched by most other research services.