Data &
Technology
Research
Reports
Report Solutions
Reports Library
Actionable
Strategies
Free
Resources
Simple Backtest Calculator
Simple Seasonality Calculator
The Kelly Criterion Calculator
Sentiment Geo Map
Public Research Reports
Free Webinar
Pricing
Company
About
Meet Our Team
In the News
Testimonials
Client Success Stories
Contact
Log inLoginSign up
< BACK TO ALL REPORTS

These 2 Measures Show Almost Unmatched Momentum

Jason Goepfert
2021-08-10
The S&P 500 has gone 189 days without a 5% pullback and has recorded more than 43 days with a 52-week high.

This year has behaved like few in market history.

Last month, we showed that through the first half of the year, 2021 has been one of the most consistent and persistent rallies ever. It's done nothing but continue.

Through late last week, the S&P 500 had gone 189 days - nine consecutive months - without being more than 5% from a 52-week high. And it recorded its 43rd day with a 52-week closing high.

189 days without a pullback and 43 new highs S&P 500

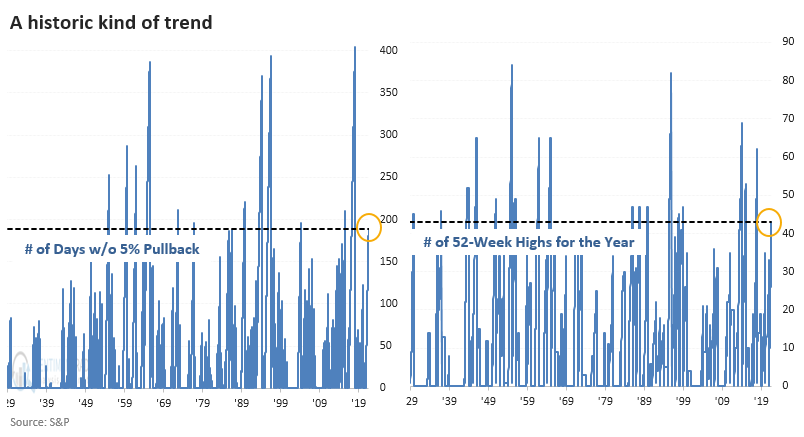
Looking at them separately, after other times the S&P managed to go 189 sessions without being more than 5% from its high, it suffered some poor short-term returns. We've seen this kind of result with many other momentum studies so far this year, and yet here we are sitting at an all-time high, so there's that.

The S&P has also scored 43 days which closed at a 52-week high before November. Again, not a lot of consistency among forward returns after similar setups.

When we combine the two studies, this year has only a handful of precedents. Shorter-term returns were tepid, but the next few months were good, except for 1989 as we headed into the 1990 recession.


What else we're looking at

  • Full returns following 189 days without a pullback, 43 days with a new high, and both conditions at the same time
  • A look at how long the precedents went before suffering a pullback
  • An update on absolute and relative trends in industry, sector, and country ETFs
  • What it takes to succeed as a counter-trend trader
  • A detailed look at the opportunity in natural gas and a way to express it through an options trade

Stat box

Nearly 28% of stocks in the French CAC40 index are overbought, the most since last December. Over the past 3 years, readings this high preceded an average return in the index of -0.2% over the next two weeks.

Etcetera

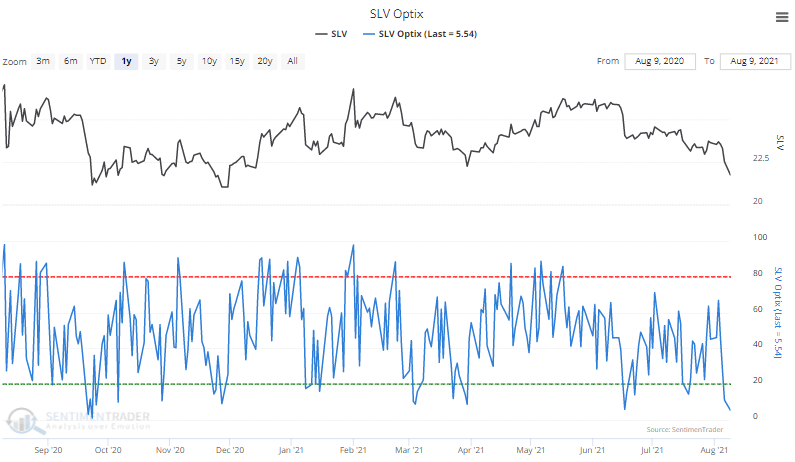
Silver shudden. The Optimism Index (Optix) for the SLV silver fund fell below 6%, the 2nd-lowest reading in the past year. Previous major selloffs tended to end when the 5-day average Optix curled up from below 20%. 

slv silver optimism sentiment

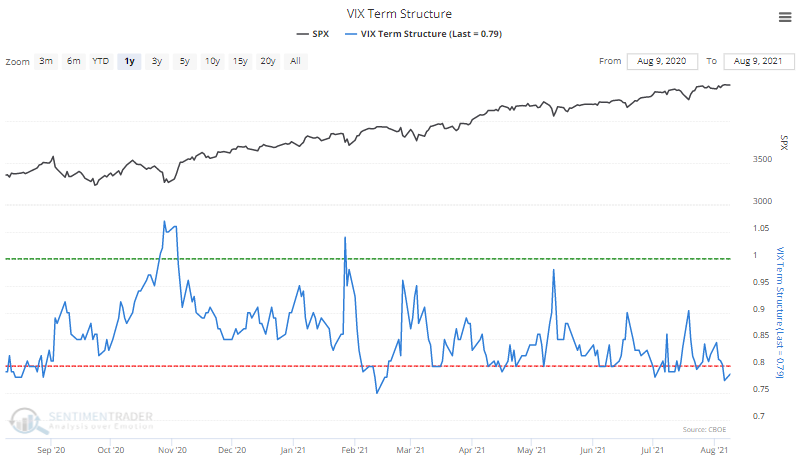
What, me worry? Alfred E. Neuman would be right at home trading VIX "fear gauge" options. The futures curve shows that traders are pricing in little worry of an imminent pullback in stocks relative to potential volatility later in the year.

vix term structure

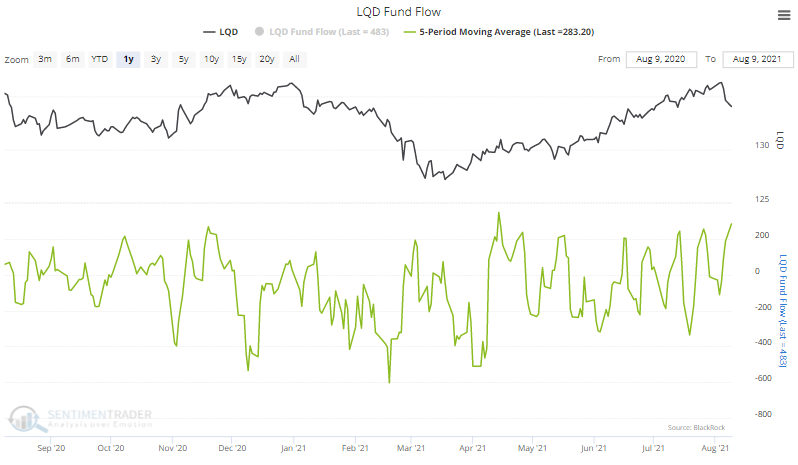
Corporate confidence. Traders have poured more than $280 million per day into the LQD corporate bond fund over the past week, the 2nd-highest amount of the past year.

lqd bond flow

DATA &
TECHnologies
IndicatorEdge
‍
BackTestEdge
‍
Other Tools
‍
DataEdge API
RESEARCH
reports
Research Solution
‍
Reports Library
‍
actionable
Strategies
Trading Strategies
‍
Smart Stock Scanner
‍
FREE
RESOUrCES
Simple Backtest
Calculator
Simple Seasonality
Calculator
The Kelly Criterion
Calculator
Sentiment Geo Map
‍
Public Research Reports
‍
Free Webinar
COMPANY
‍
About
‍
Meet our Team
‍
In the News
‍
Testimonials
‍
Client Success Stories
Pricing
Bundle pricing
‍
Announcements
‍
FAQ
© 2024 Sundial Capital Research Inc. All rights reserved.
Setsail Marketing
TermsPrivacyAffiliate Program
Risk Disclosure: Futures and forex trading contains substantial risk and is not for every investor. An investor could potentially lose all or more than the initial investment. Risk capital is money that can be lost without jeopardizing ones’ financial security or life style. Only risk capital should be used for trading and only those with sufficient risk capital should consider trading. Past performance is not necessarily indicative of future results.

Hypothetical Performance Disclosure: Hypothetical performance results have many inherent limitations, some of which are described below. No representation is being made that any account will or is likely to achieve profits or losses similar to those shown; in fact, there are frequently sharp differences between hypothetical performance results and the actual results subsequently achieved by any particular trading program. One of the limitations of hypothetical performance results is that they are generally prepared with the benefit of hindsight. In addition, hypothetical trading does not involve financial risk, and no hypothetical trading record can completely account for the impact of financial risk of actual trading. for example, the ability to withstand losses or to adhere to a particular trading program in spite of trading losses are material points which can also adversely affect actual trading results. There are numerous other factors related to the markets in general or to the implementation of any specific trading program which cannot be fully accounted for in the preparation of hypothetical performance results and all which can adversely affect trading results.

Testimonial Disclosure: Testimonials appearing on this website may not be representative of other clients or customers and is not a guarantee of future performance or success.