Data &
Technology
Research
Reports
Report Solutions
Reports Library
Actionable
Strategies
Free
Resources
Simple Backtest Calculator
Simple Seasonality Calculator
The Kelly Criterion Calculator
Sentiment Geo Map
Public Research Reports
Free Webinar
Pricing
Company
About
Meet Our Team
In the News
Testimonials
Client Success Stories
Contact
Log inLoginSign up
< BACK TO ALL REPORTS

There has been a breakout in breakouts

Jason Goepfert
2021-01-11
Last week saw a big breakout in stocks hitting 52-week highs, especially in small-cap stocks that make up the Russell 2000.

This week has been one for the record books, in a number of different ways. Most spectacularly, the surge in small-cap stocks that pushed the Russell 2000 to its best-ever gain while hitting a new high.

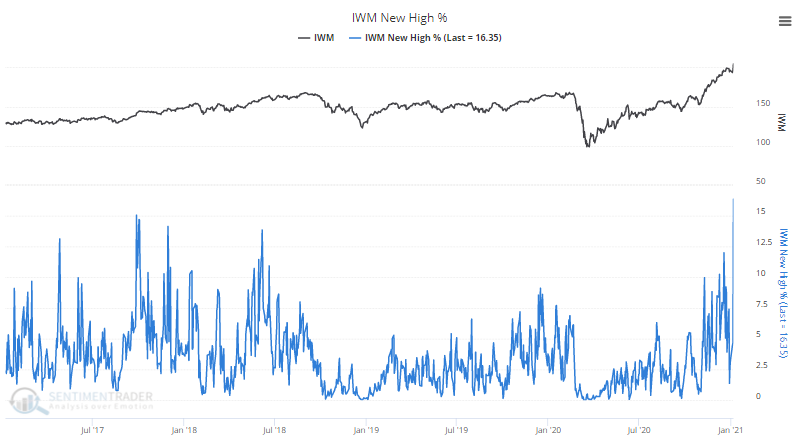
The record-breaking rally in that index didn't occur in isolation, of course - the index rallied because many stocks within the index did. And enough of them rallied well enough to tickle 52-week highs. More than 15% of stocks within the Russell managed to score a fresh high on Wednesday, the most since 2016.

Small cap Russell 2000 members at 52 week high

There was a jump in other metrics that track the underlying health and momentum of small-caps. If we create a composite breadth indicator out of them all, then Wednesday's reading was the highest in several years. When this composite first jumped above 50, small-cap stocks tended to take a 1-2 week breather (except for the last 2 instances), but over the next year, the Russell 2000 showed a positive return every time.


What else is happening

These are topics we explored in our most recent research. For immediate access with no obligation, sign up for a 30-day free trial now.

  • Returns in the Russell 2000 and S&P 500 after composite breadth thrusts
  • What happens when there is a multi-year breakout in the percentage of securities at new highs
  • Looking at the makeup of sectors dominating the new high list
  • All industries and sectors have rising 200-day moving averages...and most stocks do, too
  • What Thursday's odd readings mean for forward returns
  • Looking at a comprehensive overall market breadth composite and what it says about the recent high in the S&P 500
  • Introducing a "Fed thrust" indicator
  • Is this a trend change in the U.S. dollar?
  • Looking at other huge 3-day drops in gold
  • What stocks have done when Nonfarm Payroll reports miss estimates

Stat Box

As of last week, "smart money" commercial hedgers were net short 28% of the open interest in corn futures, the most in 25 years. The only period where they were close to being this short was in May 2011.

Sentiment from other perspectives

We don't necessarily agree with everything posted here - some of our work might directly contradict it - but it's often worth knowing what others are watching.

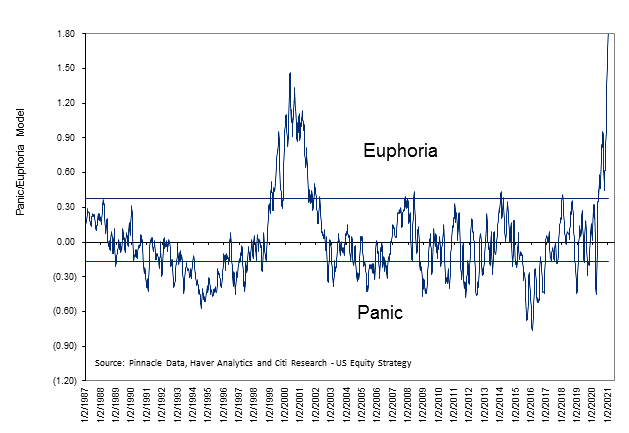
1. Well, this is kind of insane. The picture says it all. [Citi]

citi panic euphoria

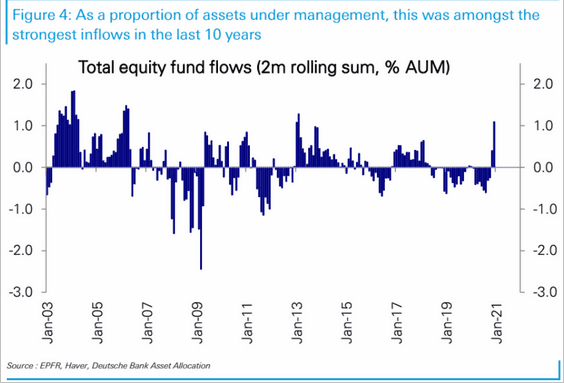
2. All that euphoria has helped trigger a move back into equity funds, with the largest 2-month inflow (as a percentage of total assets) in 7 years. [Deutche Bank via Daily Shot]

equity fund flows

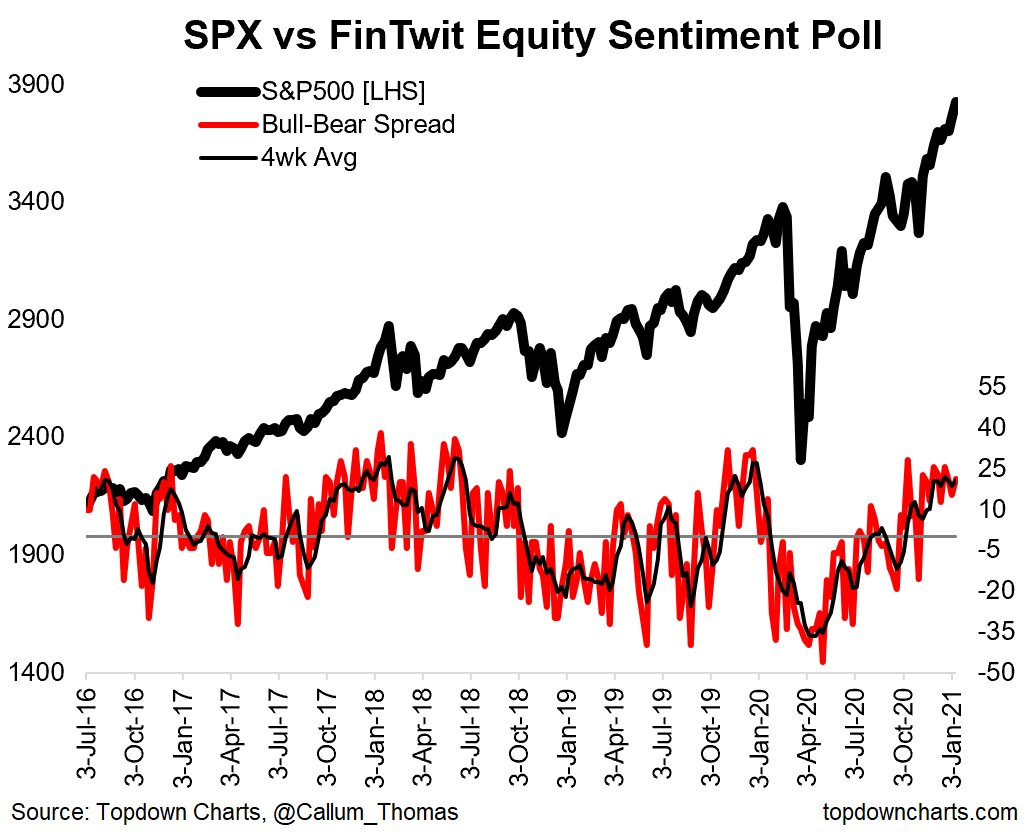
3. What do you do when you expect stocks to rise? Tell people about it, of course! Bullish sentiment among Twitter users is getting high. [Callum Thomas, Topdown Charts]

twitter stock sentiment

DATA &
TECHnologies
IndicatorEdge
‍
BackTestEdge
‍
Other Tools
‍
DataEdge API
RESEARCH
reports
Research Solution
‍
Reports Library
‍
actionable
Strategies
Trading Strategies
‍
Smart Stock Scanner
‍
FREE
RESOUrCES
Simple Backtest
Calculator
Simple Seasonality
Calculator
The Kelly Criterion
Calculator
Sentiment Geo Map
‍
Public Research Reports
‍
Free Webinar
COMPANY
‍
About
‍
Meet our Team
‍
In the News
‍
Testimonials
‍
Client Success Stories
Pricing
Bundle pricing
‍
Announcements
‍
FAQ
© 2024 Sundial Capital Research Inc. All rights reserved.
Setsail Marketing
TermsPrivacyAffiliate Program
Risk Disclosure: Futures and forex trading contains substantial risk and is not for every investor. An investor could potentially lose all or more than the initial investment. Risk capital is money that can be lost without jeopardizing ones’ financial security or life style. Only risk capital should be used for trading and only those with sufficient risk capital should consider trading. Past performance is not necessarily indicative of future results.

Hypothetical Performance Disclosure: Hypothetical performance results have many inherent limitations, some of which are described below. No representation is being made that any account will or is likely to achieve profits or losses similar to those shown; in fact, there are frequently sharp differences between hypothetical performance results and the actual results subsequently achieved by any particular trading program. One of the limitations of hypothetical performance results is that they are generally prepared with the benefit of hindsight. In addition, hypothetical trading does not involve financial risk, and no hypothetical trading record can completely account for the impact of financial risk of actual trading. for example, the ability to withstand losses or to adhere to a particular trading program in spite of trading losses are material points which can also adversely affect actual trading results. There are numerous other factors related to the markets in general or to the implementation of any specific trading program which cannot be fully accounted for in the preparation of hypothetical performance results and all which can adversely affect trading results.

Testimonial Disclosure: Testimonials appearing on this website may not be representative of other clients or customers and is not a guarantee of future performance or success.