Products
SentimenTrader Trading Tools
‍
Backtest Engine
My Trading Toolkit
Correlation Analysis
Seasonality
Indicators & Data API
‍
Proprietary Indicators & Charts
Market Data API
Strategies & Scanner
‍
50+ Trading Strategies
Smart Stock Scanner
Research Reports
‍
Research Solutions
Reports Library
Free Resources
Simple Backtest Calculator
Simple Seasonality Calculator
The Kelly Criterion Calculator
Sentiment Geo Map
Public Research Reports
Education
Sentiment Indicators
Technical Indicators
Pricing
Company
About
In the News
Testimonials
Client Success Stories
Contact
Log inLoginSign up
< BACK TO ALL REPORTS

The yield curve has done this only 3 other times

Jason Goepfert
2021-02-19
The 2-year / 10-year Treasury yield curve has cycled from negative to above 110 basis points for the 4th time in 30 years.

The U.S. Treasury market has seen some stiff selling pressure in recent days, on the heels of stiff selling in recent months. As a result, the benchmark 2-year / 10-year yield curve is the steepest in almost 5 years.

Whether this is a good thing or a bad thing depends upon whom you ask. Bulls will say it's a sign of recovery and good for financials, the bedrock of any sustainable rally. Bears will say it's the first prick in the TINA bubble that will clobber tech stocks, which have been powering most of the gains.

Opinions are a dime a dozen, so let's just objectively look at prior instances and see how things shook out.

There is no definitive date when the Federal Reserve explicitly began targeting the Fed Funds rate but academic literature seems to point to anywhere from 1982 to late 1987. So we'll go from there. 

With the yield curve, we'll use a setup and a trigger. The setup is when it drops toward or below 0, with the trigger being when it rises to its current level over 110 basis points.

2 year 10 year treasury yield curve

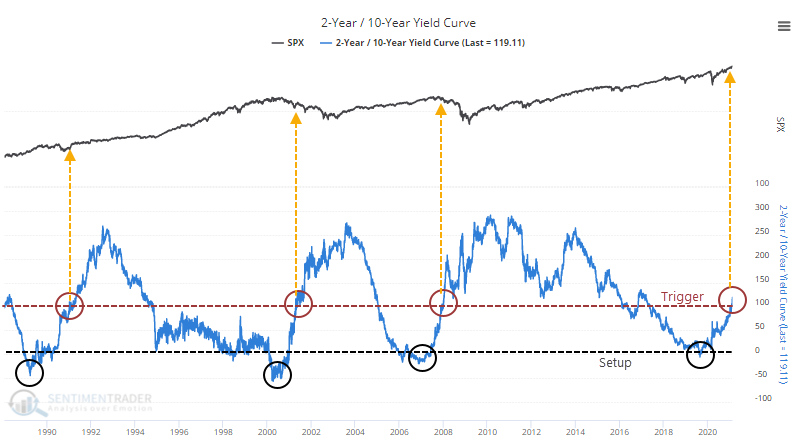
On a chart, it looks pretty ugly for the S&P 500. The numbers don't look especially great, either.

While the 1991 recovery led to good gains for stocks going forward, the last two clearly did not. Among other assets, factors, and sectors, there was some more consistency, especially one sector in particular.

What else we're looking at

  • Detailed returns for the S&P 500 following a recovery in the yield curve
  • Charts showing forward returns for other assets like gold and Treasury futures
  • What happened in factors and sectors following these signals
  • It's hard to trade a spike in volatility - Jay shows a good way with limited risk
  • A multi-part primer on what you're getting into with options trading
  • What the Risk Appetite Index is saying right now about stocks

Stat Box

Fewer than 40% of gold mining stocks now have a rising 200-day moving average. That's the fewest in more than 2 years. During healthy gold markets, this figure tends to hold above the 40% threshold.


Sentiment from other perspectives

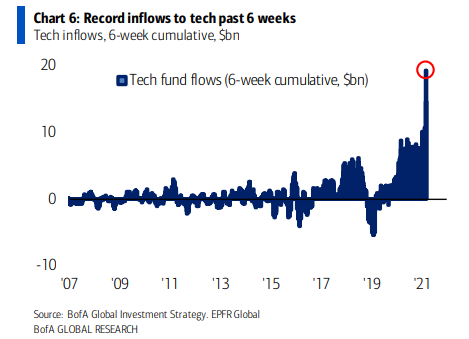
Buy the dip. Tech stocks may be faltering a bit, but trend-following ETF traders aren't paying any heed. Flows into technology stock funds has soared to a record high. Source: Mike Zaccardi

tech stock etf fund flow

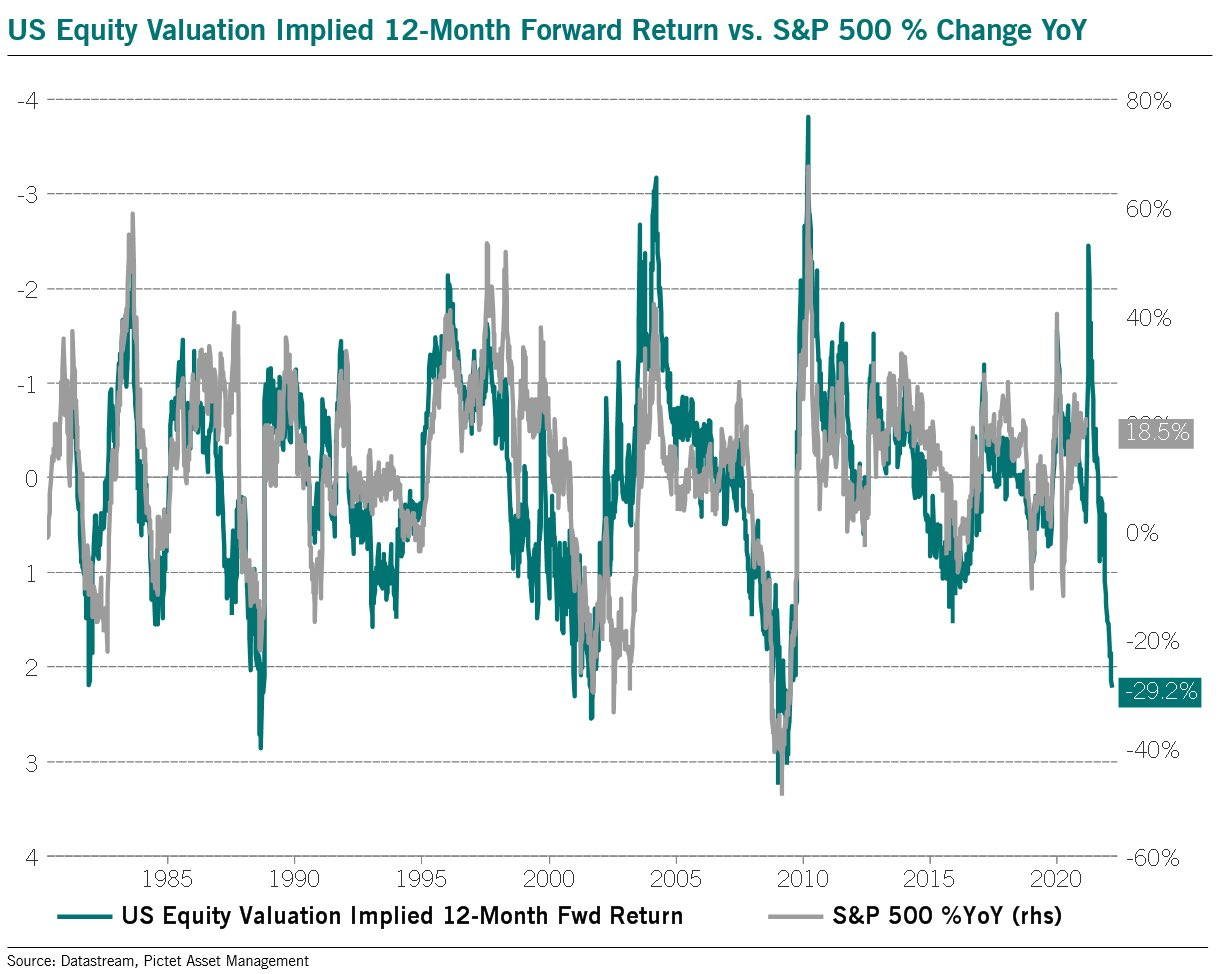
Who cares about value? The incessant rise in stocks amid high, even record, investor sentiment has pushed most valuation measurements to their most extreme levels in decades, if not ever. Such extreme readings have tended to lead to poor forward returns. Source: Julien Bittel

us equity valuation and forward returns

That's because things are bubbly. The probability is high that on a long time frame, the S&P 500 is in the bubble part of the cycle. Source: Financial Crisis Observatory

s&p 500 bubble

PRODUCTS
SentimenTrader
Trading Tools
Indicators & Data API
‍
Strategies & Scanner
‍
Research Reports
FREE
RESOUrCES
Simple Backtest
Calculator
Simple Seasonality
Calculator
The Kelly Criterion
Calculator
Sentiment Geo Map
‍
Public Research Reports
‍
Education
Sentiment Indicators
‍
Technical Indicators
‍
Pricing
Bundle pricing
‍
FAQ
‍
Announcements
‍
COMPANY
‍
About
‍
In the News
‍
Testimonials
‍
Client Success Stories
CONTACT
‍
General Inquiries
‍
Media Inquiries
‍
Financial Professionals Inquiries
‍
© 2025 Sundial Capital Research Inc. All rights reserved.
Setsail Marketing
TermsPrivacyAffiliate Program
Risk Disclosure: Futures and forex trading contains substantial risk and is not for every investor. An investor could potentially lose all or more than the initial investment. Risk capital is money that can be lost without jeopardizing ones’ financial security or life style. Only risk capital should be used for trading and only those with sufficient risk capital should consider trading. Past performance is not necessarily indicative of future results.

Hypothetical Performance Disclosure: Hypothetical performance results have many inherent limitations, some of which are described below. No representation is being made that any account will or is likely to achieve profits or losses similar to those shown; in fact, there are frequently sharp differences between hypothetical performance results and the actual results subsequently achieved by any particular trading program. One of the limitations of hypothetical performance results is that they are generally prepared with the benefit of hindsight. In addition, hypothetical trading does not involve financial risk, and no hypothetical trading record can completely account for the impact of financial risk of actual trading. for example, the ability to withstand losses or to adhere to a particular trading program in spite of trading losses are material points which can also adversely affect actual trading results. There are numerous other factors related to the markets in general or to the implementation of any specific trading program which cannot be fully accounted for in the preparation of hypothetical performance results and all which can adversely affect trading results.

Testimonial Disclosure: Testimonials appearing on this website may not be representative of other clients or customers and is not a guarantee of future performance or success.