
The worst year ever triggers a historic amount of Panic

Key points:
- The S&P 500 showed a negative average return following big up days and big down days in 2022
- Never before have both strategies led to such negative returns
- Stocks have tended to rebound following similar years, as well as after extremes in model Panic
The worst year ever for chasing rallies and buying dips
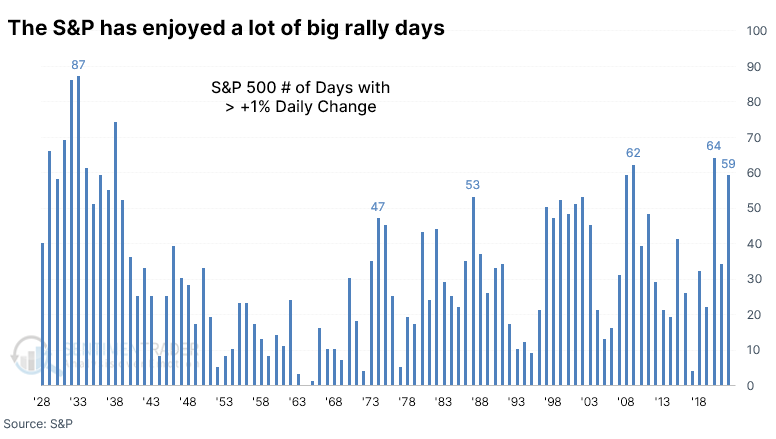
The worst year ever for investors ended like it spent most of the year - swinging wildly from one extreme to the other. Last week added to the large tally of days when the most benchmarked index in the world gained at least 1% in a single session.
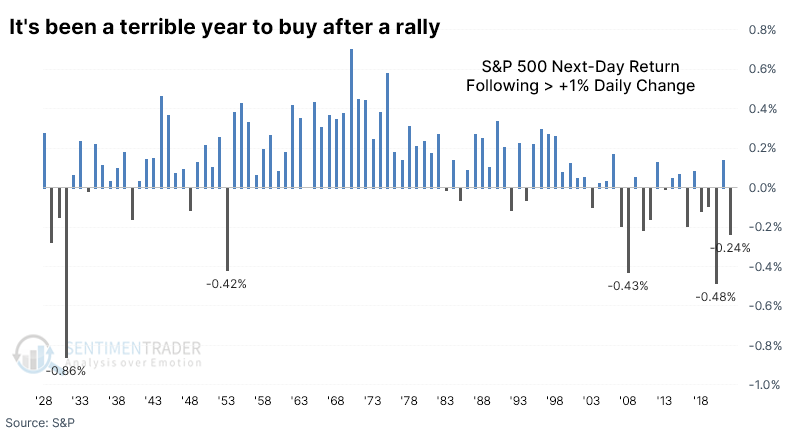
But traders who chased rallies, assuming they were the start of something good, were terribly disappointed. The S&P 500 returned an average -0.24% on the day following a big up day, ranking among the worst rally-chasing returns in its history.
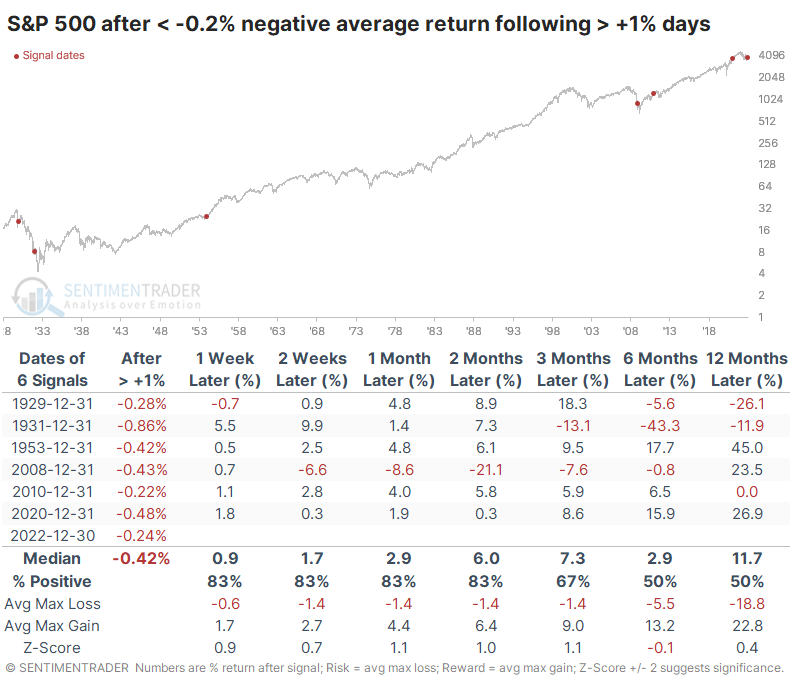
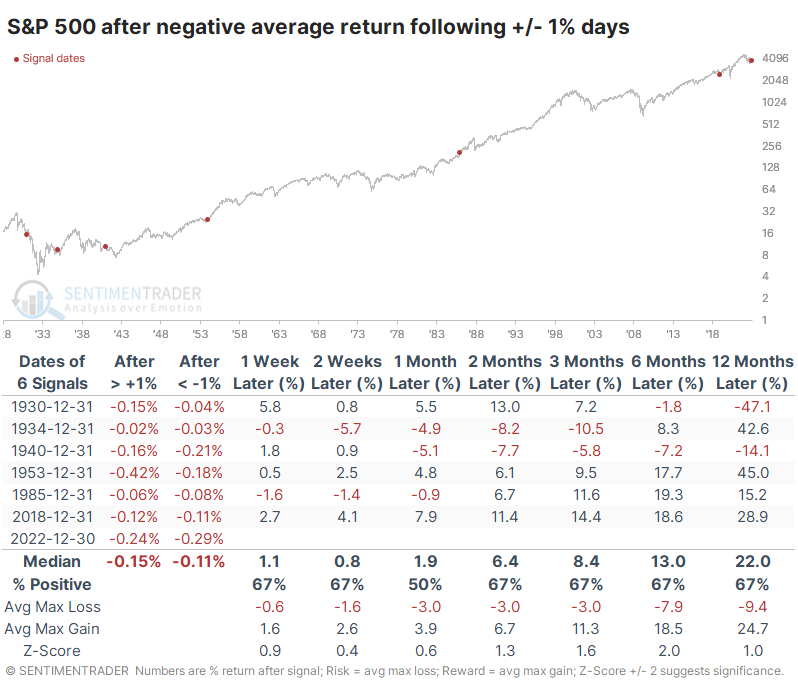
Following years when traders got burned so badly for chasing a rally, the index tended to rebound in the first couple of months of the new year, though the sample size is understandably tiny.
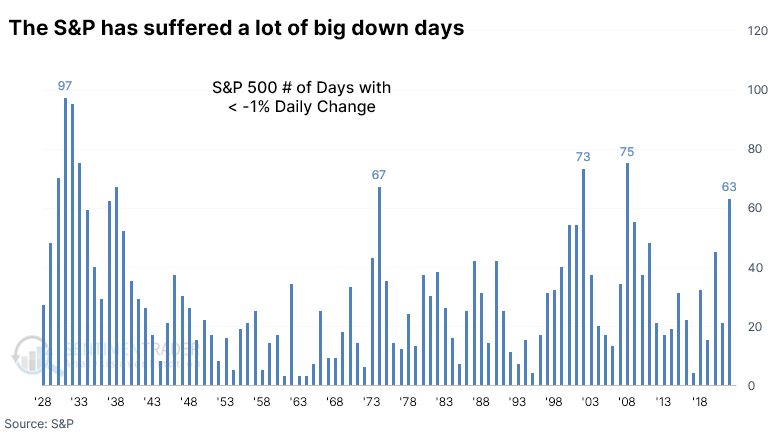
It wasn't just a year of big up days, of course. There were even more big down days, with the S&P recording 63 sessions with at least a 1% loss. That was the most since 2008 and was the 4th-largest number of days in the past 80 years.
Dip-buyers fared even worst than rally-chasers. The day after a big down day, the S&P lost an average of 0.29%, the worst performance since 1987.
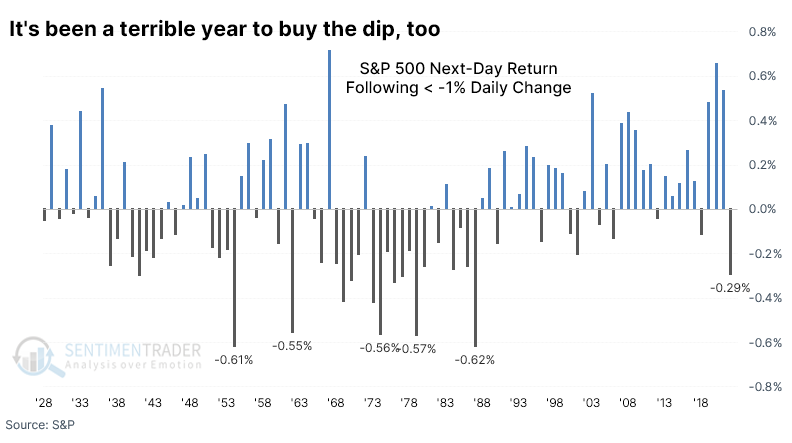
Adding to investors' woes, 2022 was the worst year ever for returns following a big day. It was the only year in history when the S&P lost at least 0.2% the day following either a 1% up day or a 1% down day.
The closest year to 2022 was 1953, when the S&P returned -0.42% following a big rally and -0.18% following a significant drop. At least investors got a reprieve the following year when the index jumped 45%.
The miserable returns have weighed on sentiment
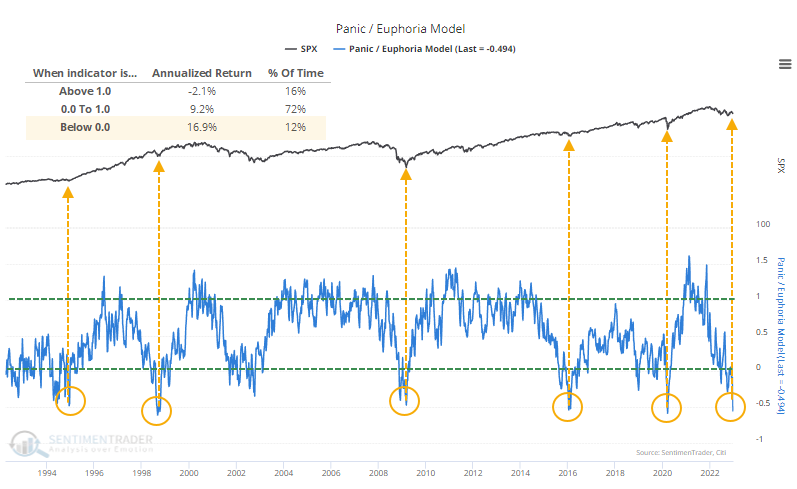
With returns like that, it's no wonder investors are despondent. While models vary, the Panic/Euphoria Model shows some of the worst sentiment in 30 years.
This model is based on the Citi Panic / Euphoria model published in Barron's magazine. It does not reflect those published values; rather, our interpretation of the model inputs and construction differs modestly from the published figures. It is composed of the following primary inputs:
- NYSE short interest
- Margin debt
- Nasdaq vs. NYSE volume
- Investor's Intelligence survey
- AAII survey
- Retail money market funds
- Put/call ratios
- Commodities prices
- Retail gasoline prices
The higher the model, the more investors are in a euphoric mood, with lower expected stock returns going forward. Low values, particularly below zero, suggest that investors have panicked and higher forward returns are expected. Since the model became less volatile in 1993, the S&P's annualized return when the model was below zero is +16.9%.
It has sunk far below that over the last couple of weeks. Thanks to plunging values in some of the inputs, the model exceeded -0.5 for one of the few times in its history.
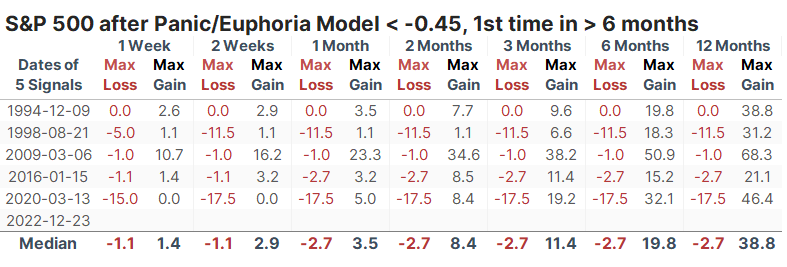
Foreward returns were exceptional whenever Panic exceeded -0.45 for the first time in at least six months. This doesn't include October 2002, when it barely missed the cutoff. That signal returned +25.1% over the next year.
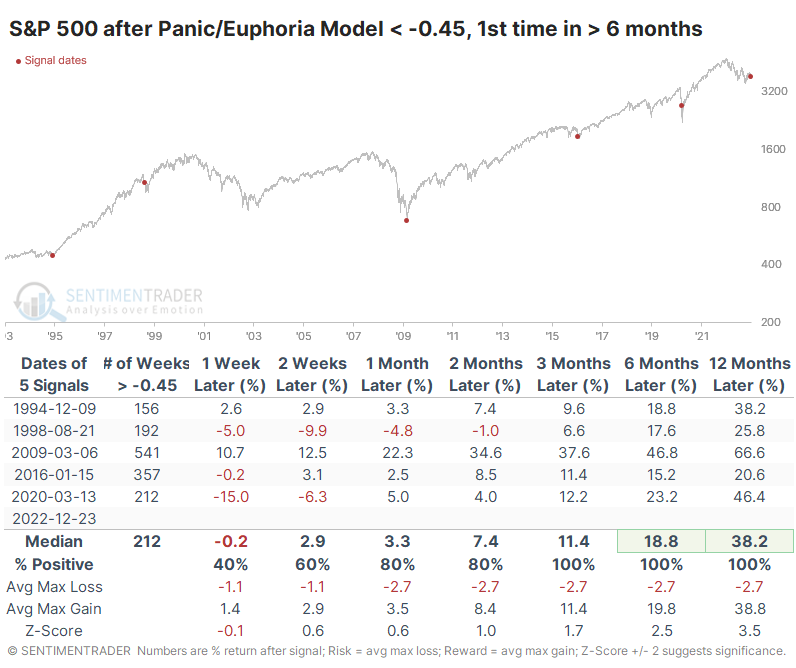
A table of maximum gains and losses over each time frame shows that the 1998 and 2020 signals were quite early, and the S&P suffered double-digit losses almost immediately. These were the final meltdown phases of the declines, and losses were quickly reversed.
What the research tells us...
A miserable year for investors in nearly any financial asset, 2022 will go down as historic in many respects. Not least among them is a year in which traders faced losses after either chasing rallies or buying dips to an extent never seen before. There has been a tendency to see some relief in the first weeks after less-miserable years. It should help that sentiment has deteriorated, though whether it's extreme enough isn't conclusive. Several models have only declined to the lower end of neutral. The Panic/Euphoria Model has been quite accurate over the decades, and its current extreme suggests positive medium- to long-term returns after the horrid ones just passed.