
The worst year ever for trading

There has never been a worse time to be a technician.
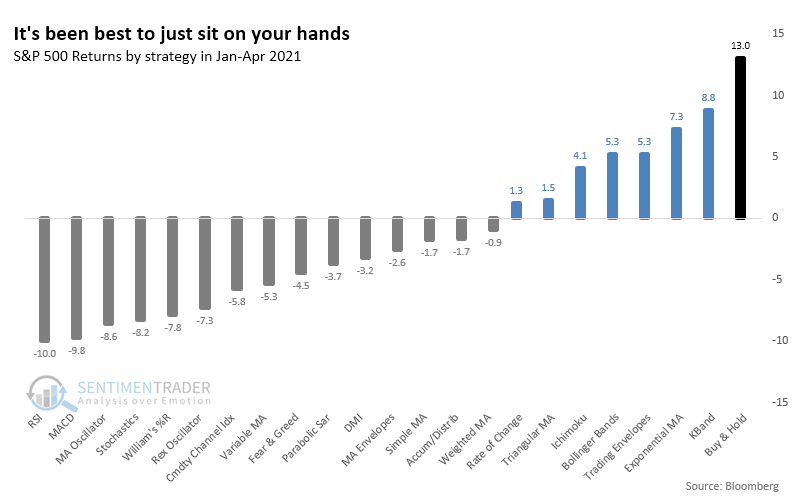
Out of 22 technical trading strategies followed by Bloomberg, only 7 have shown a profit in 2021. That's among the fewest in 25 years.
As Bloomberg notes:
"It's testament to the straight-up trajectory of stocks that virtually all signals that told investors to do anything but buy have done them a disservice this year. In fact, when applied to the S&P 500, 15 of 22 chart-based indicators tracked by Bloomberg have actually lost money..."
Granted, there is no wiggle room for interpretation here. Backtests require rules, and the rules use default settings. That doesn't allow for optimization or experience.
Backtests might show that using the Relative Strength Index (RSI) was a money-loser this year - indeed, it was the worst indicator - but in the hands of an experienced technician, it could have been wonderfully useful. And adjusting the length of some moving average strategies could have had a trader invested all year as momentum ruled, instead of being whipsawed on shorter-term moves.
With that said...
NOTHING WORKED
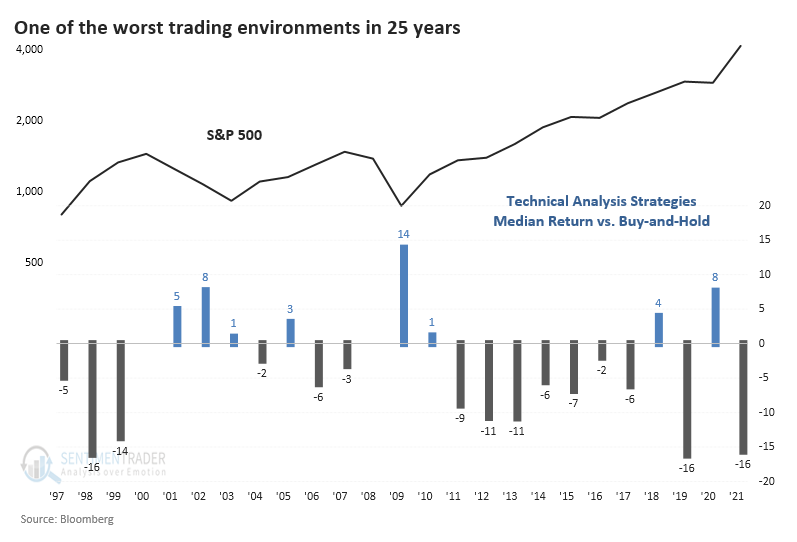
The list of strategies shows how few have shown a positive return, with none beating buy-and-hold.
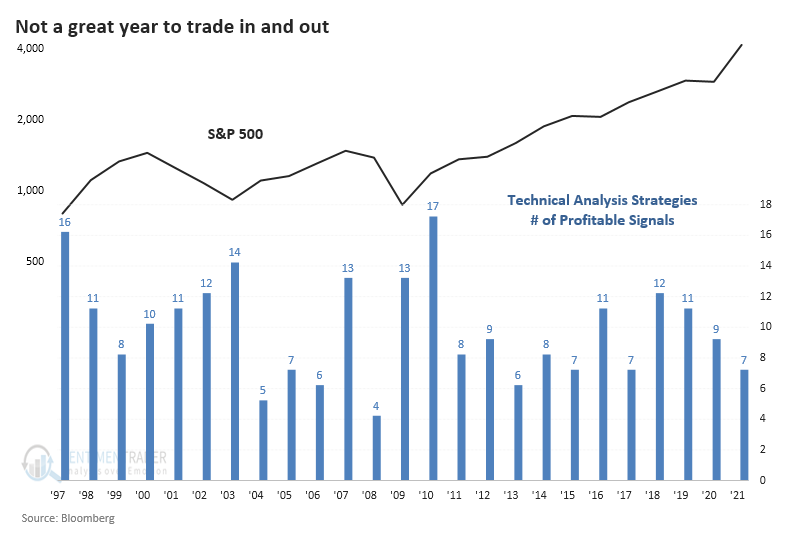
Going back as far as we can using daily backtesting data, this year is among the worst for using technical trading strategies through April. In 2008, only 4 strategies showed a YTD gain through April, while in 2010, almost all of them did.
We could assume that when the trading environment is poor, then it likely means that the S&P 500 showed heavy momentum one way or the other. So the beginnings of years when it didn't pay to trade in-and-out might show some mean-reversion going forward.
To check, the table below shows the years with the worst records for technical indicators from January through April. These are years when 7 or fewer strategies showed a profit.
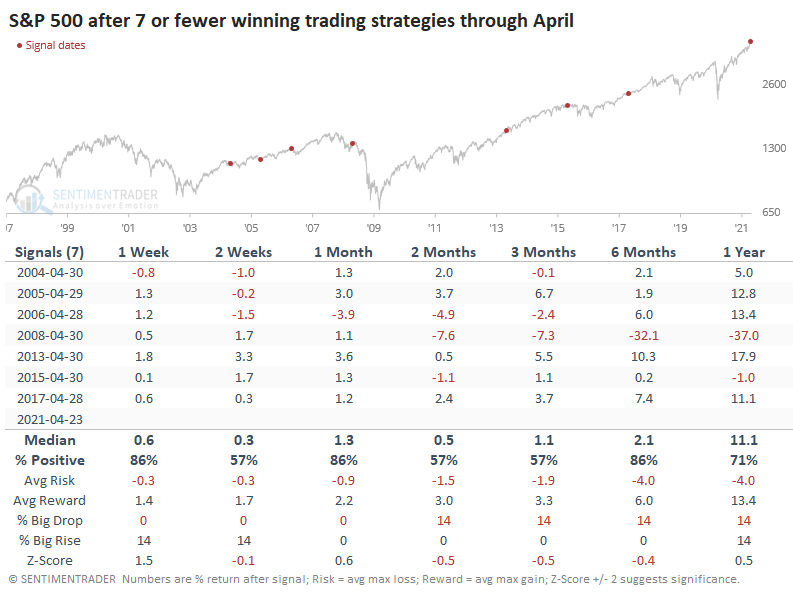
Meh. Out of the 7 years, 4 of them showed a negative return either 2 or 3 months later, 2 of the others sported only meager or temporary gains, while the last one, in 2017, preceded the nothing-matters market that ran over everything.
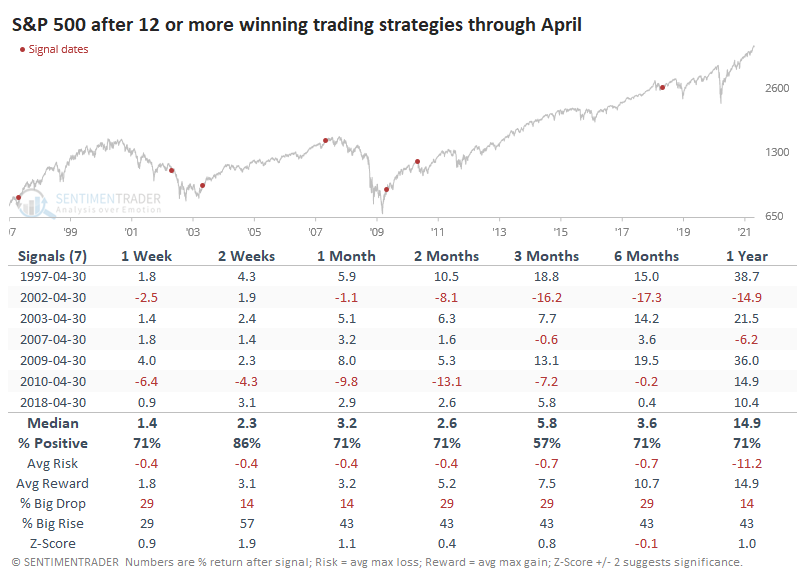
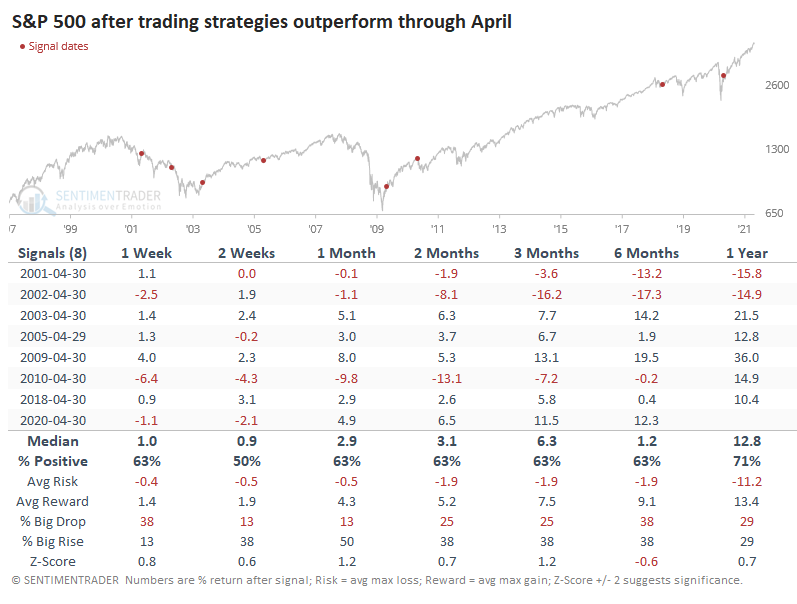
Contrast that to years when trading was more advantageous. In those years, forward returns were quite a bit better in the months ahead. Over the next 3 months, the S&P averaged a return of +5.8%, versus the +1.1% from the prior table. There were a couple of large losses among them, though.
THE WORST UNDERPERFORMANCE EVER
Not only have few strategies shown a profit, but their median return has been horrendous. The median return across all 22 strategies has lagged buy-and-hold by 16% so far this year, tied for the worst ever.
There have been 5 other years when the strategies' median return lagged the market by 10% or more. Each one of them triggered during big run-ups in the S&P, and again, forward returns were poor.
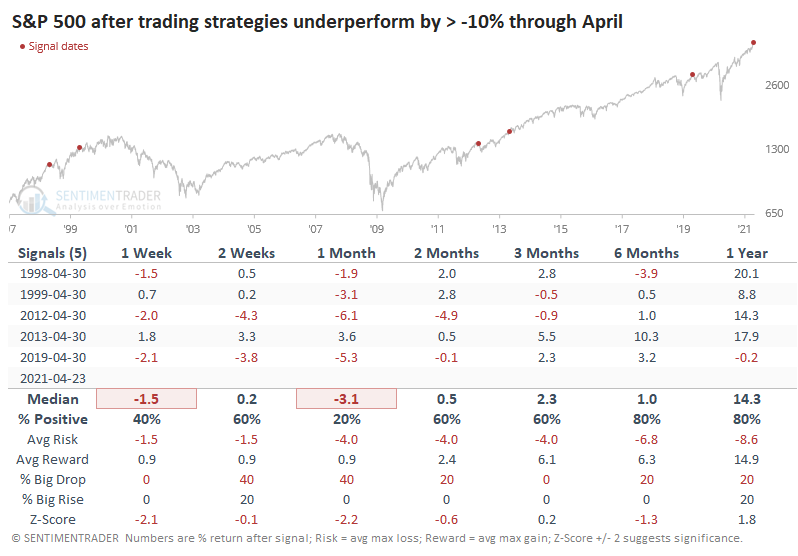
When we look at years that were more amenable to trading, then returns improved significantly over the short-term.
YEARS WITH THE WORST TECHNICAL TRADING ENVIRONMENTS
If we combine the consistency of the trading strategies and their median returns, then 2021 ranks among the very bottom. Other years with poor trading environments showed that the S&P struggled in the months ahead.
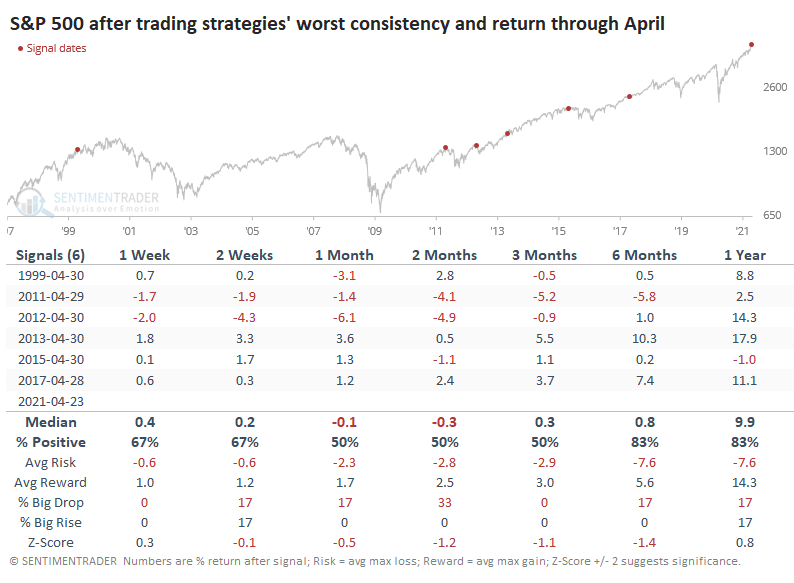
Out of the 6 years with the worst trading environments through April, 5 of them showed either a negative or barely positive return in the months ahead, again with 2017 being the only real exception.
We wouldn't put a lot of weight on this data, but it is an interesting way to look at the mostly one-way trend in stocks this year. Momentum has overwhelmed everything, which is great if you're that kind of trader. And it can persist for a long time. The biggest issue is that when we see data like this, it means the momentum is likely to wane. Of course, we've seen data like this for a couple of months, at least, and here we are at record highs. What a market.