Products
SentimenTrader Trading Tools
‍
Backtest Engine
My Trading Toolkit
Correlation Analysis
Seasonality
Market Prediction
Indicators & Data API
‍
Proprietary Indicators & Charts
Market Data API
Strategies & Scanner
‍
50+ Trading Strategies
Smart Stock Scanner
Smart Option Scanner
Research Reports
‍
Research Solutions
Reports Library
Free Resources
Simple Backtest Calculator
Simple Seasonality Calculator
The Kelly Criterion Calculator
Sentiment Geo Map
Public Research Reports
Education
Sentiment Indicators
Technical Indicators
Pricing
Company
About
In the News
Testimonials
Client Success Stories
Contact
Log inLoginSign up
< BACK TO ALL REPORTS

The worst IPO market in 37 years

Jason Goepfert
2022-08-31
The IPO market has become the worst of all time. Over the past 12 weeks, the dollar value of IPOs larger than $25 million has dropped to the lowest since at least 1985, exceeding even October 2008. This is typical behavior in the discouragement phase of a typical sentiment cycle.

Key points:

  • Investors' appetite for providing capital to newly public companies has completely dried up
  • The dollar value of non-SPAC IPOs of more than $25 million has plunged to the lowest in 37 years
  • A shortage of activity like this is typical in the discouragement phase of a typical sentiment cycle

The IPO market has gone silent

A little over a year ago, it was the best of times. At least, it was for money-losing operators looking to cash out and the bankers who feed on them. As we saw last June, we were amid a speculative frenzy with only two precedents.

Things have changed, and in a big way. That market has completely dried up. The Wall Street Journal noted just how dire the environment has been for investment bankers.

The U.S. IPO market has achieved a new superlative-by one measure, it's now in its longest drought in more than two decades. The culprit: soaring inflation, rising interest rates, fear of an impending recession and a volatile stock market.

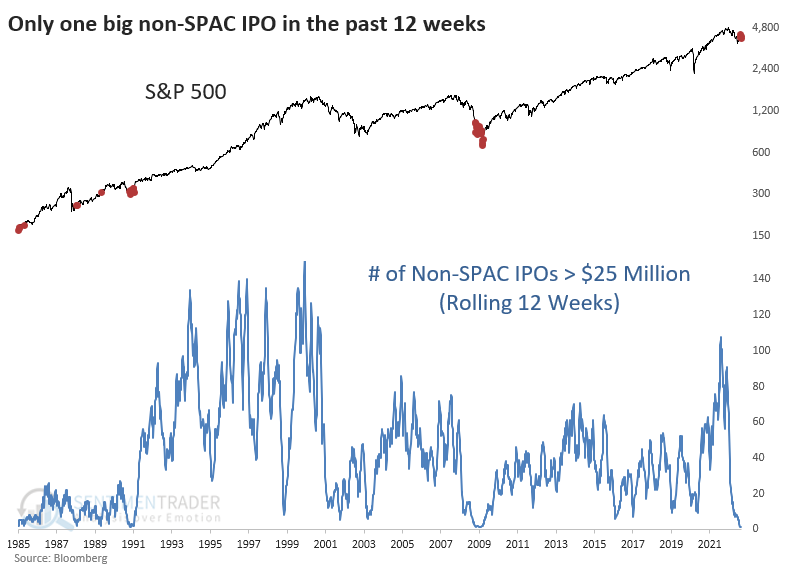
It's been 109 days since a U.S. company raised at least $25 million in a traditional IPO, according to Dealogic data analyzed by accounting firm PwC. That edges out the previous longest drought on record in 2008, when there were no U.S. IPOs raising at least $25 million for 103 days between August and November.

According to Bloomberg data, since May, there has been only one IPO with proceeds greater than $25 million when ECB Bancorp raised $89 million in late July. We're removing special purpose acquisition companies (SPACs) from the equation because they distort the figures and aren't actual operating companies.

The chart below shows just how unusual it is for the IPO market to dry up so thoroughly and for such an extended period. It shows a rolling 12-week sum of IPOs in the U.S. that priced an offering greater than $25 million - again, excluding SPACs. The red dots highlight similar troughs in activity.

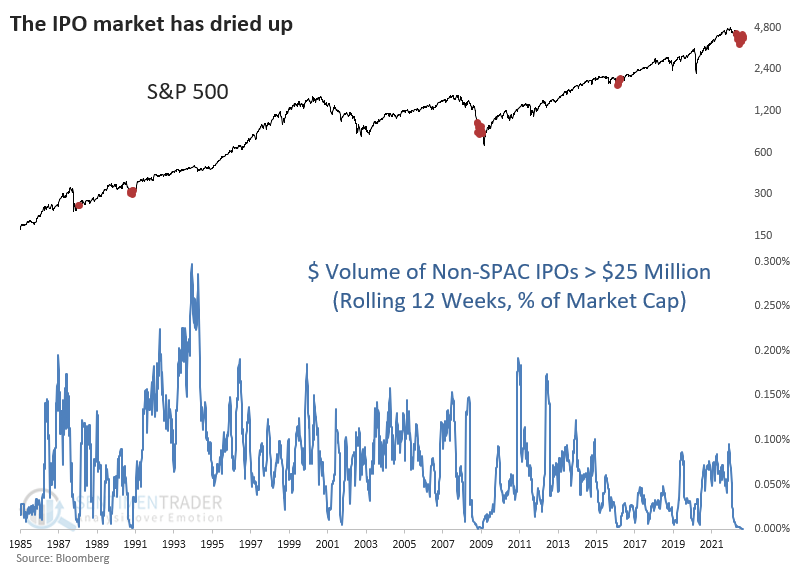
If we look at the dollar amount raised, it's pretty much the same story but even more extreme. As a percentage of the market capitalization of all U.S. stocks, the last three months have seen the lowest amount ever, dating to 1985. This even exceeds the last dry spell from October 2008.

What the research tells us...

The performance of the IPO market is not a precise timing mechanism by any stretch. As we saw last year, it's more of a broad indicator of the market environment and where we may be in the typical sentiment cycle.

Investment bankers will feed investors whatever they're pining for, and right now it is NOT young companies looking for capital. That suggests we're in the discouragement phase of the cycle. That can last a while and is often accompanied by wide swings that don't take us much of anywhere. The bright side is that it also usually means that even if stocks decline in the weeks and months ahead, it probably wouldn't be to much lower lows.

PRODUCTS
SentimenTrader
Trading Tools
Indicators & Data API
‍
Strategies & Scanner
‍
Research Reports
FREE
RESOUrCES
Simple Backtest
Calculator
Simple Seasonality
Calculator
The Kelly Criterion
Calculator
Sentiment Geo Map
‍
Public Research Reports
‍
Education
Sentiment Indicators
‍
Technical Indicators
‍
Pricing
Bundle pricing
‍
FAQ
‍
Announcements
‍
COMPANY
‍
About
‍
In the News
‍
Testimonials
‍
Client Success Stories
CONTACT
‍
General Inquiries
‍
Media Inquiries
‍
Financial Professionals Inquiries
‍
© 2026 Sundial Capital Research Inc. All rights reserved.
Setsail Marketing
TermsPrivacyAffiliate Program
Risk Disclosure: The information and tools provided are for research and analytical purposes only and are not intended as investment advice. Market analysis involves uncertainty, and outcomes may differ from expectations. Users should conduct their own due diligence and consider their individual circumstances before making any financial decisions. Past performance is not necessarily indicative of future results.

Hypothetical Performance Disclosure: Hypothetical performance results have many inherent limitations, some of which are described below. No representation is being made that any account will or is likely to achieve profits or losses similar to those shown; in fact, there are frequently sharp differences between hypothetical performance results and the actual results subsequently achieved by any particular trading program. One of the limitations of hypothetical performance results is that they are generally prepared with the benefit of hindsight. In addition, hypothetical trading does not involve financial risk, and no hypothetical trading record can completely account for the impact of financial risk of actual trading. for example, the ability to withstand losses or to adhere to a particular trading program in spite of trading losses are material points which can also adversely affect actual trading results. There are numerous other factors related to the markets in general or to the implementation of any specific trading program which cannot be fully accounted for in the preparation of hypothetical performance results and all which can adversely affect trading results.

Testimonial Disclosure: Testimonials appearing on this website may not be representative of other clients or customers and is not a guarantee of future performance or success.