
The Volatility Index (VIX) cycles to a multi-year low

Key points:
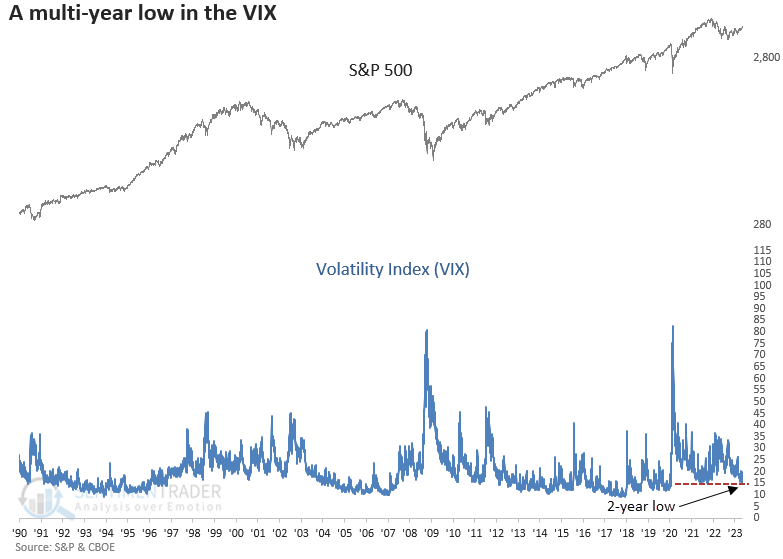
- The Volatility Index (VIX) closed at a new 2-year low on Friday
- Similar multi-year lows in the VIX preceded a consistent upward bias in the S&P 500
- The 2-year low in the VIX coincided with a 9-month high in the S&P 500, which is also bullish
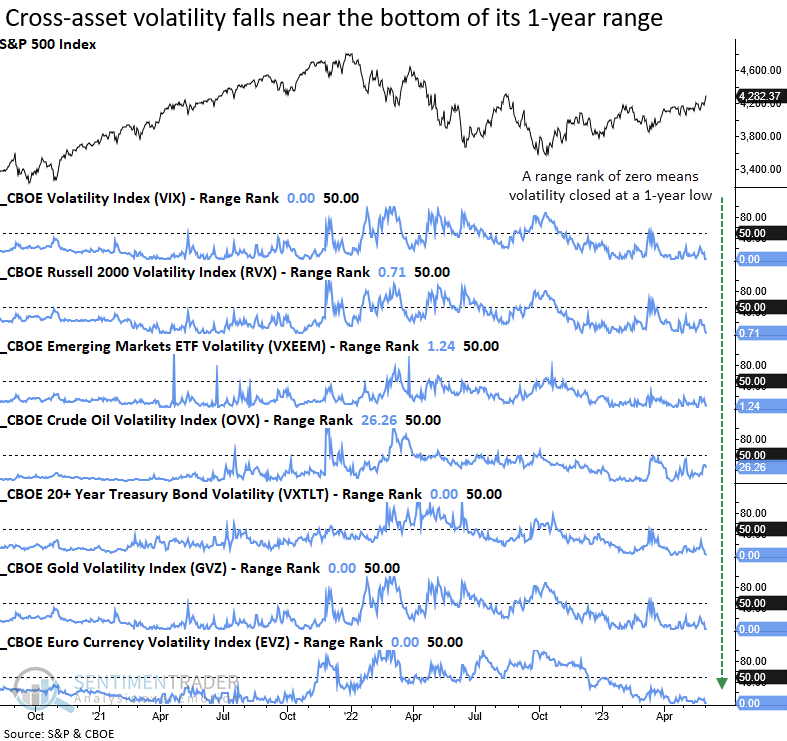
- Cross-asset volatility has fallen near the lowest level in a year
Low volatility is a hallmark of bull markets, not bear markets
The Volatility Index (VIX), a measure of 30-day anticipated volatility in the U.S. stock market derived from call and put options on the S&P 500 Index, closed at a 2-year low on Friday.
The multi-year low in the VIX suggests the market could be transitioning from a higher volatility regime to a lower one, which is critical for traders to understand. In a reduced volatility environment, day-to-day swings are smaller, so traders must adjust their expectations.
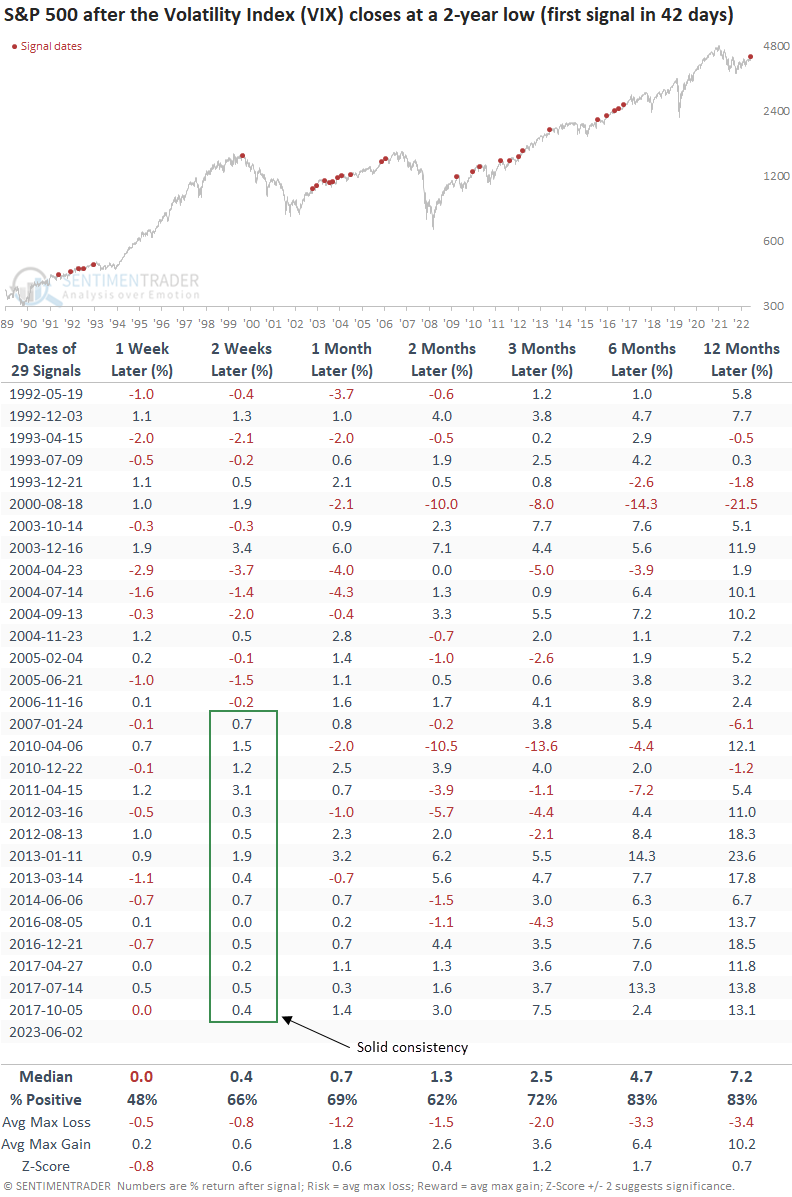
Similar breakdowns in the VIX led to positive returns for the S&P 500
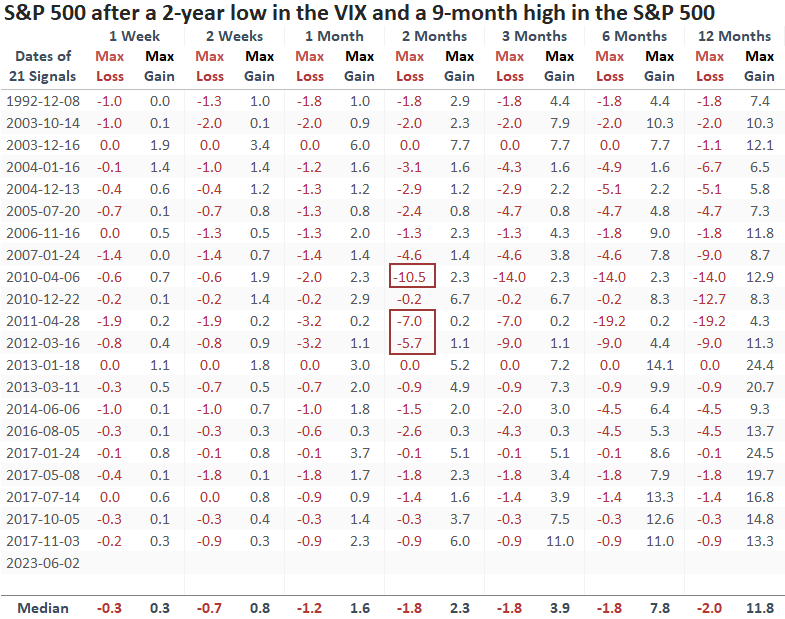
Multi-year lows in the VIX tend to occur in bull markets, not bear markets. Except for August 2000, every 2-year low in the VIX occurred in a bull phase, leading to an upward bias in stocks. Recent consistency was excellent in the two-week time frame, which hasn't had a loss since 2006.
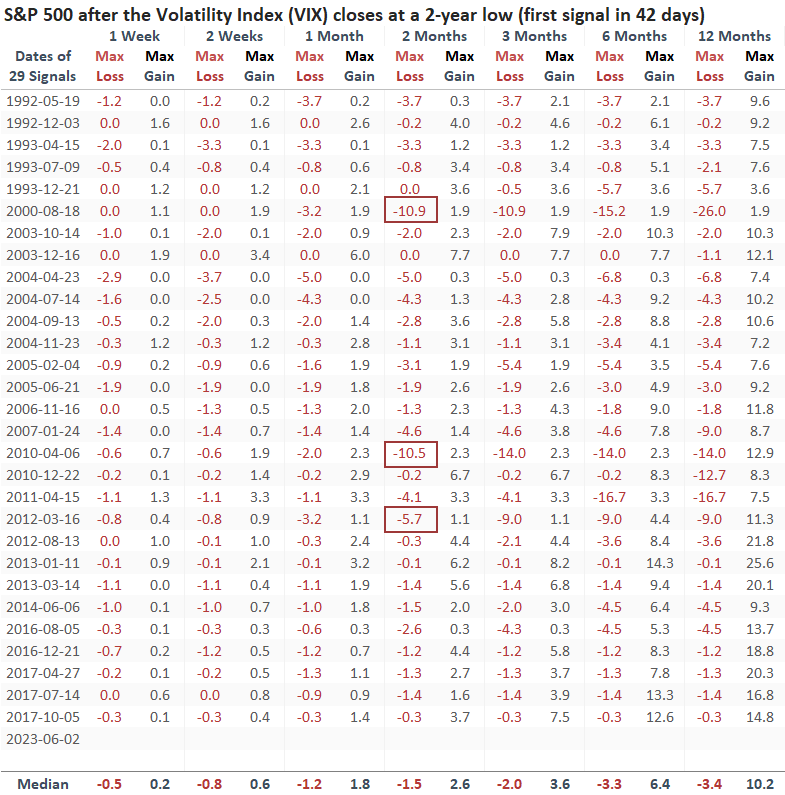
Over the first two months, the max loss exceeded -5% only three times. So, once the VIX falls to a multi-year low, the S&P 500 tends to avoid significant drawdowns in the next couple of months.
Additional context
The 2-year low in the VIX coincided with a 9-month closing high for the S&P 500. Similar precedents led to slightly better results than an outright multi-year low in the VIX. And by including the 9-month high condition, not a single instance occurred in a bear market.
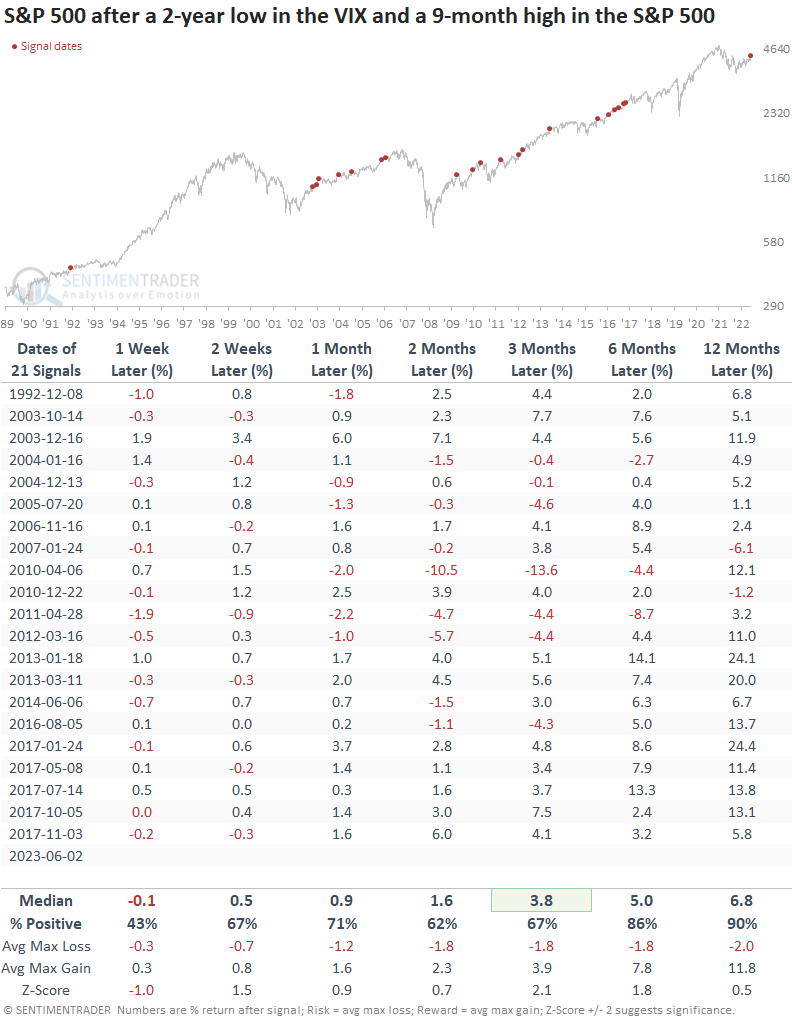
Once again, a max loss of greater than -5% was rare, with only three precedents over the next two months.
What about other asset classes
It's not just the VIX that is falling to new lows. Except for crude oil, the volatility index for other asset classes has collapsed near the bottom end of their 1-year ranges.
What the research tells us...
The Volatility Index (VIX) closed at a new 2-year low. Multi-year lows in the VIX have historically been bullish for stocks. When the 2-year low in the VIX coincides with a 9-month high in the S&P 500, the stock market outlook is slightly better than an outright low in volatility. More importantly, the signal has never occurred in a bear market. With lower volatility comes smaller day-to-day swings. So, traders must adjust accordingly.