
The VIX just gave a buy signal for stocks

Key points:
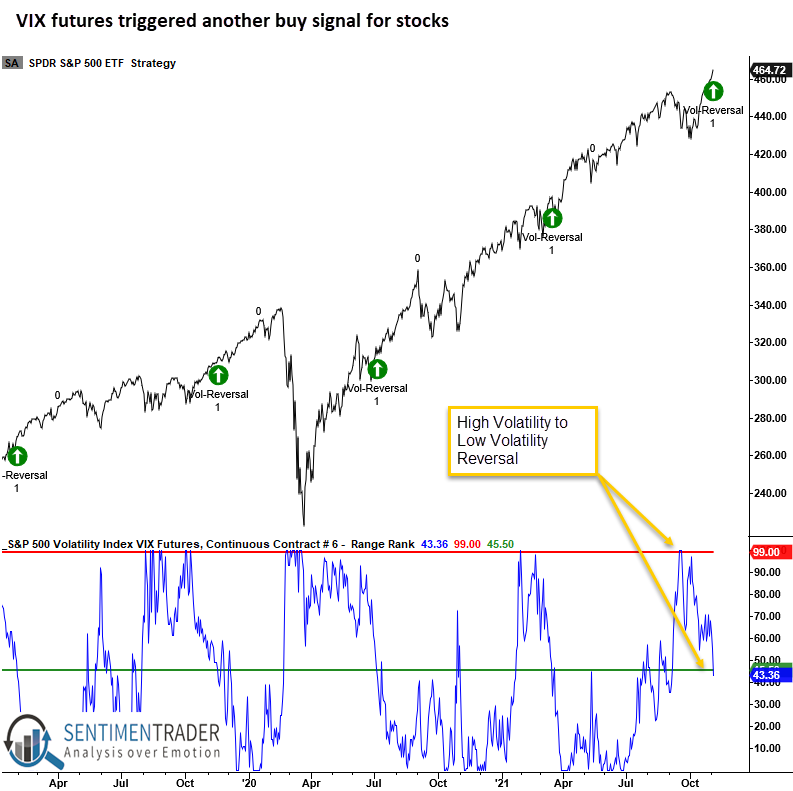
- VIX futures show that volatility cycled from high to low relative to its recent range
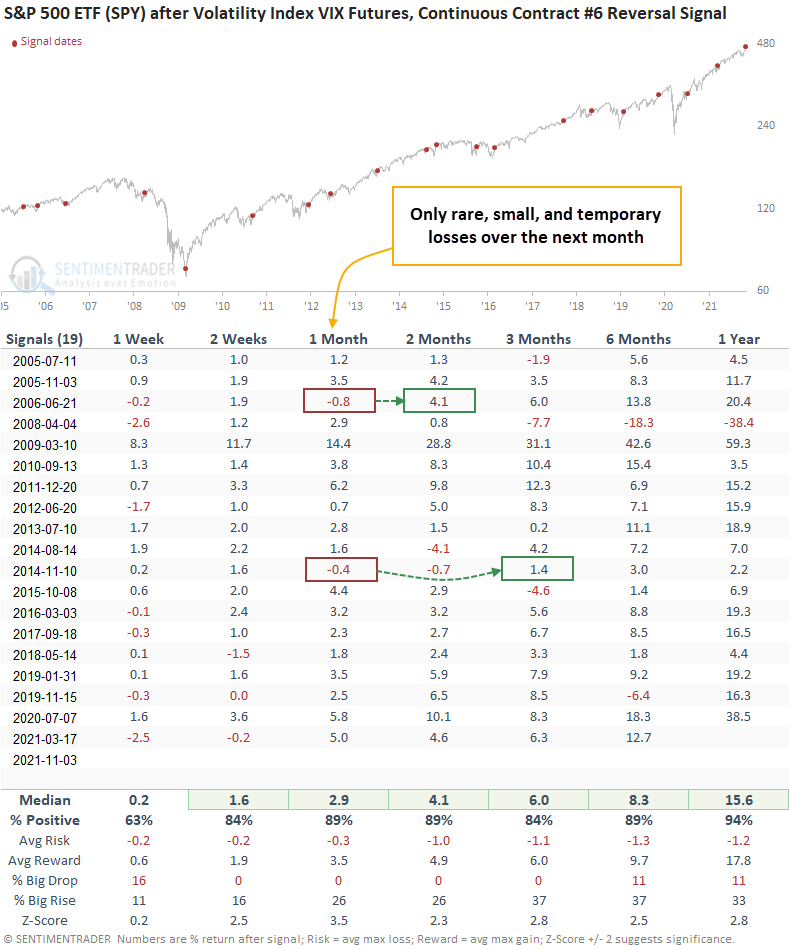
- The S&P 500 rallied 89% of the time over the next 1-2 months after other signals
Using the VIX as a way to measure volatility cycles
A trading model that uses VIX futures to identify when volatility cycles from high to low issued a buy signal at the close of trading on Wednesday.
The VIX Futures Range Rank signal triggers when the 4-month range rank for the VIX Futures Continuous Contract #6 reverses from a period of high volatility to low volatility. I use the 6-month continuous contract versus shorter duration contracts as the middle of the futures curve provides slightly better trading results.
This same signal was triggered in March, which ended up leading to another rally.
SPY rallied 89% of the time after other signals
This signal has triggered 19 other times over the past 16 years. After the others, future returns in SPY were solid in 6 out of 7 time frames. The most recent signal from March stumbled out of the gate then quickly recovered. Like the current one, that signal occurred when the S&P 500 was trading at a new high.
What the research tells us...
When stocks go from a period of high to low volatility, it signals that investors have started to calm down after a panic, or at least heightened concern. Using VIX futures to measure that change in sentiment, similar setups to what we're seeing now has preceded rising prices for SPY almost every time over the medium-term.